
Industrials: The Marginal Driver of Equities Right Now?
How regime dynamics, forward demand, and capital discipline are lifting the equity tape

A beautiful start to the week. I’m spending time thinking carefully about some of the decisions I need to make as we are now well into the start of the year.
Now, I’m not going to bore you with real rates again, I’ll save that for another date. If you want a refresher on how real rate dynamics have directly driven equities, go back and look at the 2 reports I shared earlier. This one goes a bit more under the surface.


Sector leadership is critical to watch, but there isn’t just one correct mix that supports upside in equities. We’ve already seen that play out. From June to September, industrials, tech, and energy led. By year end, it was healthcare, tech, and industrials. Sector performance matters a lot, but you don’t want to fall into the trap of seeing healthcare leadership and immediately assuming the market is positioning defensively for an equity downturn. That mindset will make you miss setups and, worse, react for the wrong reason. Strong healthcare fundamentals don’t automatically equal defensive positioning.
This is the sector mix right now as ES has been pushing higher since late November.
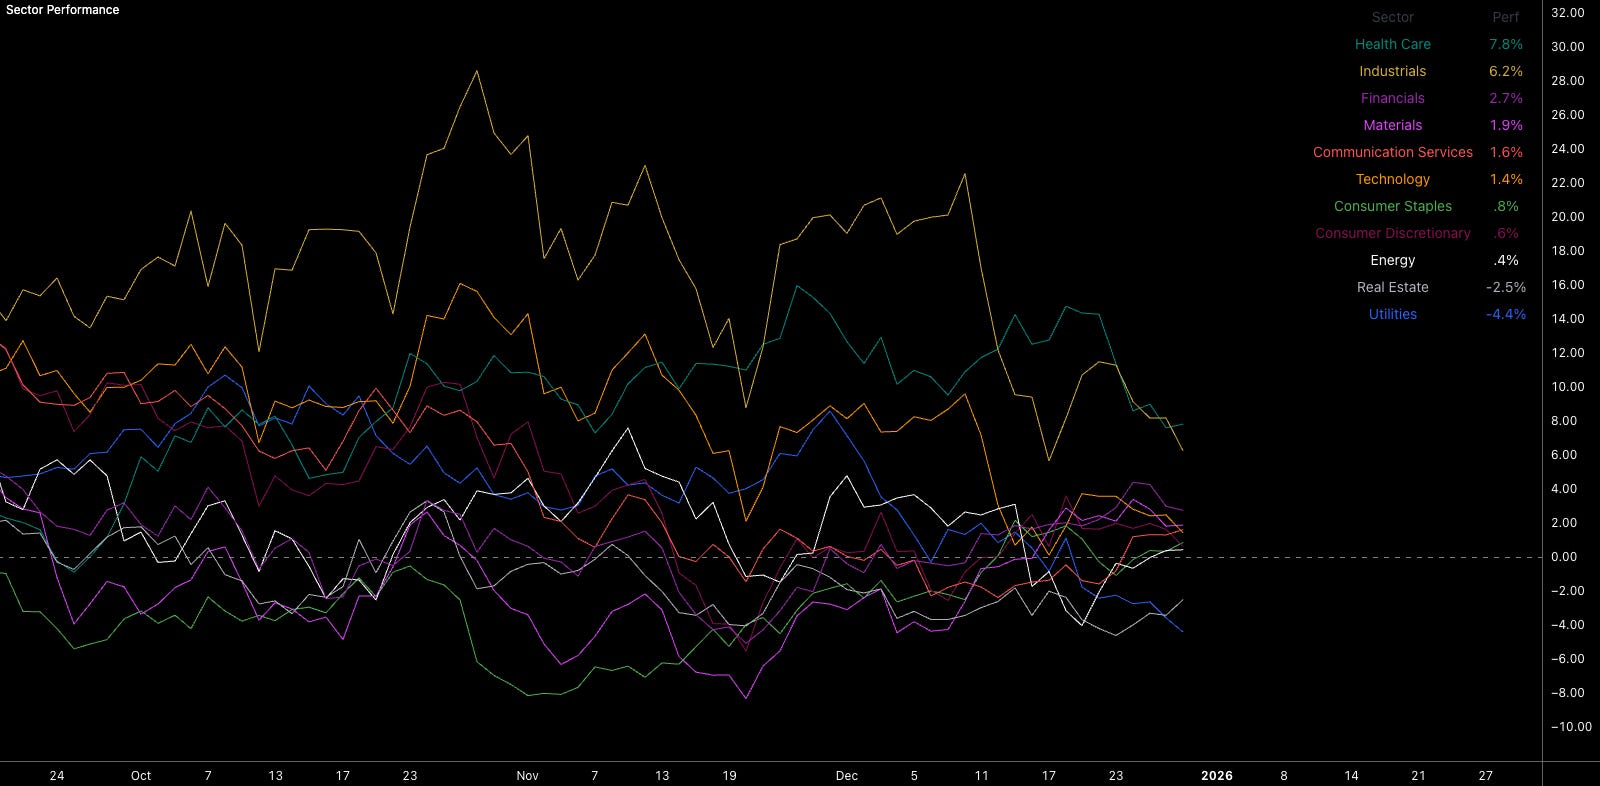
If we exclude healthcare, since it’s only been a more recent contributor to this rally, I want to focus on industrials. This has been massively under discussed compared to tech, which floods my inbox daily. Industrials are quietly contributing marginal upside to broad equity indices, and they’re ultimately driven by regime dynamics. So the key question is, what do the fundamentals actually look like?
Industrials
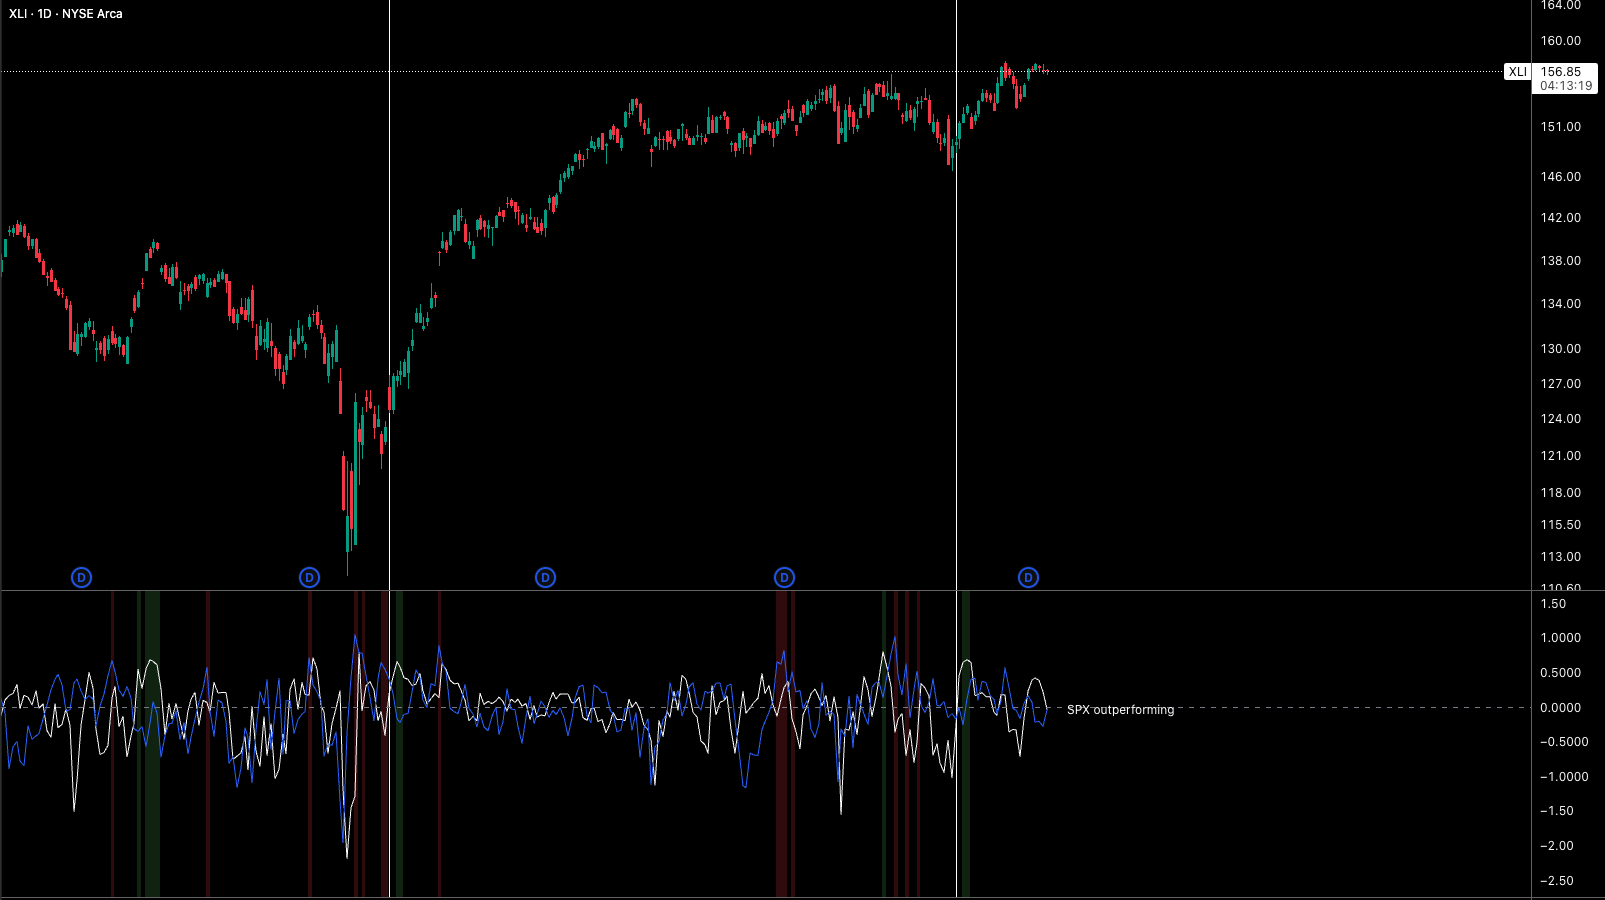
The XLI industrials ETF has been pushing higher with real momentum, up over 40% since the April lows. This has been driven by excess growth and inflation still in the system, all while SPX has been outperforming credit. Credit risk remains last on my list of worries for now.
Industrials are such a telling sector when it comes to recession risk. All year long people laid out endless recession scenarios, yet industrials kept making new highs and led all sectors. It’s always important to map out the risks in the economy and ask which one matters most. Duration, inflation, growth, or credit. Lay those out clearly and they’ll tell you a lot.
Industrials are influenced by multiple factors, but predominantly growth. And growth has arguably carried the lowest risk over the past 6 months, some would argue credit has. Inflation risk and duration risk, on the other hand, have posed far more downside threat to equities than growth. Simple as that.
When industrials are rallying, it’s a strong signal that recession risk is low. This sector sits on the front line of real economic activity. Orders, capex, transportation volumes, construction, manufacturing demand, all flow through here. Industrials usually weaken well before recessions, as companies pull back on spending. A sustained rally tells you the opposite. Firms are still investing, supply chains are active, and end demand hasn’t rolled over.
Historically, recessions don’t begin with industrials making higher highs. They begin when industrials underperform defensives and earnings expectations collapse. If capital goods, transports, and machinery are getting bid, the economy is expanding, simple.
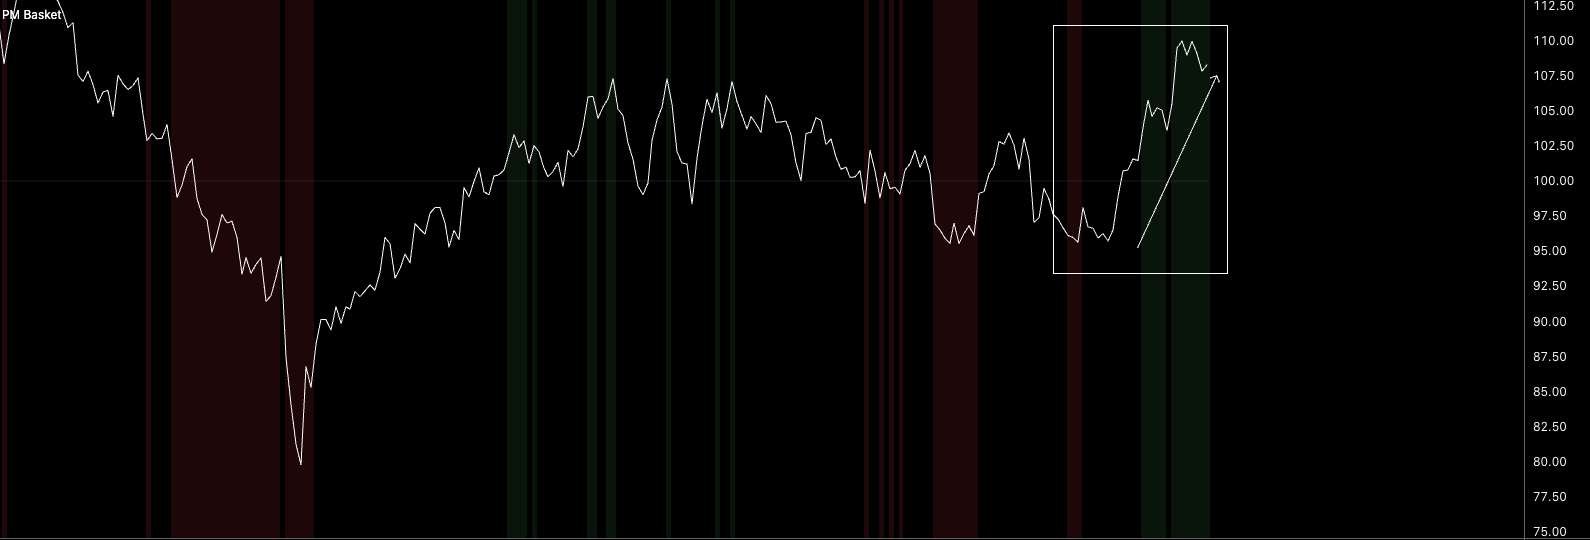
The most important question is whether goods are actually moving. Looking at my purchasing managers basket model, it’s rallying aggressively alongside new highs in industrials. That is not a setup for an immediate downturn. Ultimately, growth in the system poses a low threat. If the doomers want to focus on something, it should be duration risk, which I’ll do a write up on soon.
So does the industrials sector have legs to go higher? Absolutely.
Beginning pretty zoomed out, a key macro question for 2026 is what happens to the FDI deals Trump negotiated. Bloomberg has tallied roughly 7TRN in commitments. Even if you spread that evenly, you’re talking about roughly 700BN of FDI next year. Even 250 to 300BN would be massively bullish for industrials.

Even a fraction of those commitments flowing through in 2026 would materially benefit industrials, infrastructure, and related sectors. Capital deployment at that scale drives revenue visibility and long term growth, which obviously creates a very constructive macro backdrop.
Another chart worth focusing on is the z score of expected new orders from regional Federal Reserve manufacturing surveys. In plain English, it shows directional intent inside the industrial economy, what manufacturers expect demand to look like going forward, not what it looked like last quarter. That distinction matters because equities trade expectations.

What jumps out immediately is the sharp rebound from deeply negative readings. Historically, when this series troughs at extreme negative z scores and then turns higher, it tends to mark inflection points in the industrial cycle, not peaks. This improvement is happening after a prolonged period of pessimism, inventory digestion, and cost pressure, exactly the conditions that usually precede stabilisation and re acceleration in orders.
This is occurring even though there’s widespread narratives around weak manufacturing, bankruptcies, and margin pressure. Industrial bankruptcies flush excess capacity, labour, and leverage out of the system. By the time expectations turn higher, much of the damage is already done and equity markets start looking through it.
From an equity perspective, expected new orders matter far more than current output. Industrials sit at the front of the earnings transmission chain. Rising order expectations feed directly into higher capacity utilisation, operating leverage on fixed costs, improving forward earnings revisions, and broader equity multiple support.
This also explains why industrials can rally even when backward looking data still looks ugly. Moving from very bad to less bad is often enough to drive meaningful price action in cyclical sectors.
Now let’s talk valuation. The free cash flow yield spread of solid waste companies versus the S&P 500 is extremely important. The sector is trading at its largest valuation discount to the index in more than a decade. Investors are being paid significantly more in free cash flow to own a core industrial services subsector than to own the market. That’s been very rare outside of major stress or mispricing regimes.

What makes this even more interesting is where we are in the cycle. Solid waste sits in the boring but essential corner of industrials. Volume linked, contract based, pricing power driven, and structurally tied to population growth, construction, and municipal spending. These are not businesses where earnings collapse without a deep recession. Yet the market has priced them as if structural demand is at risk, creating a valuation gap that looks disconnected from fundamentals.
Usually, when industrial sub sectors trade at material free cash flow discounts to the S&P 500, one of 2 things happens. Either the broader equity market de rates sharply, which usually requires a credit or labour shock, or capital rotates back into undervalued industrials as earnings prove resilient and cash generation remains intact.
So far, credit spreads are tight, labour is holding up, and capex linked demand is stabilising. That makes the second outcome far more likely. In that context, this valuation gap isn’t a warning, it’s fuel. It gives industrial equities room to outperform without needing heroic growth assumptions.
This also helps explain why industrials can lead even when sentiment is cautious. Attractive free cash flow yields invite buybacks, M&A, and private equity interest. That capital support matters, especially in a market increasingly focused on earnings quality rather than just top line growth.
Against an equal weighted S&P 500, the free cash flow premium in solid waste has compressed to its tightest level in more than 4 years. Against other industrials, the premium has eroded to the smallest level in over a decade once you exclude the pandemic distortion. In other words, the sector is no longer being paid a meaningful quality premium for stability. It’s being priced much closer to the average stock in the market and to its own peers.

That matters because solid waste is usually one of the last places where valuation premia disappear. When they do, it typically reflects crowded pessimism.. Cash generation hasn’t suddenly become cyclical. Contracts haven’t vanished. Pricing power hasn’t rolled over. Yet the valuation buffer that historically protected the sector has been stripped away.
Within a broader industrials led rally, this creates latent upside rather than confirming risk. Mean reversion here doesn’t require a booming growth rebound. It only requires earnings to stay boringly resilient, which is exactly what this part of the sector tends to deliver.
That valuation story becomes even more telling when you change the benchmark.
Now on bankruptcies. These charts look scary at first glance, but they are not a contradiction to industrial strength.
Industrials accounting for a large share of bankruptcies tells you where the tightening cycle hit first. Industrials are capital intensive, rate sensitive, and exposed early to inventory corrections, capex pauses, and refinancing stress. When financial conditions tighten, stress shows up here first, before it hits consumption, labour, or services. By the time bankruptcies are elevated, the damage is being absorbed.

More importantly, bankruptcies are micro failures rather than macro collapses. The companies filing are overwhelmingly smaller, over levered, poorly positioned operators. Not the balance sheet strong incumbents that dominate equity indices. Equity markets don’t price the survival of the weakest firms. When weaker players exit, capacity is rationalised, pricing pressure eases, and order flow concentrates among the strongest balance sheets. That is bullish for listed industrial equities even as headline failure counts rise.

Look at both 2024 and 2025 bankruptcies, all while industrials rallied… so don’t let doomers convince you that these factors mean industrials are cooked, because in EVERY sector you can find negatives (trust me). There’s also a timing mismatch that trips people up. Bankruptcy data is lagging. It reflects financing decisions made years ago under zero rate assumptions, not today’s marginal demand conditions. Equities discount forward earnings, forward orders, and forward margins.
That’s why you can see high bankruptcies alongside improving new order expectations, stabilising margins, and rising equity prices. One is backward looking stress resolution. The other is forward looking normalisation.
The sector breakdown reinforces this. Consumer discretionary, healthcare, and industrials dominate filings because these sectors carry operating leverage and debt structures that are most sensitive to rate shocks. As rates stabilise and financial conditions stop tightening, incremental stress slows and markets shift from fearing defaults to pricing survivorship and operating leverage.
From a broader equity perspective, elevated industrial bankruptcies do not signal systemic risk. Credit spreads remain contained, funding markets are functioning, and there’s no forced deleveraging across the corporate complex. Usually equities only struggle when bankruptcies spill into credit contagion and labour deterioration. That transmission literally isn’t happening.
What industrial equities are responding to now is cleaner balance sheets, improving forward demand expectations, and the asymmetric upside that emerges once excess leverage has been flushed out.
See you in the next one!