
Equities: The Current Setup
The Transmission of Inflation, Growth, and Rates Into Equities

Hey guys,
As the year comes to a close there’s naturally less to focus on, this is the time where you build on yourself. A lot happened this year, it’s a great time to reflect on which fruitful oppurtunities played out and why exactly you weren’t positioned. I look forward to providing more value next year as I continue to build out strategies to help me match each part of the economy through rates, FX & equities!
Let’s get into the setup in equities. First, I want to focus on the shifts in the curve for 2026. The key thing I’m watching is that the terminal rate is being pulled closer in time, moving from the H7 contract to Z6. As rates shift from further out contracts into nearer ones, the focus tightens around the 2026 contracts. You can see this clearly in the shaded green regions below. Cuts that were priced into December are being dragged forward into earlier contracts, specifically January-March.
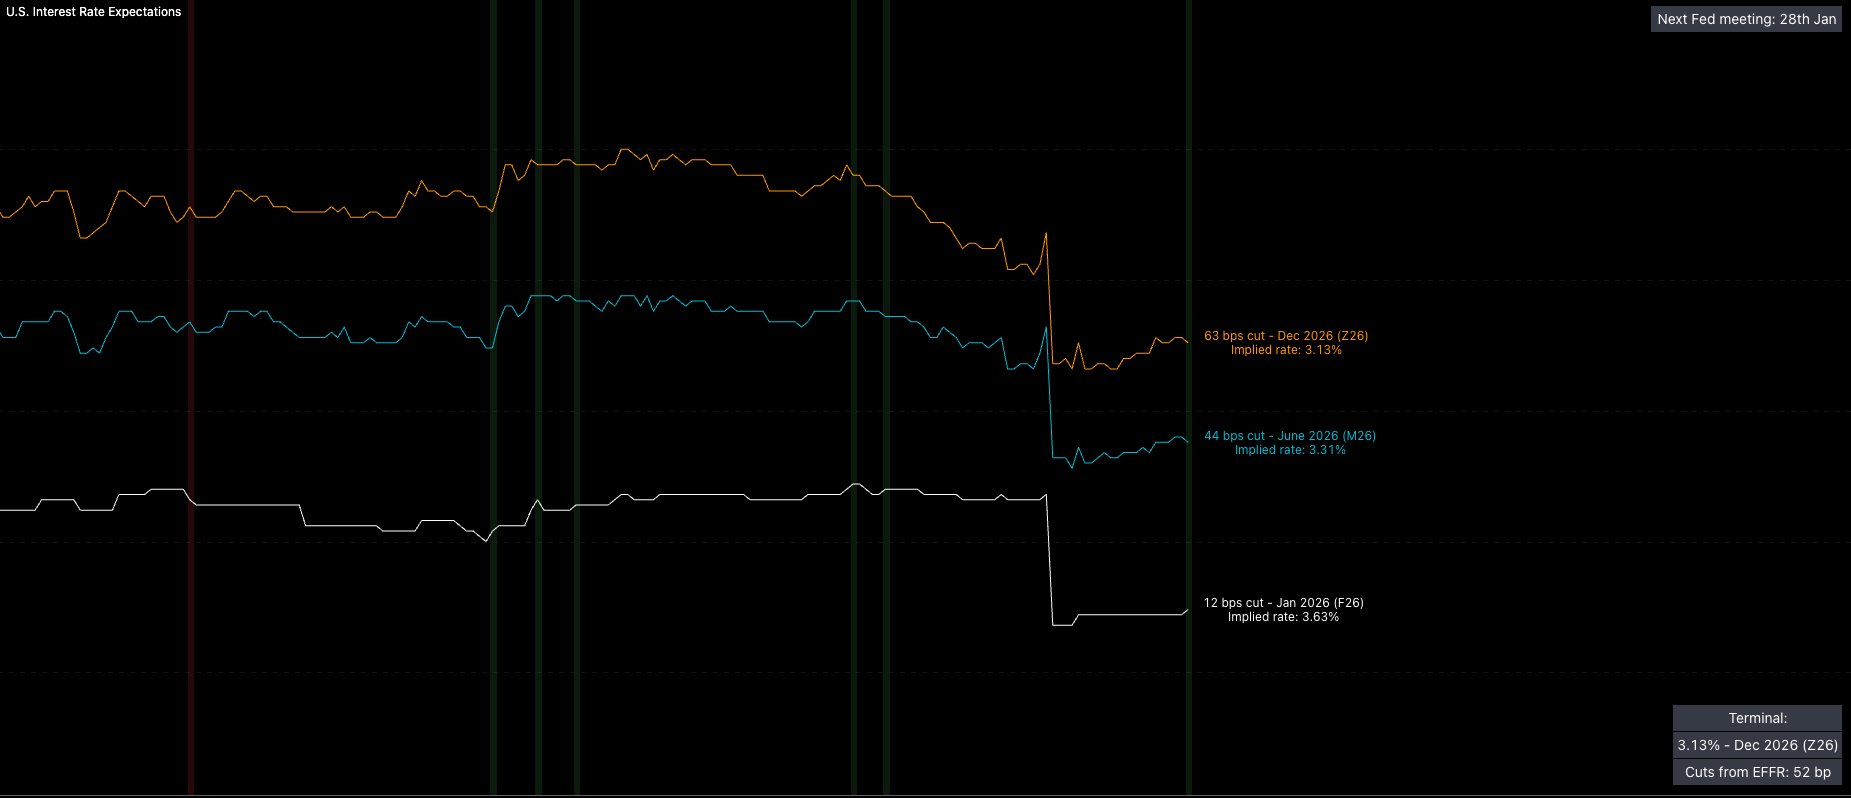
This matters a lot because the speed and aggressiveness of policy is the driver of how liquidity is transmitted in or out of markets. In a prolonged cutting cycle (where easing is stretched out over time) liquidity filters into the economy much slower. When that happens markets tend to move less and equities grind higher rather rally like we’ve seen this year.
But when policy is faster and more aggressive, liquidity is pushed into the economy quickly and the transmission is more powerful. Liquidity flows straight into equities and risk assets more broadly, you will usually see a sector rotation where capital shifts from utilitied all the way down to tech & industrials. That change in timing alone can materially shift how markets behave espeically if it isn’t priced, even if the total amount of easing ends up being similar (the amount of cuts alone isn’t enough, focus on speed). Basically, how many cuts to the terminal rate + how many meetings until then, that gives you the speed and aggressiveness.
There’s 62bp of cuts priced for 2026, so we are stuck between 2-3 cuts for next year.
The reason we’ve seen this shift is pretty clear. 5y and 10y breakevens have fallen roughly 30bp since last August. Inflation pressure was the key tail risk to Fed cuts. Until the end of July, inflation swaps were trading higher with solid momentum off the April lows, and that consistently made it harder for the Fed to ease, especially with growth metrics staying resilient (I’ll touch on that later in the report). What we were seeing from April through July was a clear pushback in rates. Cuts that had been priced into Z5 were getting shoved out into Z6 and even Z7.
So naturally as inflation swaps and breakevens have unwound, it makes sense that rate cuts have been pulled back toward the front end. The inflation pressure eased, and the market responded by bringing easing closer in time. That said, the inflation dynamic itself is still a tail risk in my view. Even now, the market isn’t actually pricing the Fed to fully reach its 2% inflation target. So while inflation has stepped back enough to allow cuts to move forward, it hasn’t disappeared, and that lingering uncertainty still matters…. a lot.
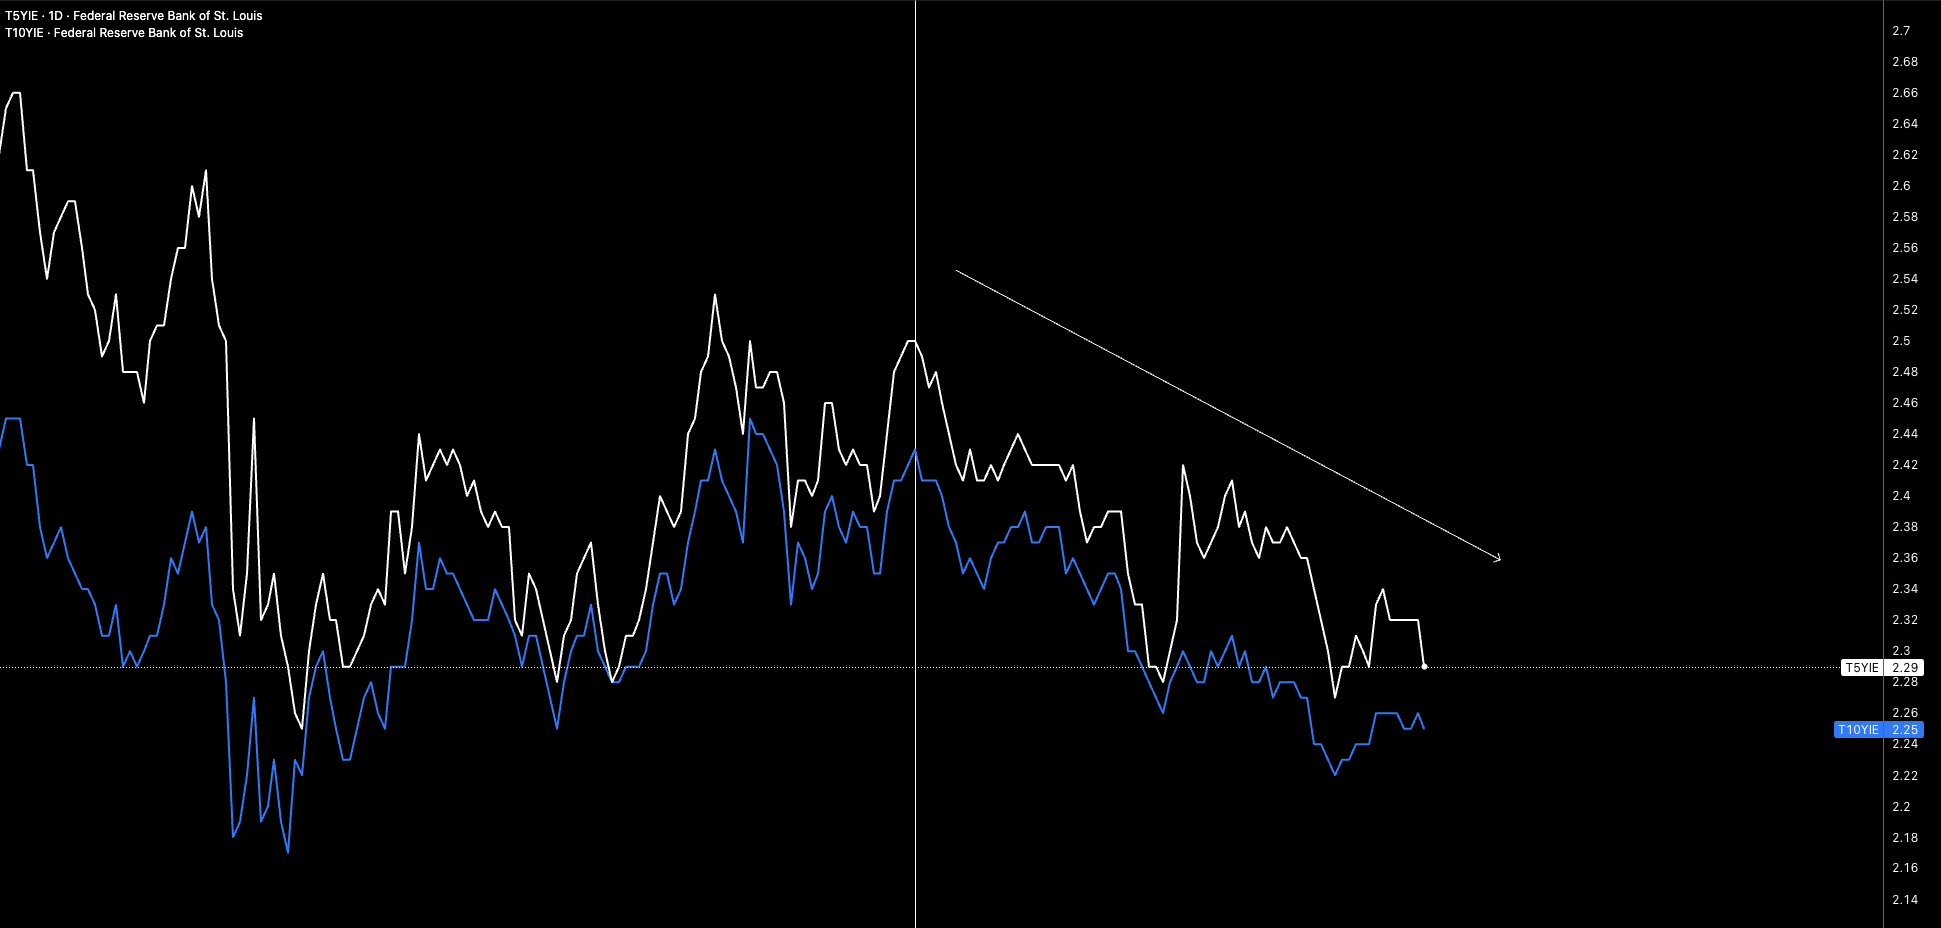
I think we’ve reached a zone in inflation swaps where downside pressure is going to be muted. At these levels, I expect more of a range. I don’t see meaningful forces in the economy right now that would drive a large downside move in inflation. If anything the risks lean the other way.
This is where policy credibility starts to get questioned as I’ve mentioned in previous months. As Trump builds out his Fed team (which he is already doing), monetary policy becomes fiscally dominated if it isn’t already. That setup emphasises larger moves in rates, curves steepen, and the 2% inflation target will turn into something closer to 2.5-3%. I don’t really care how that looks on paper. What I care about is how it transmits into equities, FX, and rates.
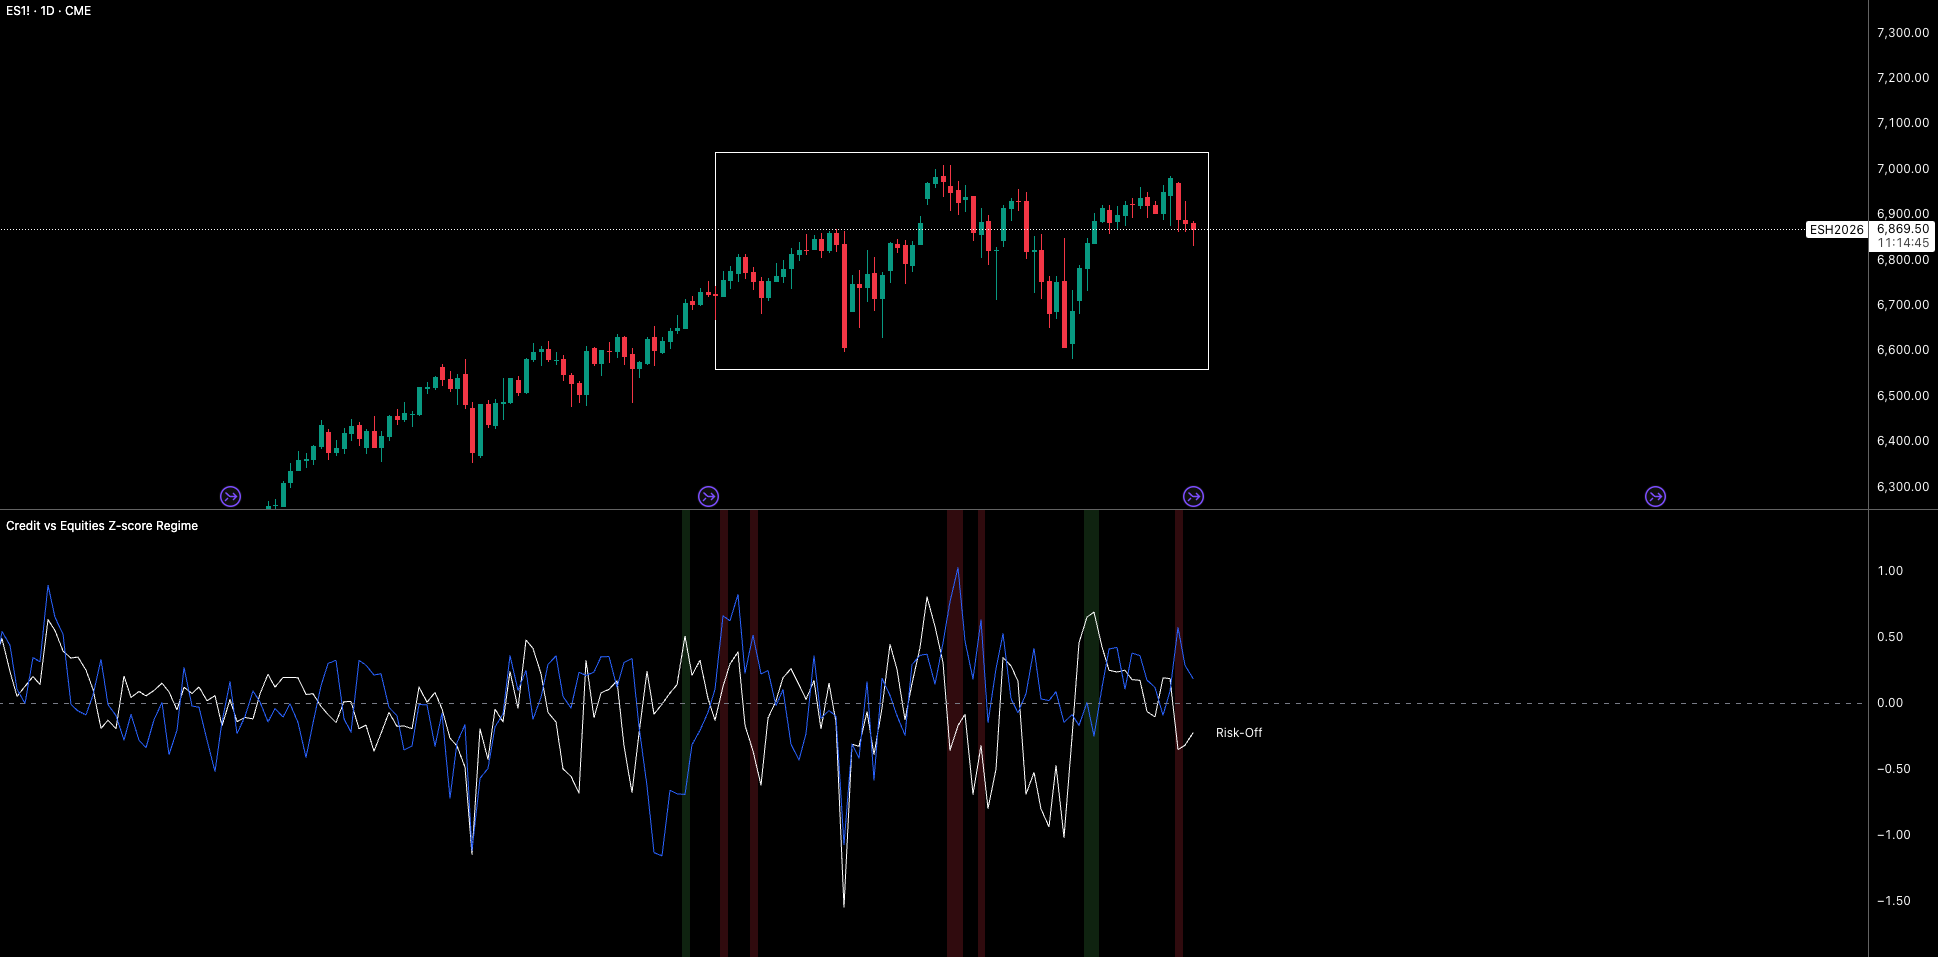
As long as inflation swaps are pushing lower, cuts will continue to be pulled into closer contracts, and the market will keep repricing that path. The obvious question is why ES hasn’t ripped higher as rate cuts have been brought forward. The answer is that the picture is much bigger than rates alone. This is the mistake people make when they sit on Fed watch and only focus on how the curve is priced. Other dynamics are shifting at the same time.
What I’m focused on is the fact that credit has been outperforming ES on a Z score basis. We’re seeing growing divergence between credit and equities Z scores, highlighted in the red shaded regions. So when upside pressure from rates being pulled forward is met with downside pressure from rising credit volatility relative to equities, the net effect is basically zero. That’s one reason why ES has stalled heading into year end (of course not the only reason). There are more dynamics at play, but these are the key drivers I’m watching right now.
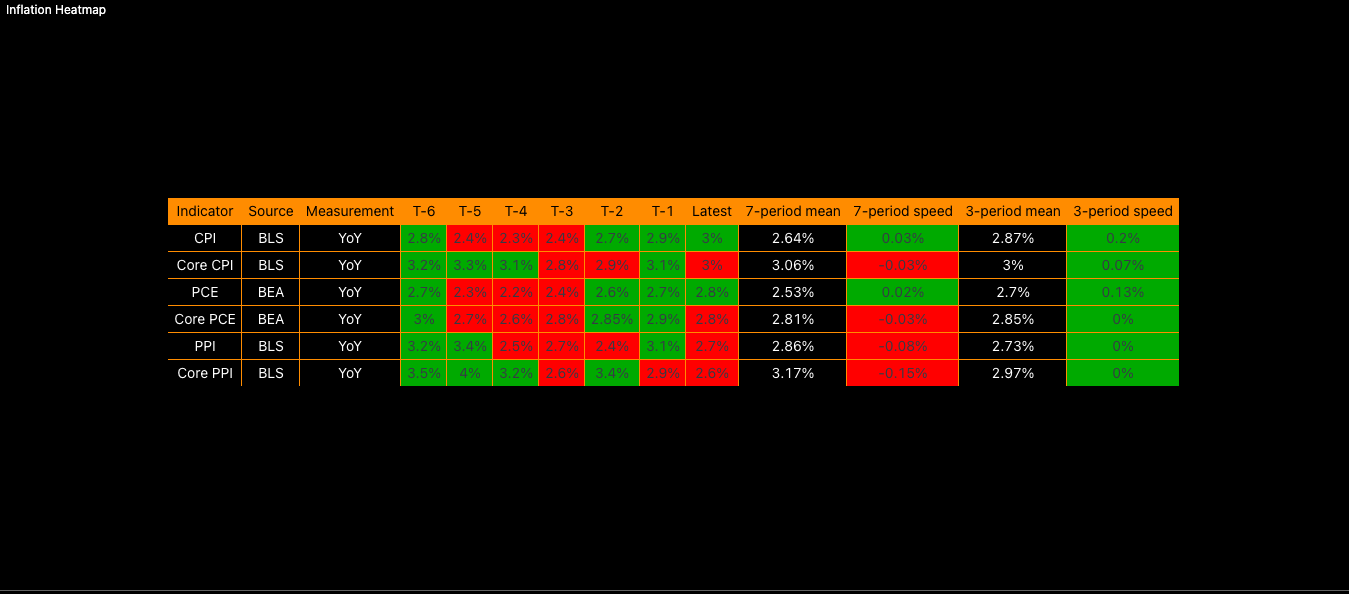
Still sticking with inflation, what I’m more focused on now is how these dynamics filter into the long end, particularly through steepening in 2s10s (we’ve seen steepening across the last few weeks). The last thing you want to do is mistake falling inflation swaps for no inflationary pressure at all. Over the last 3 months, inflation metrics have been running at an average pace of 0-0.2% while the curve continues to price cuts into closer contracts. Zooming out, the 7 month avg speed looks healthier, with most inflation metrics clearly decelerating in terms of speed which is the constructive part of the picture.
The tail risk is that if the next 2-3 inflation prints come in neutral or positive, meaning inflation stays flat or even ticks higher, and at the same time the rate expectations curve stops shifting, that’s when things can move quickly. In that setup, 2s10s can rally hard, which is exactly what we’ve already been seeing since early November. So yes, inflation is cooling, but the long end is still sensitive. A few sideways or hotter prints, combined with a stalled front end is enough to reprice the curve aggressively.
Even if inflation does start to trade higher again, credit spreads and real rates still need to continue moving lower (or at least stay low) to generate upside in equities. You can’t look at data in isolation…. For example, if real rates are falling but the rest of the economy is cooked, you can’t expect ES to rally just because real rates are down.
We also have to consider a scenario where inflationary pressure actually becomes a headwind for equities. We haven’t really seen that yet, largely because growth has been strong. But it doesn’t take much for that to change. That’s why I’m closely monitoring how moves in inflation swaps start to transmit into ES. On the equity side, sector performance has been signaling since May that we’ve been operating in a risk on environment. But over the last 60 trading days we’re starting to see a shift. This isn’t a setup where I think rotation alone causes equities to sell off 20% but it does point to some upside fatigue.
Looking at the last 3 months, healthcare has been leading sectors, while tech has slipped to the middle of the table after being a consistent outperformer for most of the year. Materials have also been sliding down the rankings. That tells me risk appetite is cooling at the margin, not collapsing.
At the same time, the picture isn’t overly pessimistic. As I highlighted in the green box, industrials, consumer discretionary, and financials are still trending higher. That’s also constructive for risk. I’m watching this closely as we move into 2026. A meaningful rollover in industrials and consumer discretionary in particular would be a much clearer signal that market risk appetite is shifting in a more material way.
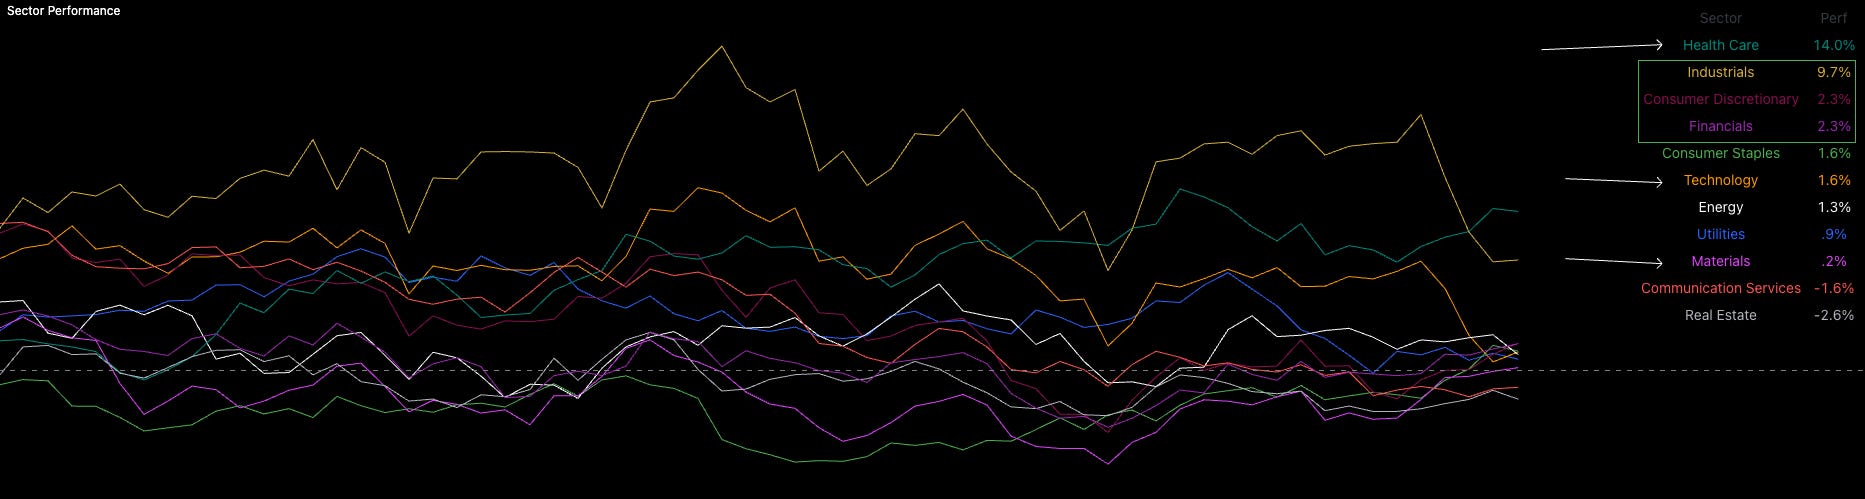
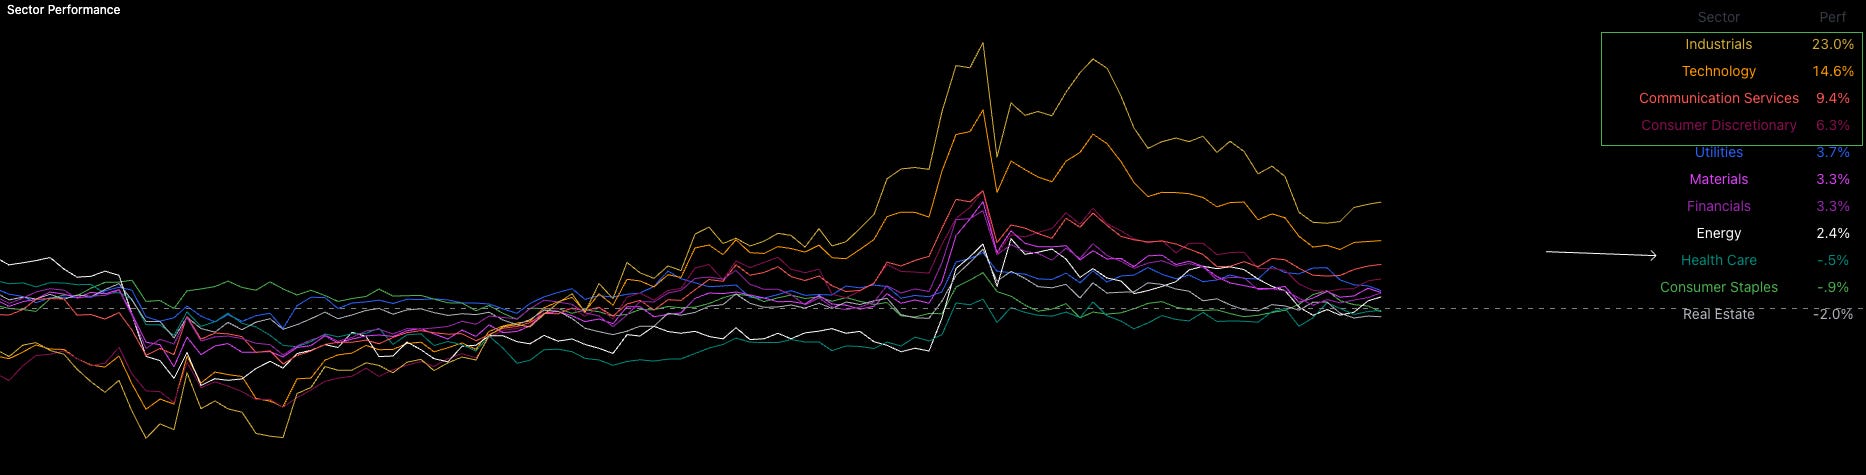
Just compare the chart above with how sectors traded through August:
So the tail risks to equities right now are really being transmitted through inflation and sector rotation even though the rates curve itself remains accommodative with the terminal rate still sitting around 3.1%. A lot of the rates action over the last 4 months has been driven by labor data (in my view).
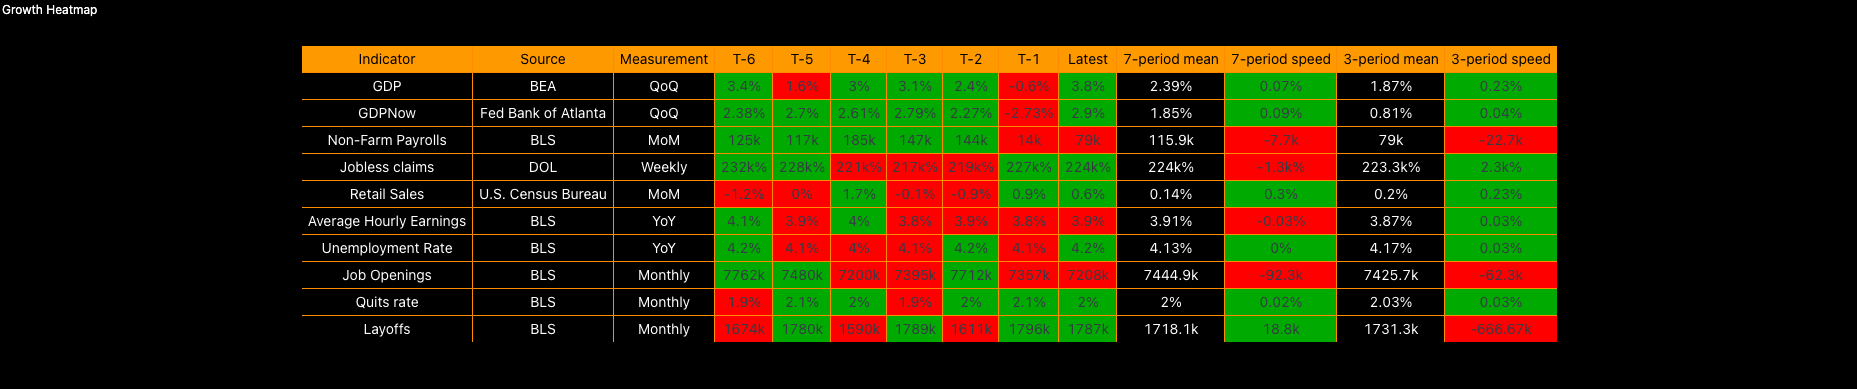
Growth more broadly is very strong. Real GDP and GDPNow forecasts continue to look solid. But I think the Fed has been overly focused on labor. Yes, NFP has ticked down over the last couple of months but that’s exactly what you’d expect after holding rates at 5.5% for an extended period. I understand why Powell is behaving this way. He would clearly rather be overly cautious and avoid pushing the economy into a recession even if that means tolerating higher inflation. But the reality is we’re nowhere near recessionary conditions.
Every recession is triggered by something different, which makes backward looking signal hunting difficult. That said, if you were seriously looking for a recession you’d need to see a very different combination of data. Growth components would need to turn negative. You’d want to see NFP prints negative for at least a quarter, layoffs surge, quits rate collapse, consumer spending get crushed, credit spreads trade at meaningfully higher median levels, and jobless claims rocket.
We’re not even close to that setup. In fact, just look at how many growth metrics in the table below are still ticking higher on a 3 period basis in terms of average speed. That’s not what an economy rolling into recession looks like.
We’re still seeing the Russell outperform the S&P although not to the extremes we saw from July through September. A full risk rotation hasn’t occurred yet. There are some orange warning signs but nothing that says we should all be aggressively shorting ES on leverage.
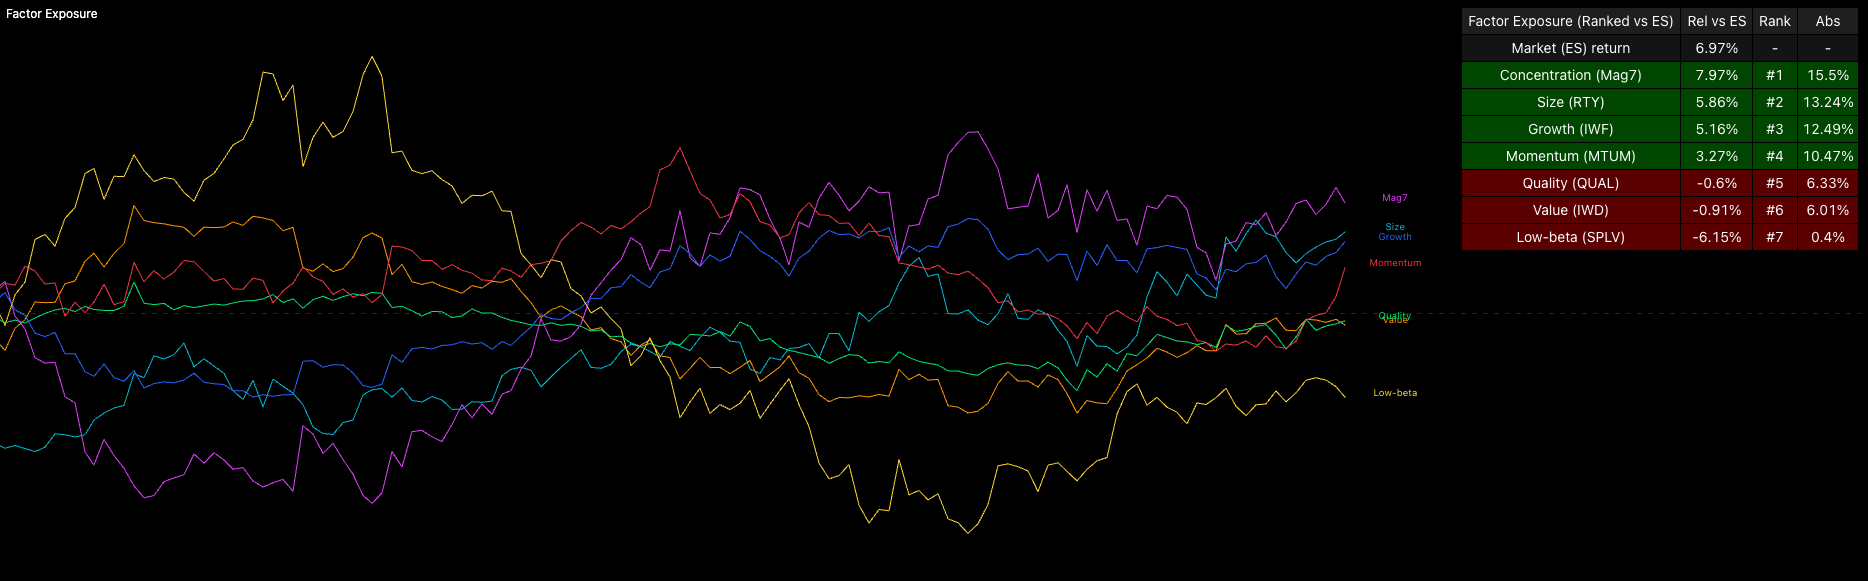
While we’re on the topic of orange signals, I’d put this next part in the same bucket as sector rotation. It’s showing early signs but not a full blown shift. That signal is factor exposure. Factor exposure matters a lot for portfolios because at the end of the day, it’s attribution analysis. Over the last 3 months, growth and momentum have become less important drivers of equity upside. Instead, value and quality have been persistent contributors.
That’s not a risk off signal yet but it’s more of a “I’m holding less risk” signal in my opinion. Positioning is getting a bit more selective and that lines up with everything else we’re seeing across sectors and rates right now.
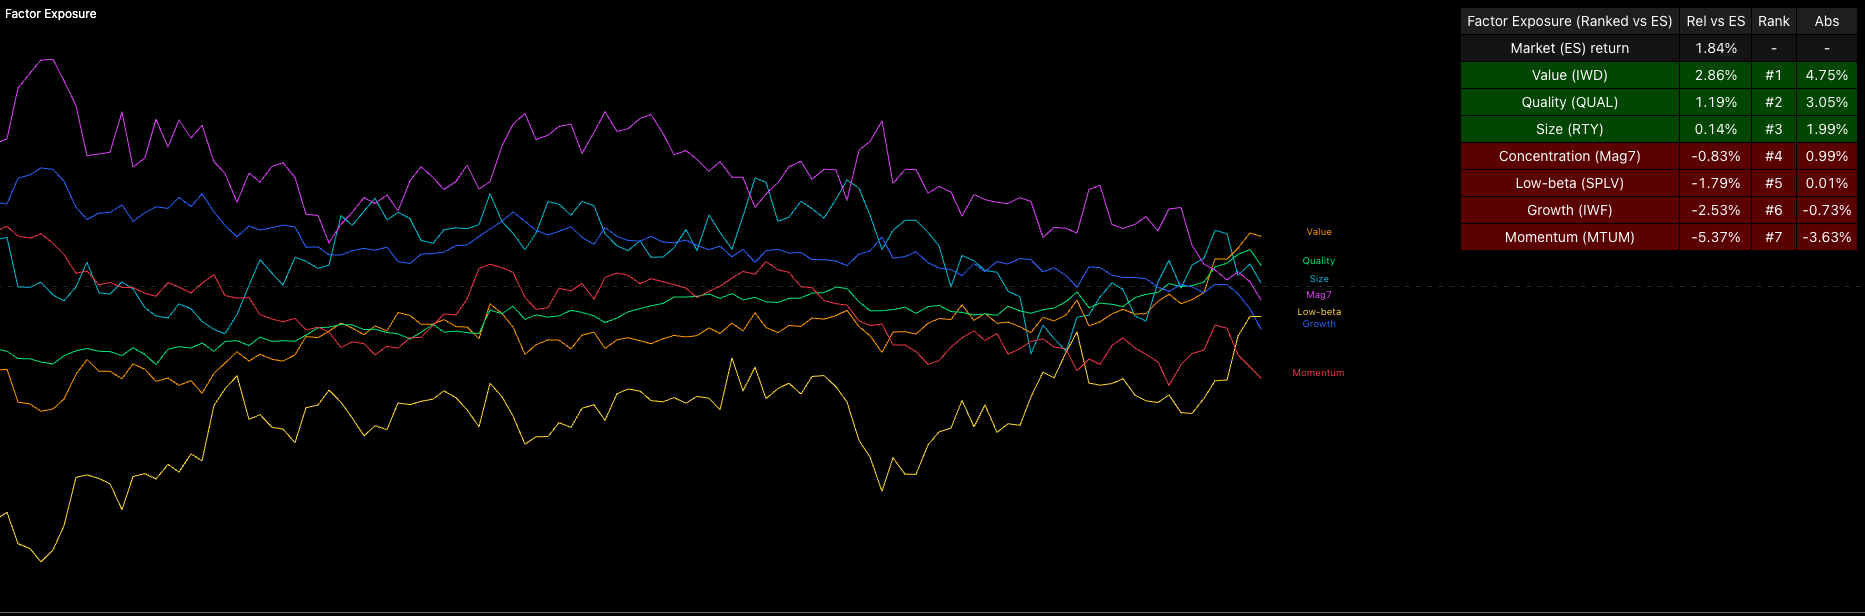
Now look below at how we were trading heading into September. Small caps (size), growth, and momentum were all driving markets at the same time. Those are classic risk on signals for equities.
When size, growth, and momentum are leading together it tells you traders are leaning into risk, chasing upside and getting comfortable with volatility. That was the environment through late summer. What we’re seeing now is a clear contrast to that setup and it helps explain why upside has started to feel more restrained.
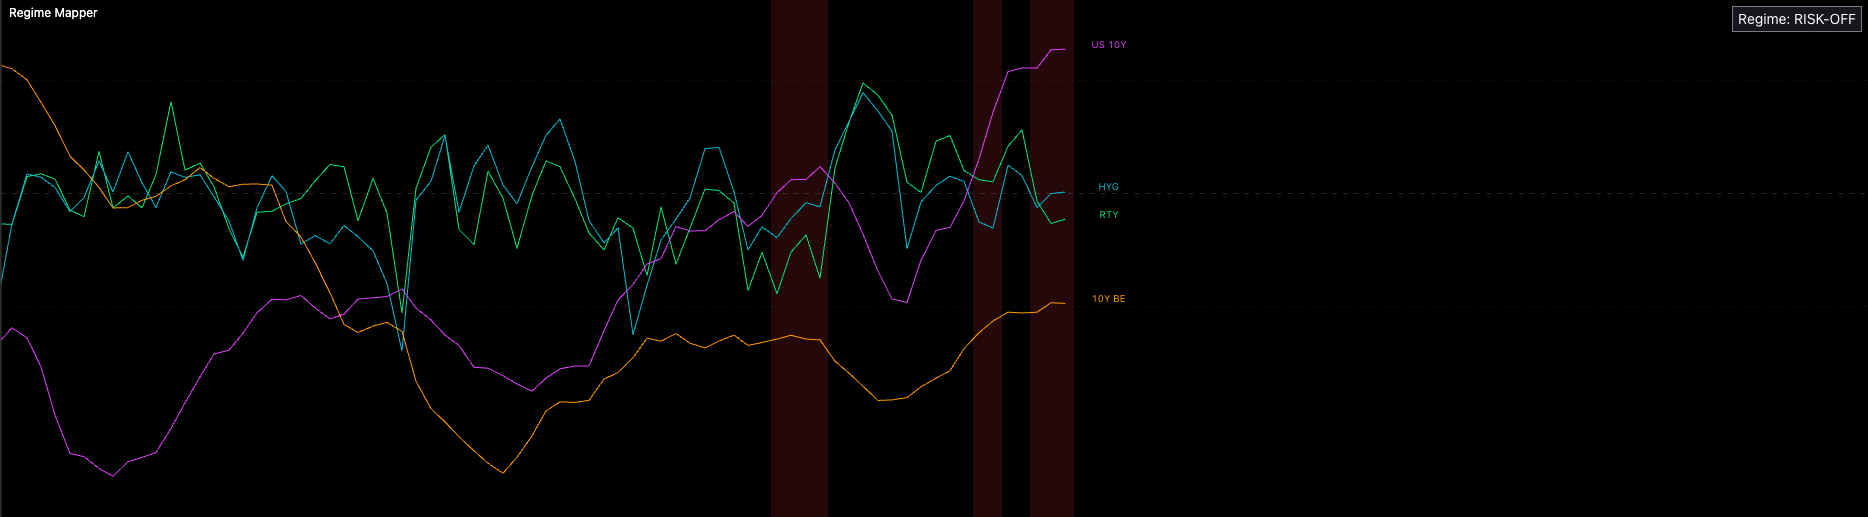
Also look at one of my regime models below, you can see how the 10y Z score has blown out higher and is now starting to act as a drag on equities, specifically the Russell. At the same time breakevens on a Z score basis are also ticking higher.
This combination matters because higher long end rate volatility alongside rising breakevens shifts the environment away from the clean risk on setup we had earlier in the year. It doesn’t mean equities have to roll over aggressively but it does mean the tailwind from rates is fading, particularly for small caps which are more sensitive to both real rates and inflation expectations.
This lines up with everything else we’ve been seeing. Risk is just getting more expensive with less edge and that’s showing up first in the areas of the market that benefitted most when rates were moving the other way.
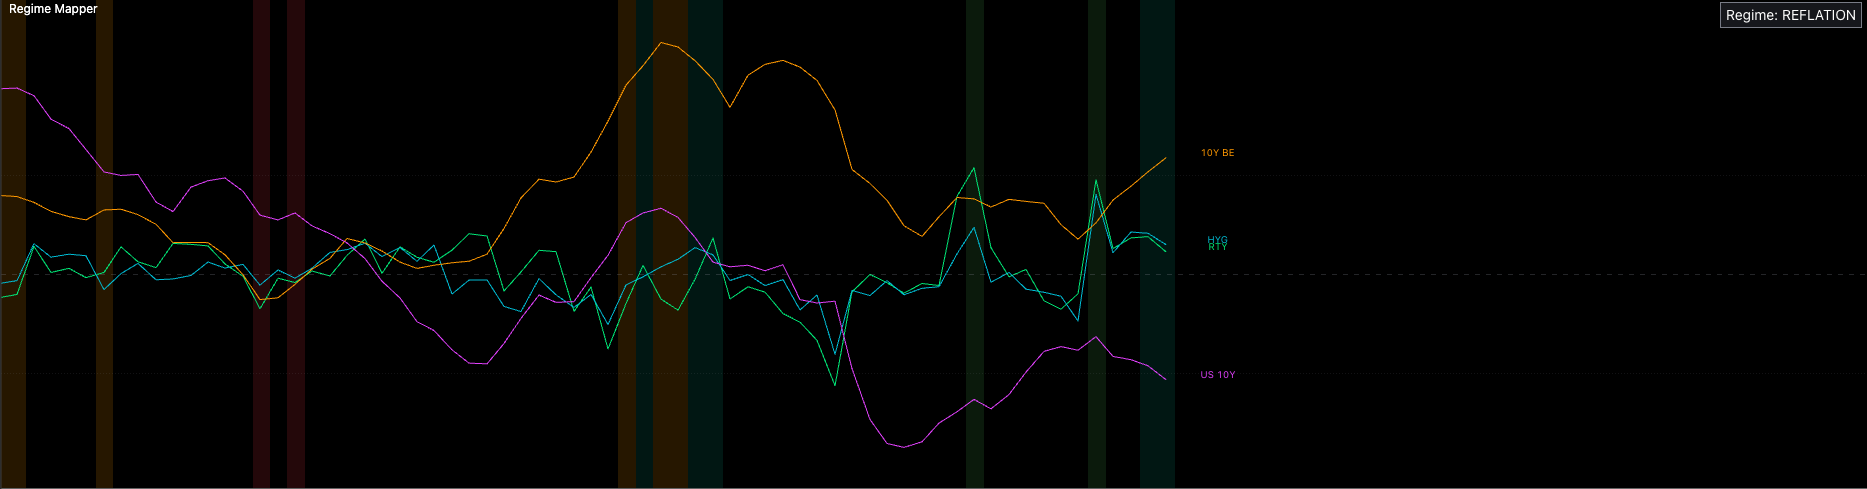
Take a look at the chart below, back in September the setup was much cleaner. Breakevens on a Z score basis were leading higher while the 10y Z score was dropping with real speed. At the same time, credit spreads were compressing toward cycle lows and the Russell was ripping higher.
That combination was more risk on. Falling long end rates, improving inflation expectations, tighter credit, and small caps outperforming all at once. Compared to that backdrop, today’s environment is more mixed which helps explain why markets feel heavier even though we’re not seeing outright risk off conditions.
So where does this leave us? In my view it puts us in a mixed signal regime. The edge in being long is diminishing but there’s even smaller edge in being outright short. That’s not a good place to trade.
My take is that inflation is heading higher alongside growth. In that environment, I think 2s10s and especially 2s30s have room to blow out higher. My concern is that inflation and pressure from the long end eventually start to weigh on equities and create downside into Q2 next year.
For now I still expect upside pressure to persist through the first 2 months of 2026. After that things start to get cloudy and it becomes much harder to hold a strong directional bias. As always I’m not forcing a view, just playing the data I’m given.
Have a good one guys!
This one mustt have read every single substack post form capitalflow
Good work
Very well put Alf!