
2026 Outlook: Curve Regimes, Real Rates & Equities
Mapping real rates, yield curve regimes, and equity outcomes into 2026

I hope you had a great Christmas, enjoyed time with family and friends, and set some meaningful goals for 2026. And of course, pray on them.
Before we get into the actual macro views, a bit of housekeeping. From this year onward I’ll be running an active macro trade tracker (it will be a spreadsheet in the reports), so you can follow longer-dated macro positions alongside the reports that explain why they exist. This should make it far easier to keep track of trades that live for months. What I won’t be doing is sharing tactical intraday or intraweek positioning. Partly because it’s impossible to distribute in real time without destroying the risk-reward, but more importantly because I don’t want this to turn into a noisy signals page. The focus remains the same: structural regimes, big macro forces, and trades that make sense across time.
Now, onto the actual reason you’re here. This report is less about trade ideas, but instead a focus more on where I think we are structurally heading into 2026. The real value is not in trade ideas but in understanding the structural forces that bleed into everything else… equities, gold, small caps, FX, credit. The three anchors I care most about going into 2026 are: the Fed funds curve, real rates, and yield curves. But don’t worry, I will touch on the S&P500 at the end!
Having strong structural confidence 12 months out is brutally hard. There are hundreds of possible data paths that could derail any thesis within a couple of months. You might believe real rates grind higher, until an energy shock hits and inflation explodes. You might believe inflation fades, until geopolitics reminds you it exists. That’s why this report isn’t just about where I think we’re going, but where these views break. A bias without falsifiers is just useless. What matters is how long a regime can last and what kills it.
Real rates & the Fed funds curve
If 2025 had a single dominant macro driver, it was real rates. Almost every meaningful shift in liquidity flowed through them. When real rates pushed higher, ES struggled and even gold came under pressure. When real rates fell, liquidity spilled into equities, gold, tech, and anything with beta. That relationship has been strikingly consistent.
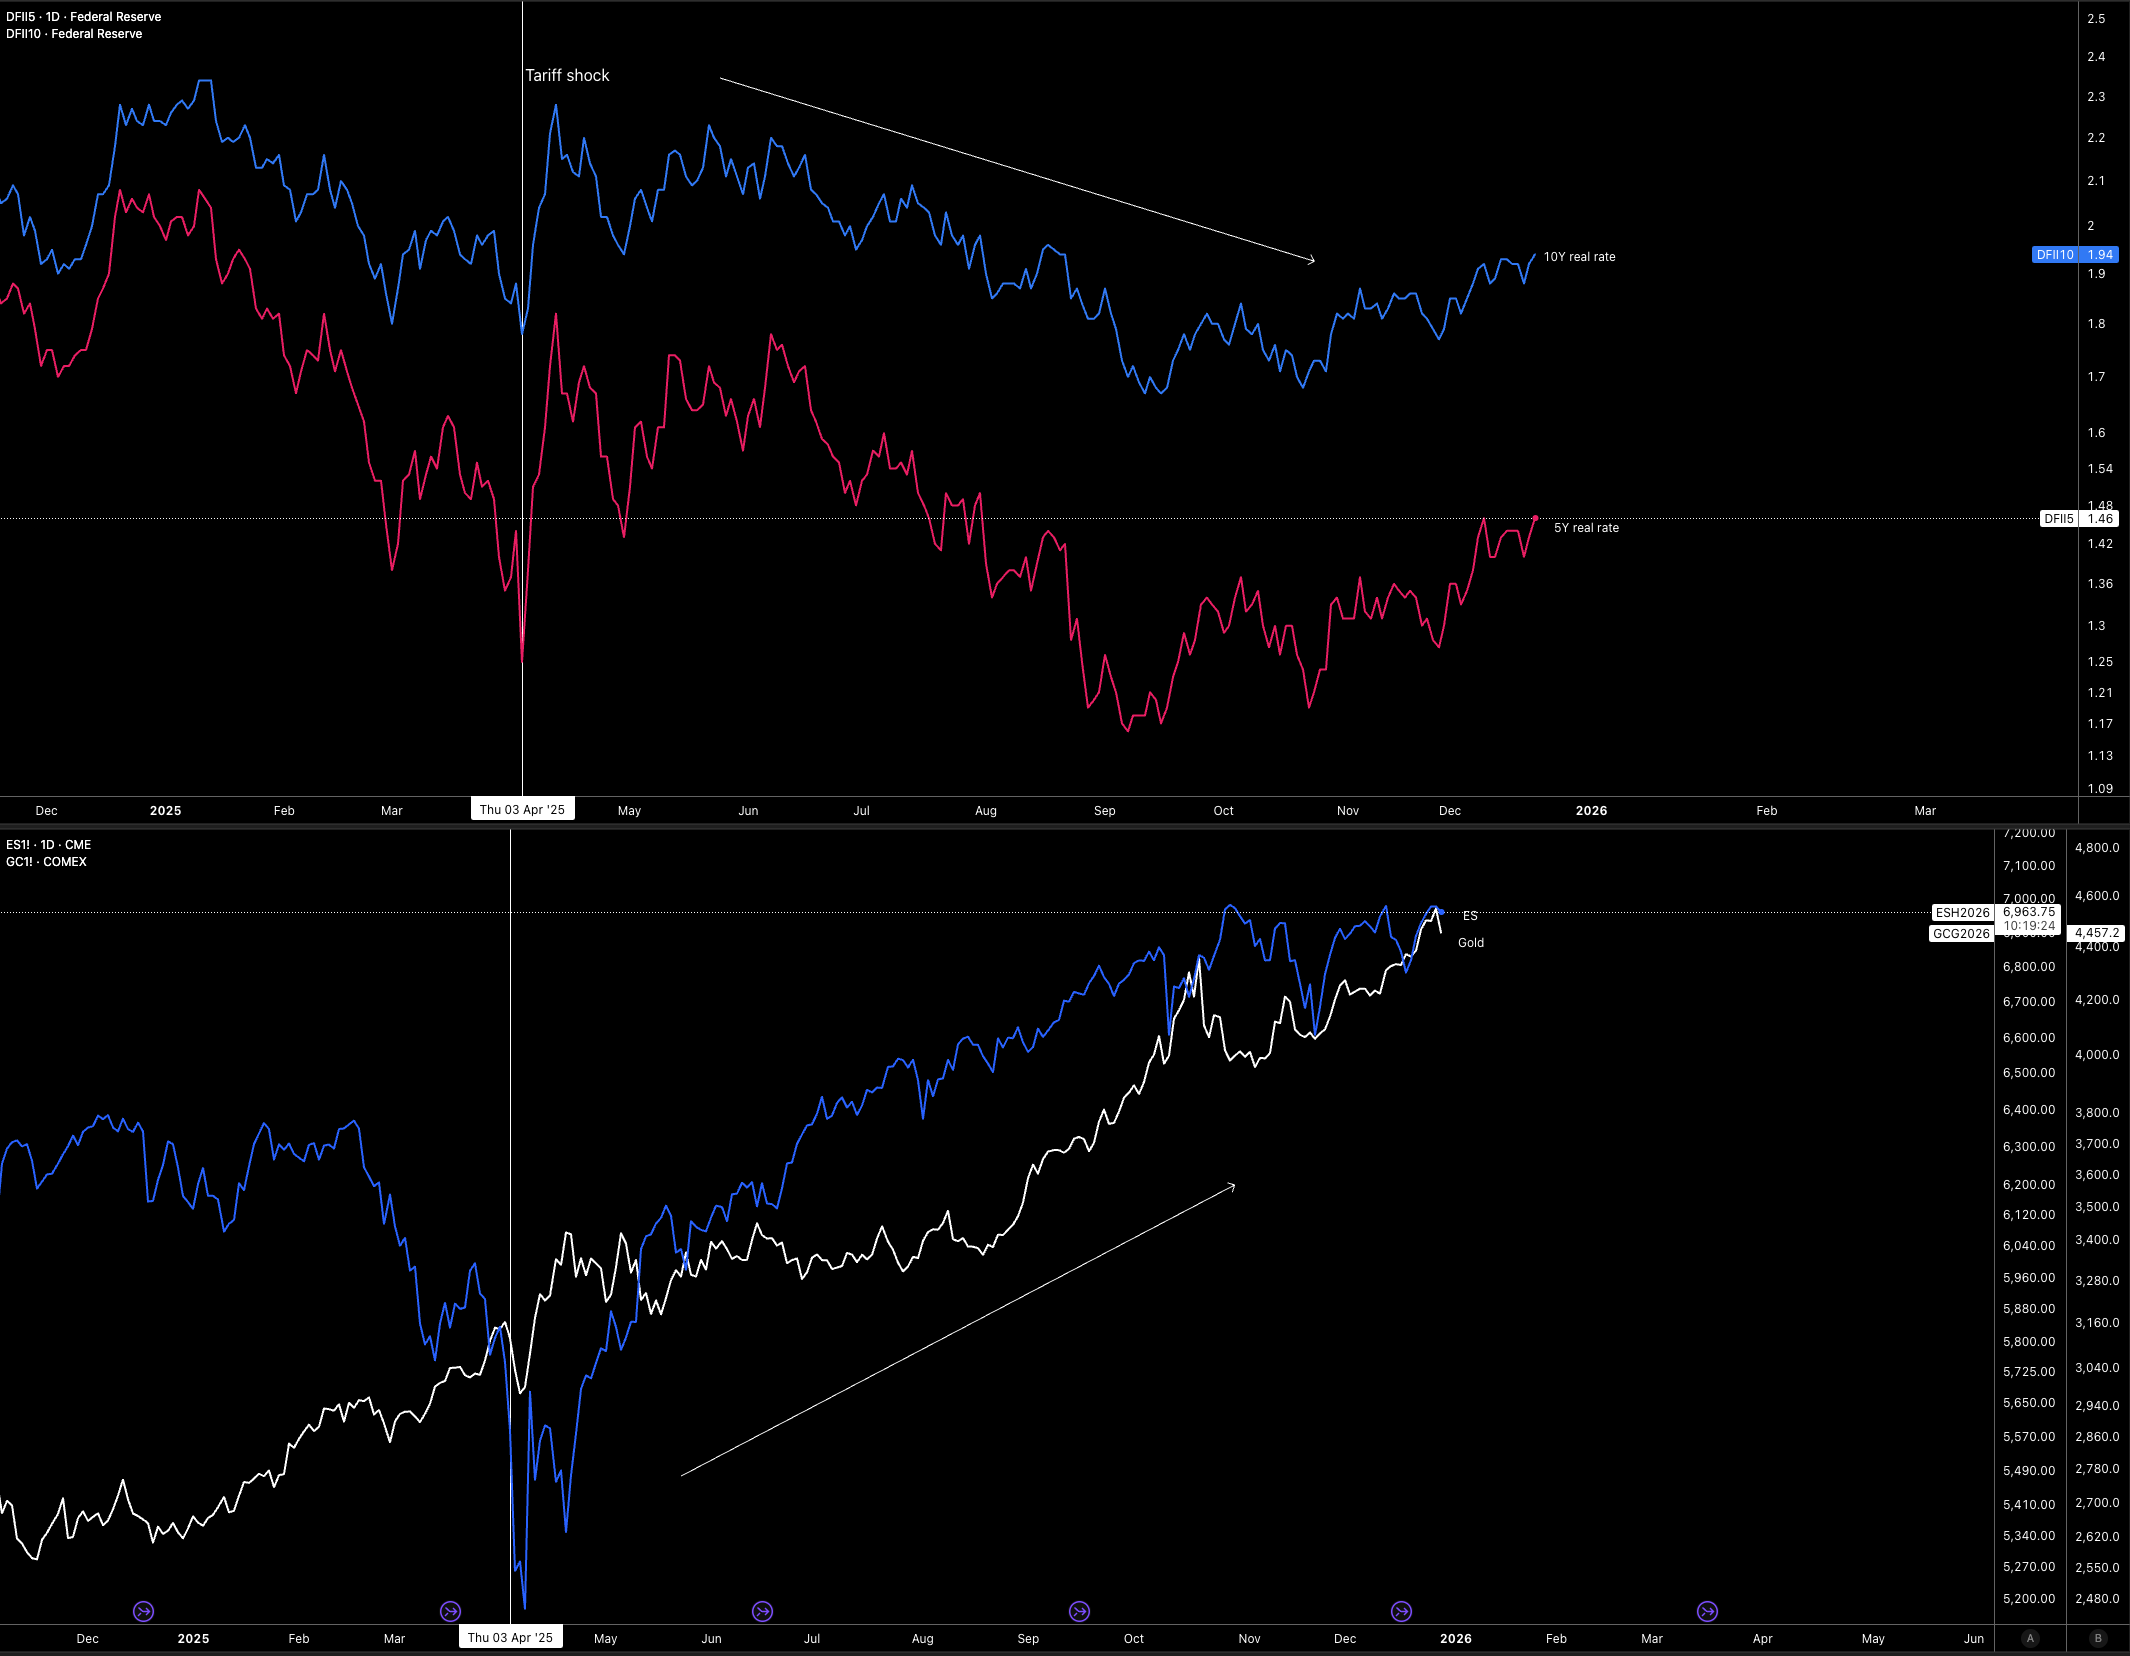
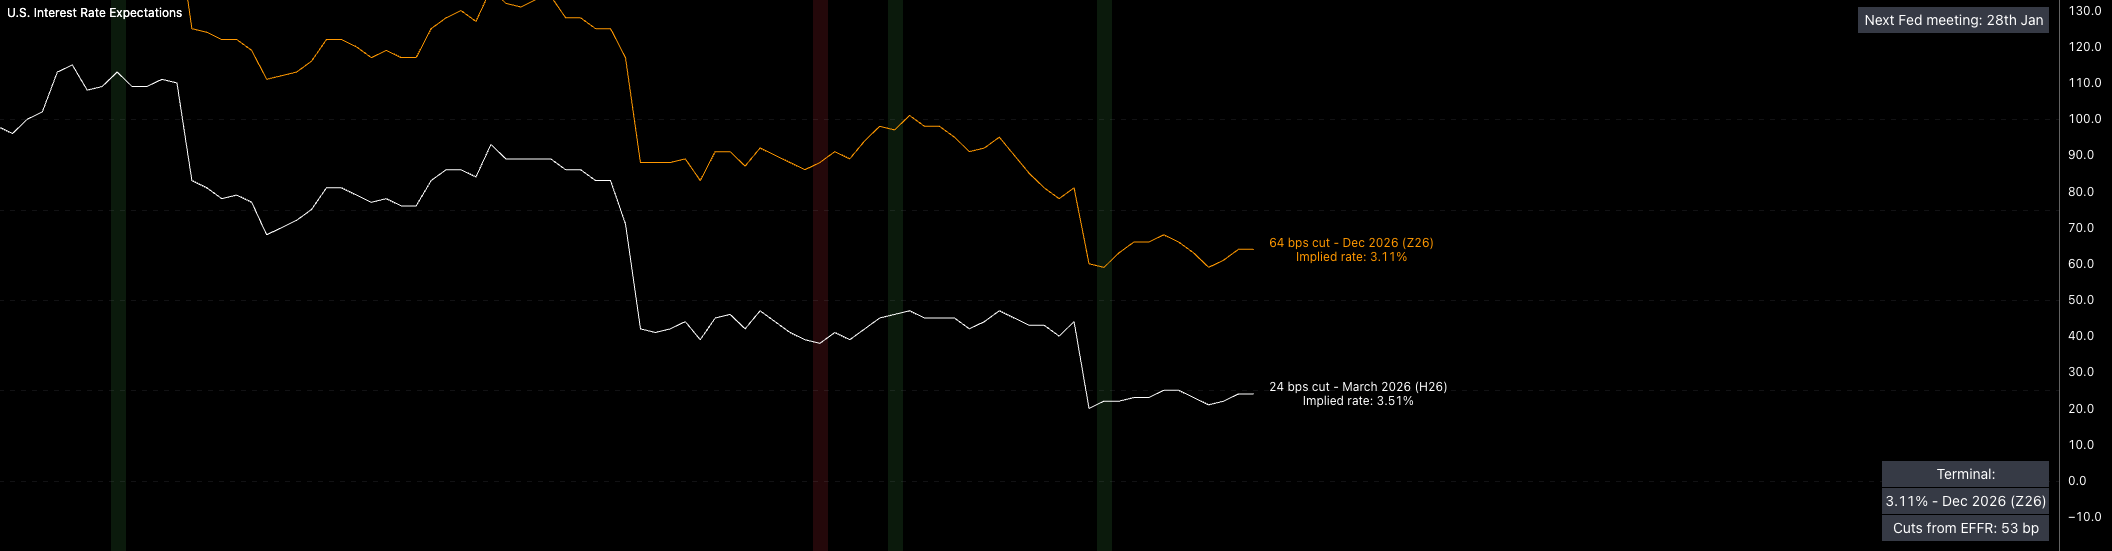
My base case for real rates in 2026 is a trend lower, driven by inflation that stays sticky (from exceptional growth) while the Fed remains unreactive to higher inflation (I’m basing this on how they reacted through 2025 when inflation swaps and inflation metrics ticked higher while more cuts were being priced). The market already looks close to peak accommodation, with roughly 3 cuts priced, and I see that as the upper bound for 2026. In reality, I expect closer to 2 to actually be delivered if the inflation tail-risks are realised. Easing momentum has been pulled into the first half of the year rather than the second. If cuts begin to move back out to further contracts (September or December), then liquidity can contract fast (if real rates are directly impacted) and this will be something key to watch.
The consumer should remain supported, though far from euphoric, largely because the labour market is unlikely to crack in a meaningful way while rates sit at levels that don’t crush demand. Consumer spending held up well even as rates moved higher, with liquidity mitigating the impact. That resilience gives me confidence that a material break in the labour market remains unlikely.
Policy transmission remains slow, and in my view the Fed has already moved quickly to protect employment. The result is a widening of the inflation tolerance band toward something closer to 2.5-3% (as I laid out in my recent report), whether or not that’s ever said out loud.
Recent report:

The challenge for markets in 2026 emerges if inflation tail risks resurface after cuts are already priced or delivered. At that point, the Fed’s job becomes much harder. And the list of tail risks is long. Geopolitics hasn’t faded away… June alone was a reminder, with Israel targeting Iran in a strike. One escalation is enough to keep energy prices higher for longer.
Here’s the non-consensus piece most people overlook. The standard narrative says lower real rates mean more liquidity and more risk-taking. That misses a key layer. Liquidity only matters if there’s confidence and a willingness to deploy it. In 2026, we could see easier financial conditions, higher reserves, and lower money velocity at the same time. That’s a regime where asset inflation is uneven. If liquidity isn’t backed by confidence in growth, then crypto underperforms, small caps lag and the broad index rally will slow. Liquidity can expand but if it’s defensive, it means nothing for upside in equities.
Another real tail risk to “liquidity = risk-on” is a world where real rates fall because inflation swaps drift higher while growth plateaus. In this scenario, duration would trade higher, liquidity of course rises, yet equity multiples fail to expand cleanly… this is why liquidity doesn’t always equal risk-on. The early warning signs would be evident: inflation swaps drifting higher without excess growth expansion, tha't’s when you’d see gold and defensives outperforming ES, financial conditions would easing while earnings revisions stop improving… global macro doesn’t have equations where X always equals Y.
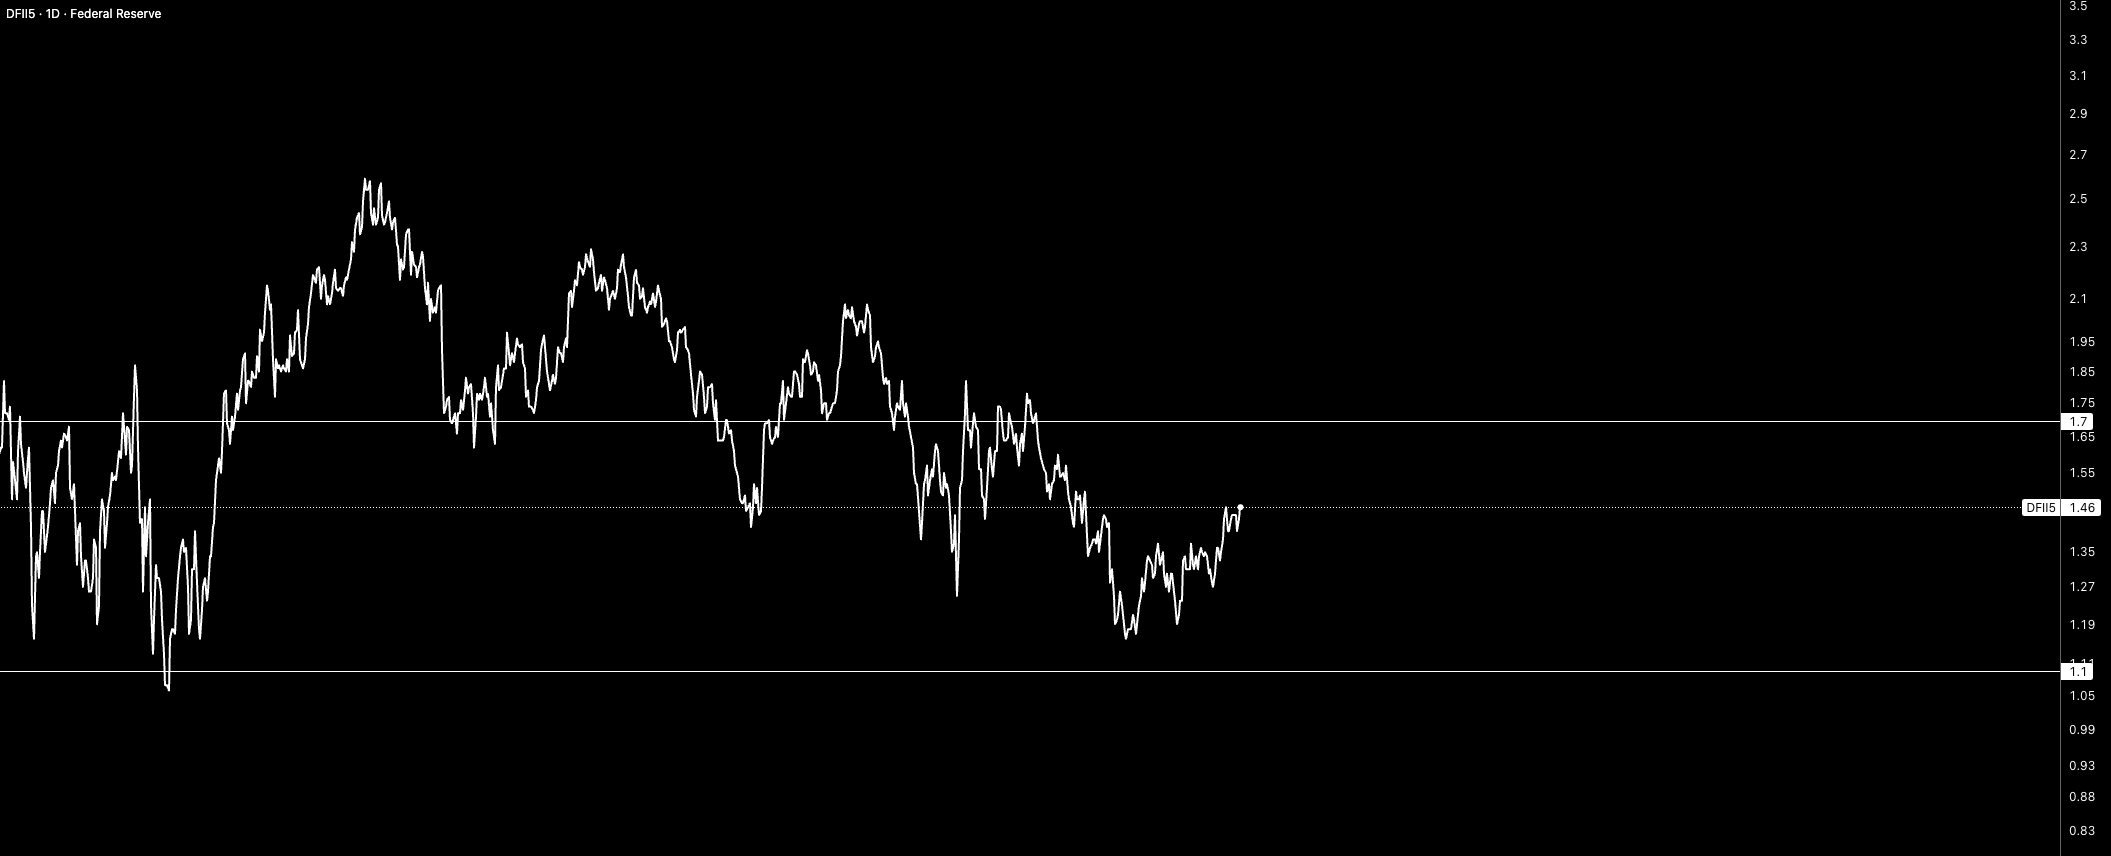
My rough framework puts a ceiling around 1.7% for the 5-year real rate, and even that would likely be brief, with a more plausible year-end outcome closer to (or below) 1.1%. Real rates remain the core transmission mechanism for liquidity. If you’re not updating those models continuously, you’re asking for trouble.
The primary falsifier for my view that real rates trend lower is continued downside pressure in inflation expectations. Specifically, if 5y breakevens remain below 2.05% and 10y breakevens below 2.10%, without a meaningful easing or re-steepening in the rates curve, then the real rate outlook breaks down. In that scenario, falling nominal yields would be driven by weaker growth rather than inflation persistence, implying real rates remain elevated or begin to rise. I would expect real rates to turn into a drag on risk assets, and would likely revise my year-end ES outlook lower (more on this at the end of the report).
Yield curves
The 2s10s has done remarkably little since the April tariff shock, but I like to focus on the path more than the destination. Structurally, a steeper curve still makes sense as growth and inflation are being realised in the long end while the Fed eases the front end. But 2026 isn’t a straight line.
My base case for 2026 remains a gradual steepening of the yield curve, driven by easing at the front end alongside realised growth and inflation in the long end. That said, the path will not be linear. There are two secondary flattening scenarios I am monitoring closely, both of which could occur temporarily within an otherwise steepening regime. Please focus on the key word so that my overall outlook isn’t misunderstood… temporarily!
The first is inflation-driven flattening. The December 2026 (Z6) contract currently prices roughly 3 cuts. If inflation stalls or re-accelerates modestly early in the year, the market is likely to push those cuts out into 2027. That repricing would pressure the front end and open a short-lived bear-flattening window, potentially lasting a month or two, as investors are forced to reassess Fed credibility, another risk that remains surprisingly under-discussed.
Importantly, not all steepening is equity-friendly either. Bear steepening driven by rising term premium, rather than genuine growth optimism, is where risk begins to build. In that environment, the long end sells off even as the front end eases, duration risk overtakes growth risk, and equities lose their ability to hedge rate moves effectively. This is the core lesson of 2022, though in 2026 it would likely play out in a more muted form. What my focus is on, is what’s driving steepning rather that the steeepning itself.
The early warning signals I will be focused on are: long-dated yields grinding higher while growth indicators begin to roll, at the same time that inflation swaps hold firm, and FX volatility moves higher. When those conditions align, equities typically respond with a lag (and not to the upside…).
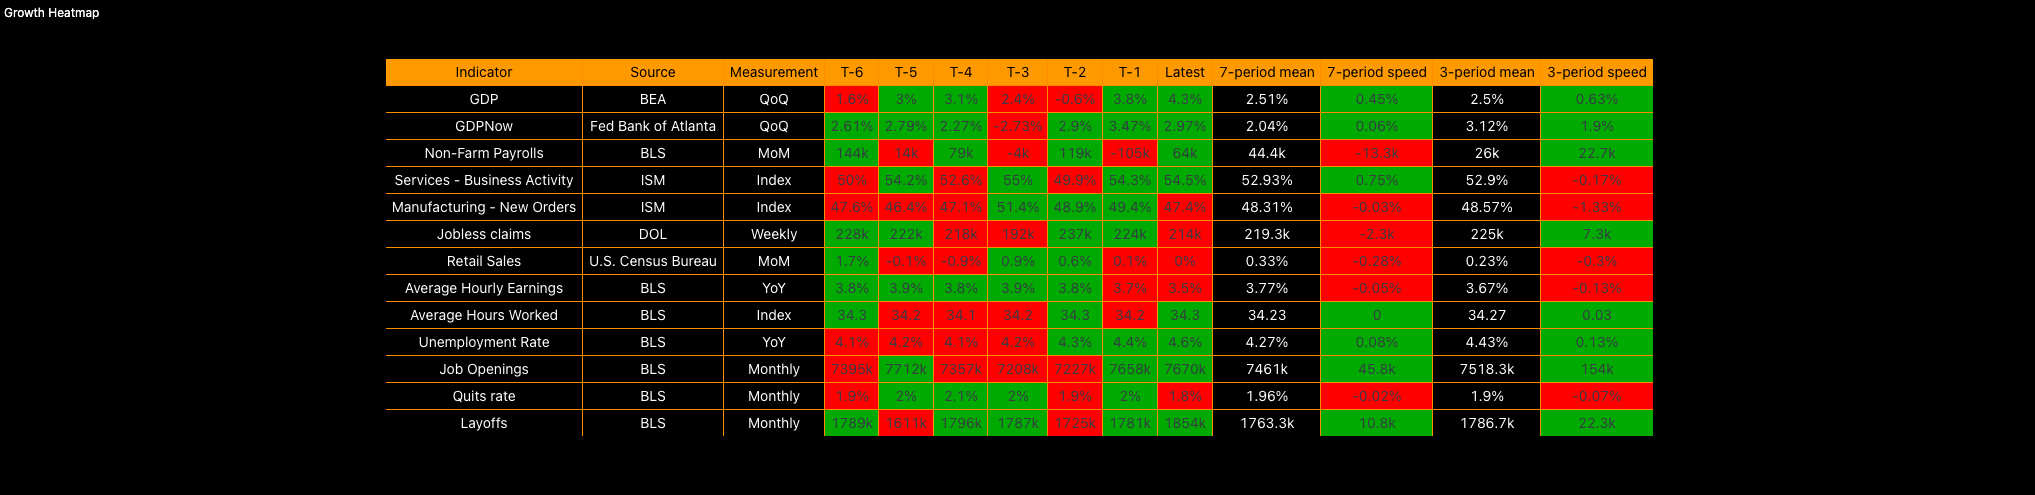
The second flattening risk is a growth scare, which markets tend to react to more violently than inflation scares. A run of weak labour or consumption data could pressure the front end again, producing a brief bull-flattening episode. However, this is not my base case. Labour data in 2026 is likely to become increasingly lagging and noisy, payrolls may hold up even as hours worked stagnate and real wage growth compresses through inflation. Given the strength of the underlying growth metrics outlined below, I view a persistent bull-flattening regime as unlikely, though all relevant falsifiers must continue to be monitored.
Why the curve direction and path matters is straightforward. If you trade rates, curve steepeners give you a partial hedge against exposure elsewhere in the portfolio. They need to be used carefully though. You don’t want the portfolio becoming overly directional, especially if you’re already leveraged long equities off the same regime view.
More broadly, the yield curve is a direct reflection of the macro regime we’re in. Growth, inflation, policy, liquidity, and credit all get priced into yields. If bear flattening persists for more than a couple of months, it becomes a genuine tail risk for being long equities. That’s why tracking yield-curve regimes matters well beyond just 2s10s. You need to monitor the whole curve and model the potential paths, in the same way you would for real rates.
A sustained bear flattening, particularly one driven by inflation pressure and a repricing of the front end, can easily mark an equity top. 2022 is the reminder everyone forgets. But as I laid out above, I believe that any bear flattening would be temporary.
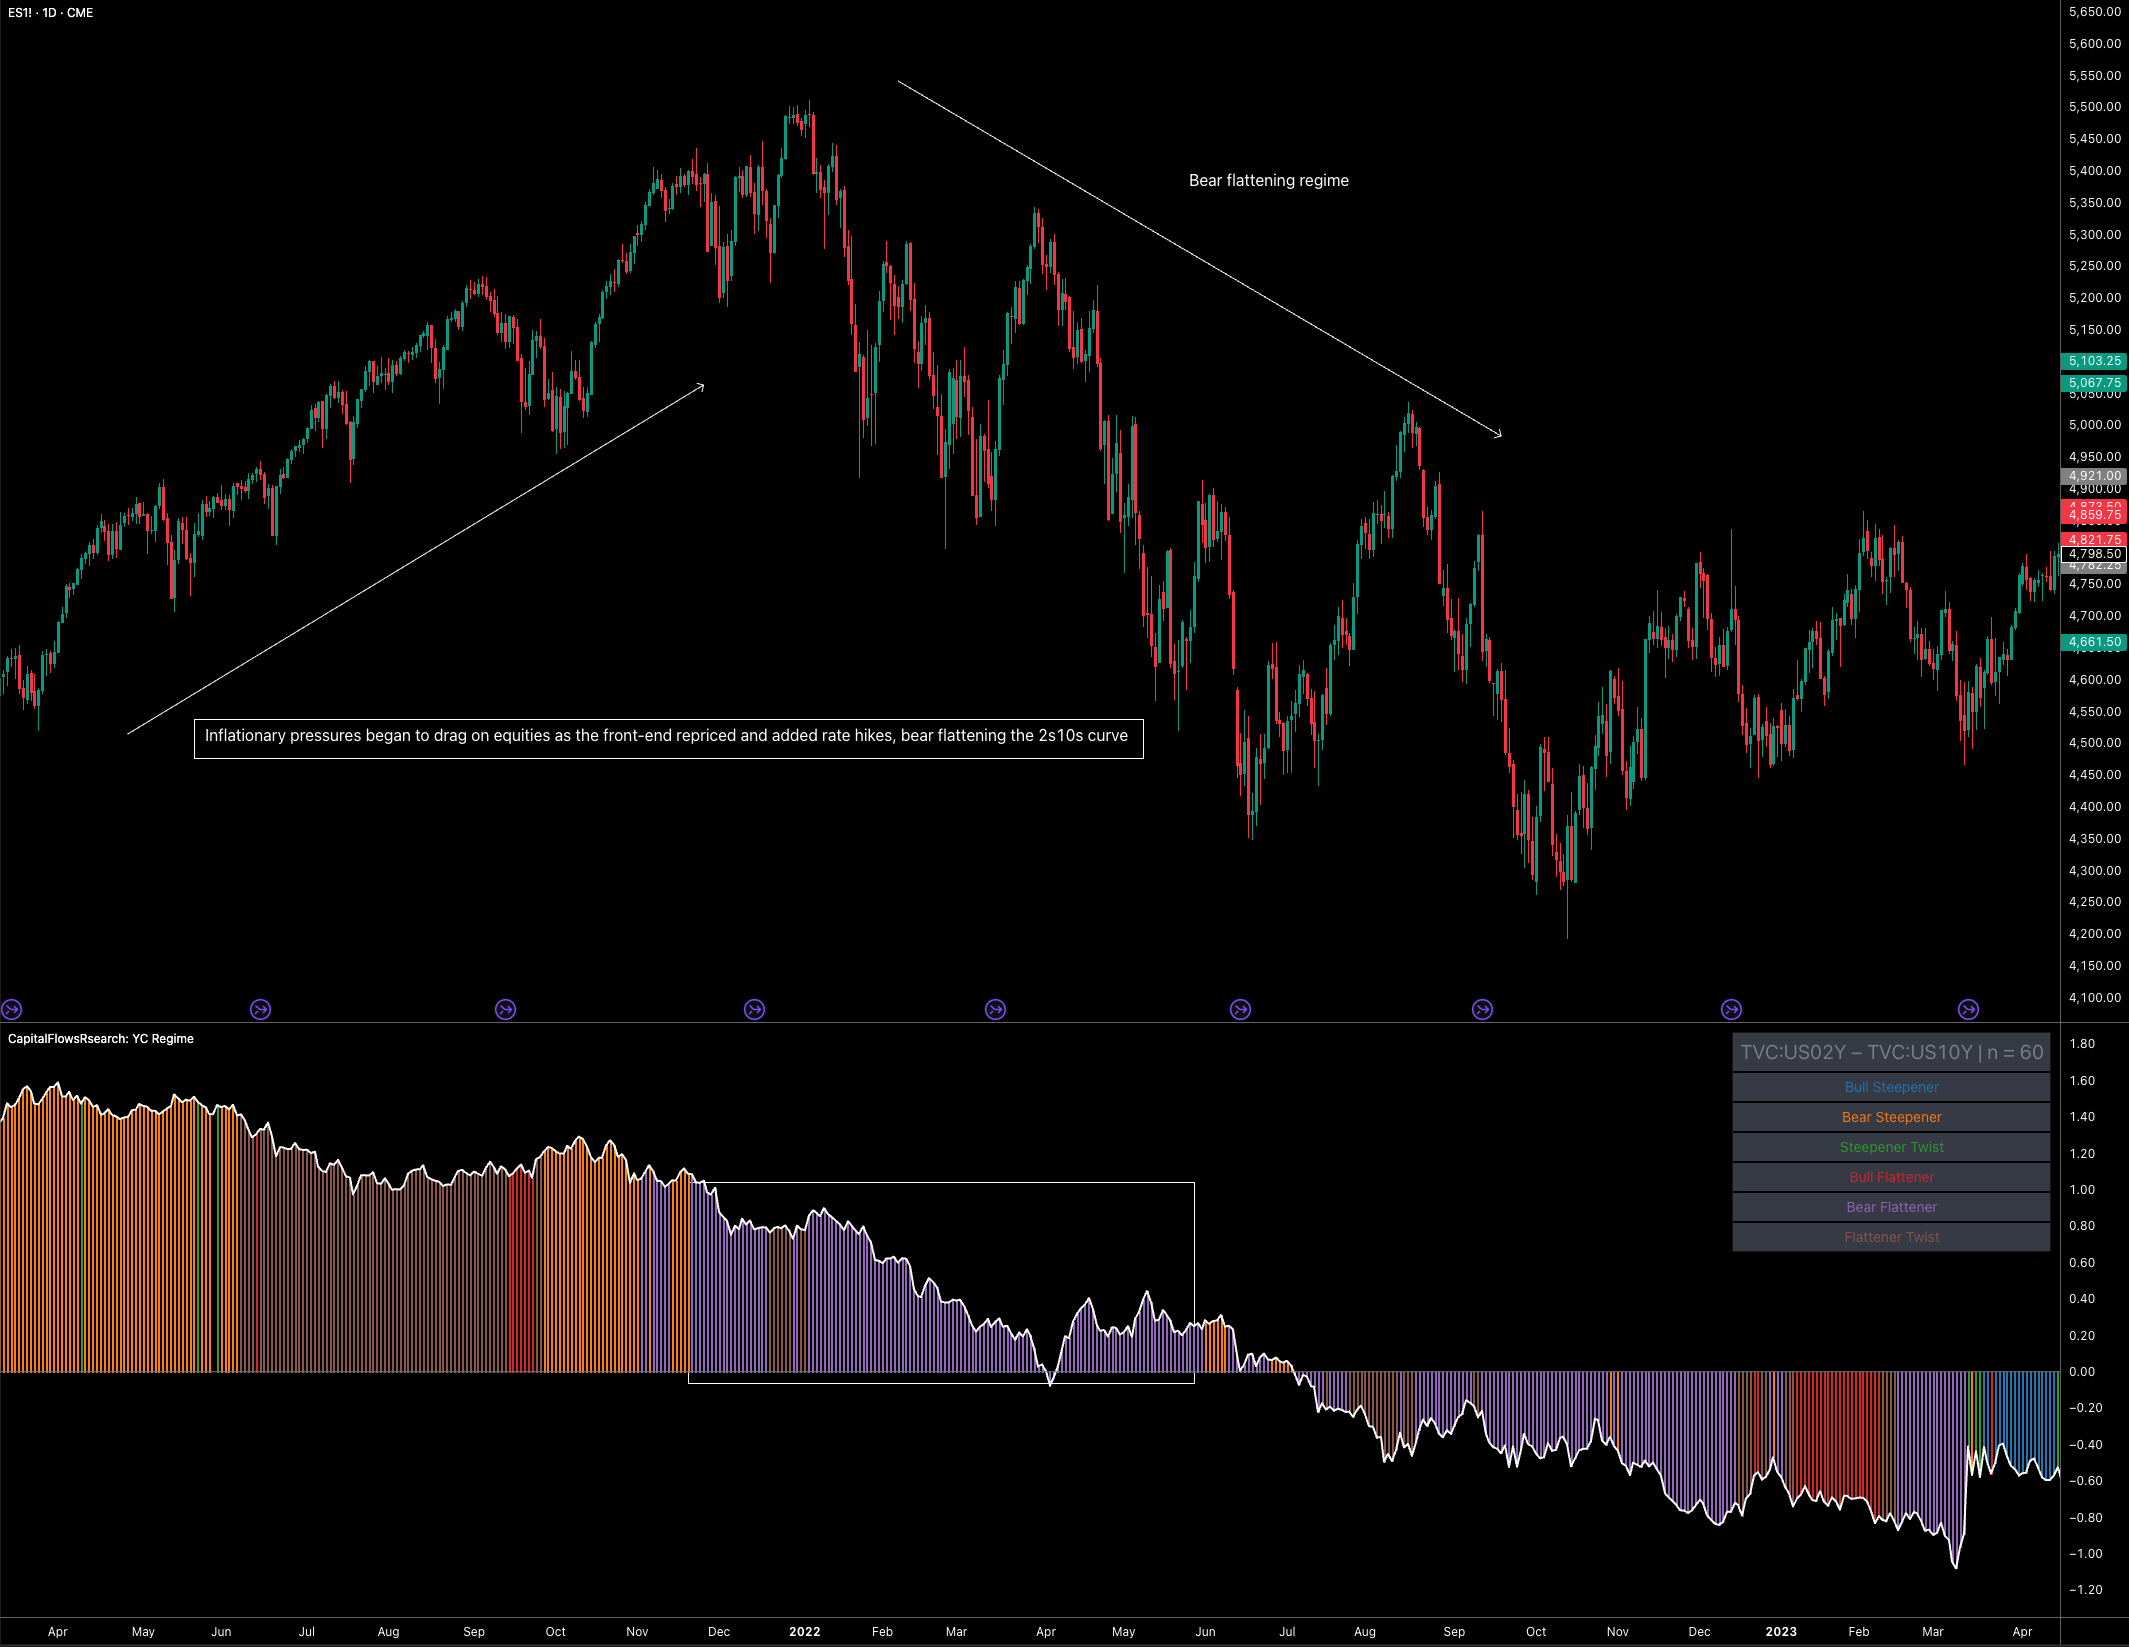
Yield curve indicator from Capital Flows in this report:

Overall, I expect bull steepening to dominate the year, with one or two brief flattening episodes driven by inflation or growth scares. Prolonged bear flattening would be a serious equity warning, and that’s why curve regime tracking matters so much.
ES (S&P 500)
At its core, the price of ES is just a byproduct of multiple structural forces moving together… growth, inflation, and policy. That’s why the most important thing for you to do this year is build models that accurately map inflation, growth, policy, credit, liquidity, and volatility. ES simply reflects how those pieces interact. Rather than flooding you with the 40+ charts I use to track the regime, let me focus on the current state of play and the key dynamics we’re seeing right now.
As laid out above, I expect the curve to steepen through the year, driven by stronger growth and higher inflation. Crucially, I think growth accelerates at a faster and more aggressive pace than inflation. In that environment, higher realised long-end yields create less drag on equities because growth is outperforming inflation. The risk only becomes important when inflation runs ahead of growth, pushing the long end higher for the wrong reasons and weighing on equities because growth can’t offset the tail risk.
Alongside that, I expect real rates to trend lower, supporting liquidity that will be transmitted into equities (although I know this isn’t a direct relationship). With that framework in mind, the focus now shifts to the key signals that are pointing to where ES is heading next.
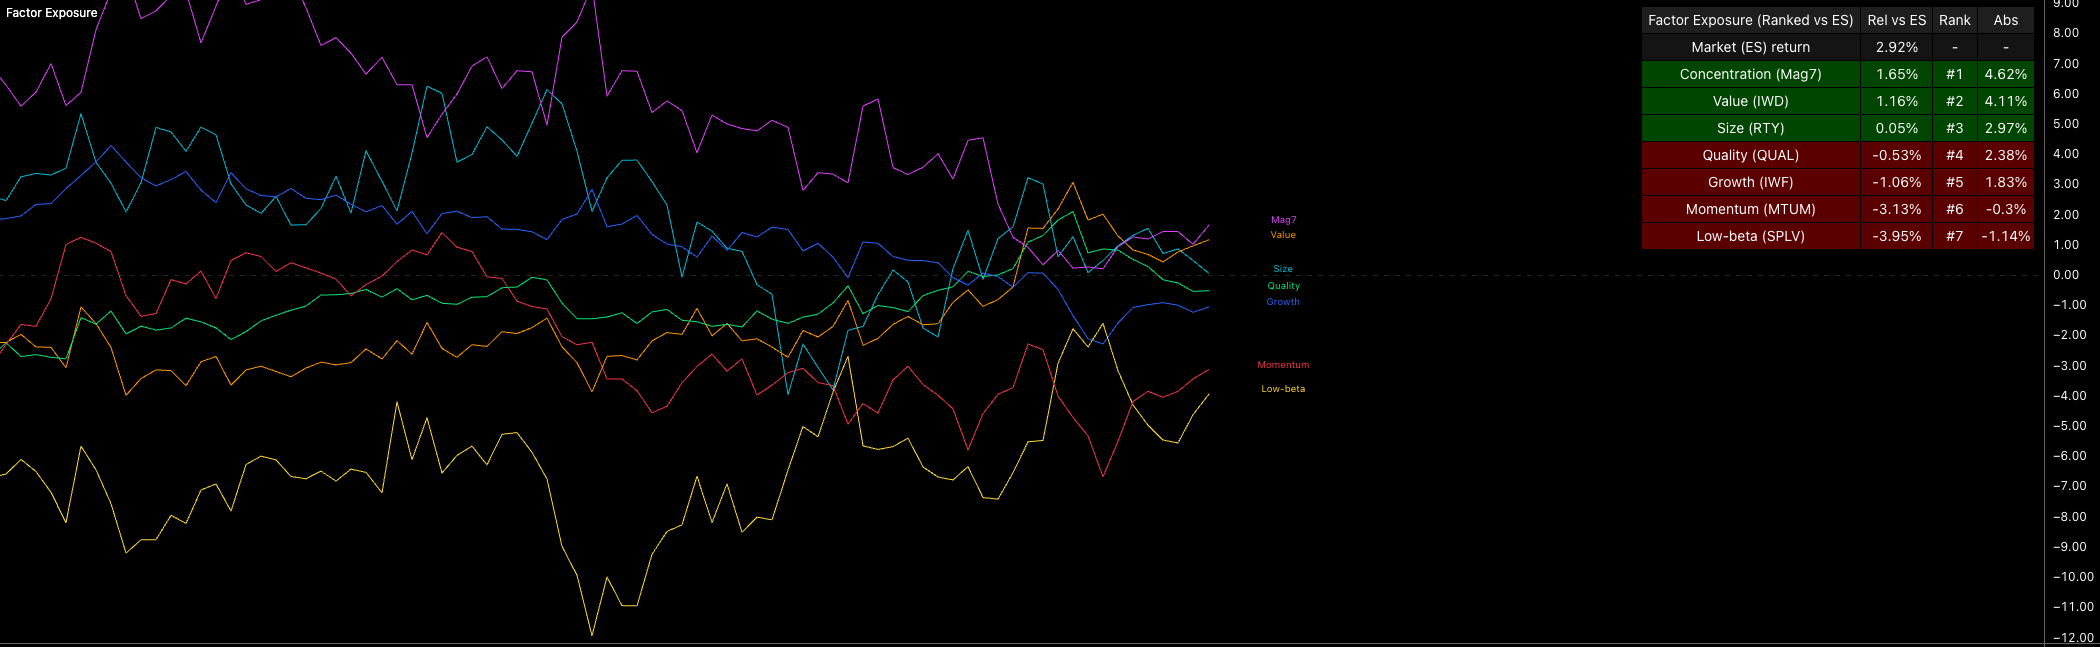
The factor exposure basket isn’t telling me ES is about to rally 5% in January, and it isn’t calling the end of equities either. What it is showing, over the past 3 months, is a clear shift in appetite. Growth and momentum have been slipping down the rankings, while concentration and value have moved into the lead. That isn’t a high-risk-on setup. For me to have high conviction that equities push meaningfully higher from January, I’d need to see that factor leadership rotate again.
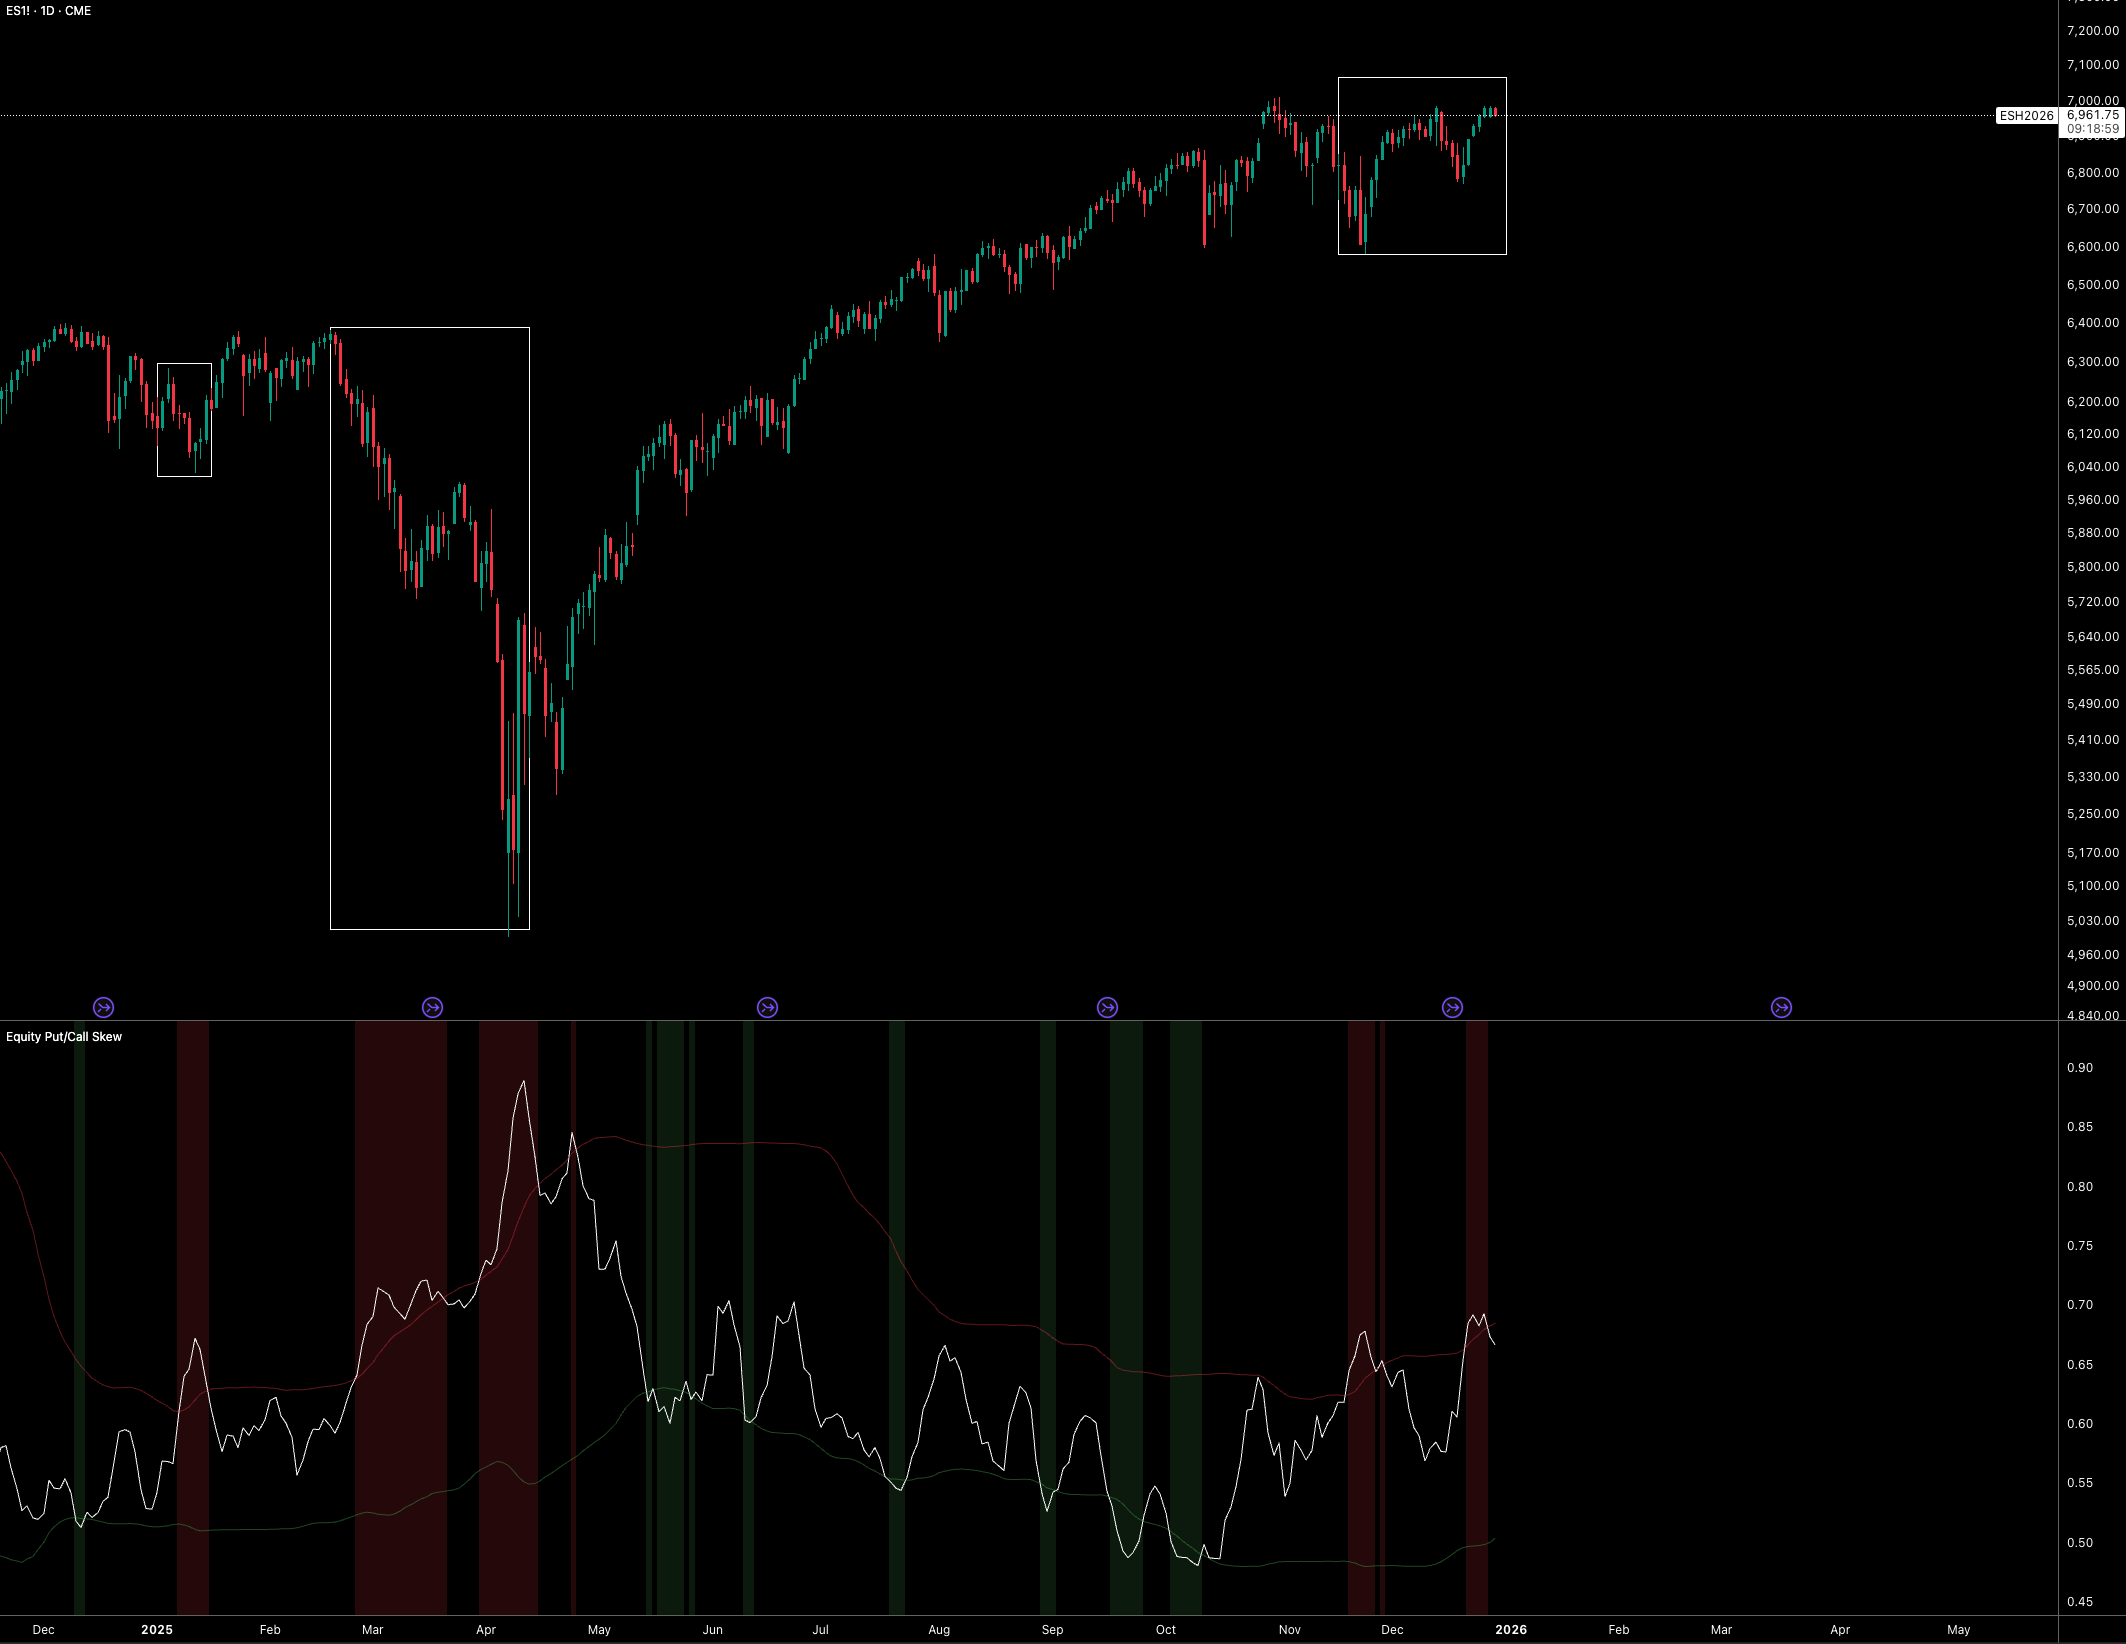
Another, smaller source of concern for ES positioning sits in the equity put/call skew. We saw several months of upside chasing in the skew as equities rallied, tensions eased, and liquidity searched for risk wherever it could find it. More recently, equities have moved into a range, with downside covering becoming more visible in the skew. This isn’t an environment where I’d want to be running leveraged long exposure. Similar to factor exposure, I’d want to see a shift in the skew here before I position.
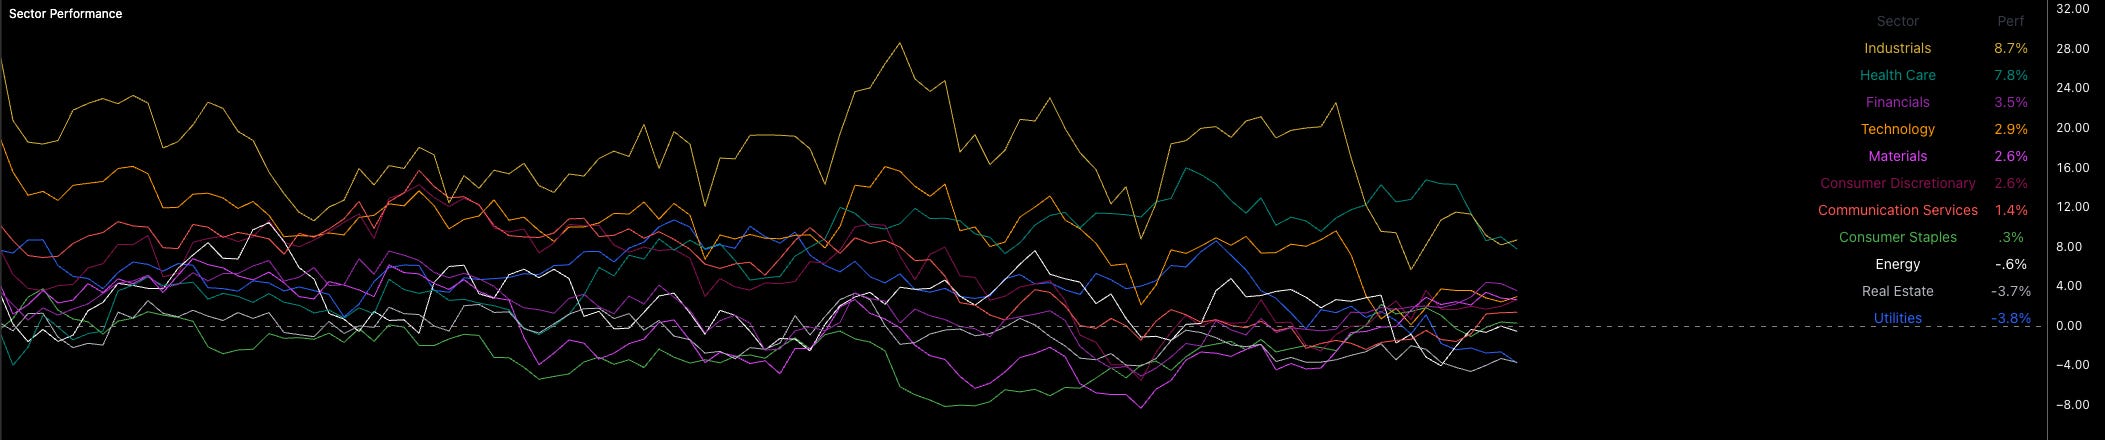
Sector performance over the last 60 trading days has actually been much more supportive of risk-taking. Even with healthcare sitting 2nd, the overall mix is strong. Industrials are leading, with financials and tech close behind. Risk is still being recycled into equities. That said, we’re not seeing this show up in crypto, which clearly has issues of its own.
As long as sector leadership doesn’t shift in a meaningful way… for example, utilities starting to outperform tech, then this backdrop remains supportive for upside in ES.
The factors above matter more for near-term positioning than for the structural regime, which is really defined by the yield curve, credit, volatility and real rates. My base case is continued range-bound action at best through January, before the setup becomes more attractive for holding leveraged longs towards 7800 (year-end), especially with credit spreads still sitting near cycle lows.
The key point is this: even when you have a strong structural bias on the regime, you still need positioning to line up before the odds favour being leveraged long. One of my performance models that monitors the 10y, RTY, breakevens and credit spreads below is currently signalling a risk-off regime. We don’t rely on a single confirmation, but for positioning this matters. Just look at how well the model behaved as equities rallied through 2025.
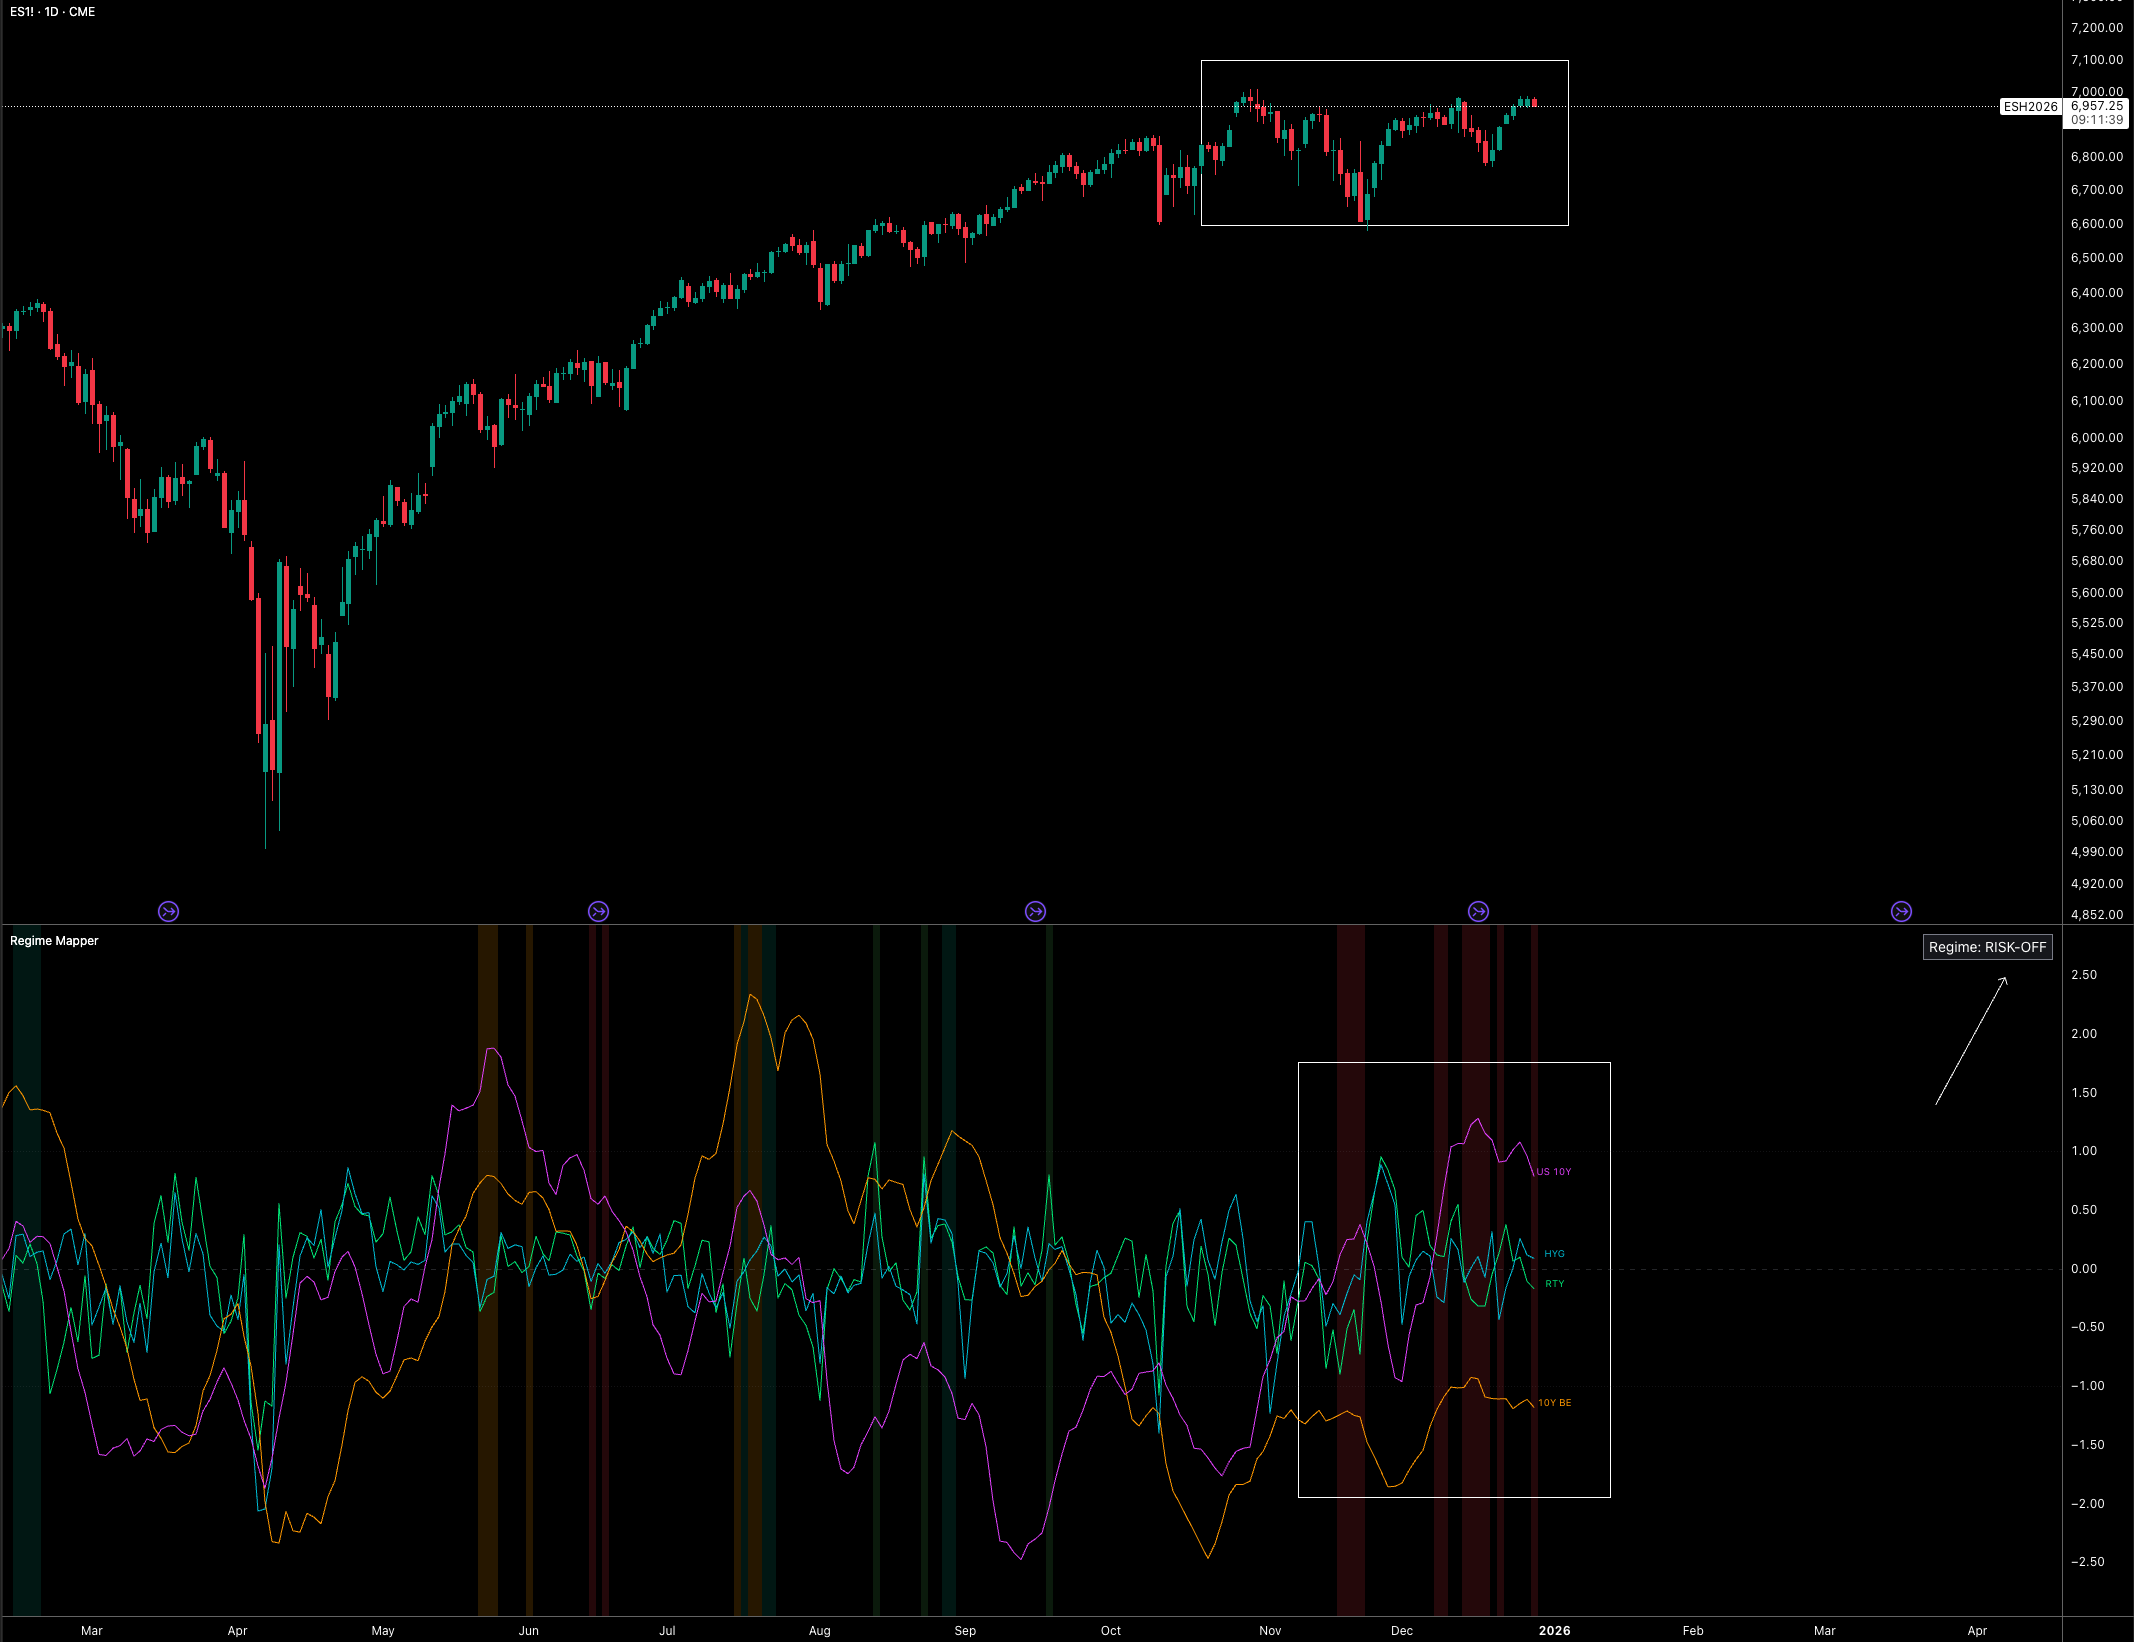
Structural bias doesn’t mean immediate leverage. You wait for the odds.
The big picture for 2026
To simplify it all:
• Real rates drift materially lower, driven by sticky inflation and an accommodative Fed
• Liquidity rises but confidence doesn’t materalise higher, velocity stays low in higher risk assets
• Yield curves steepen over the year, with short flattening episodes on inflation tail risks
• ES grinds higher unevenly, with rotation and dispersion doing the heavy lifting
My rough end-game looks like this: ES around 7800 after some drawdowns driven by curve repricing, real rates below 1.1%, and a structurally steeper curve defining the regime (with a period of flattening on inflation risk).
This won’t be like previous years where liquidity impulses always directly resulted in equity rallies. It’s a year where understanding how liquidity moves matters more than how much exists, and where macro discipline beats blind beta.
Wishing you all the best in the new year!
Great informative post, but wouldn’t it be a better framework if you would list all scenarios that could occur in the sections you mentioned? You wrote that you expect lower real rates driven by sticky inflation and an accommodative Fed. Why do you expect sticky inflation, based on what data? It’s just one outcome. It could literally do 10 different things.
would love a scenario analysis on that!
Is your "Regime mapper" indicator public? looks interesting