
Duration Risk, Not Credit Risk
When higher inflation is a duration problem, not a credit problem

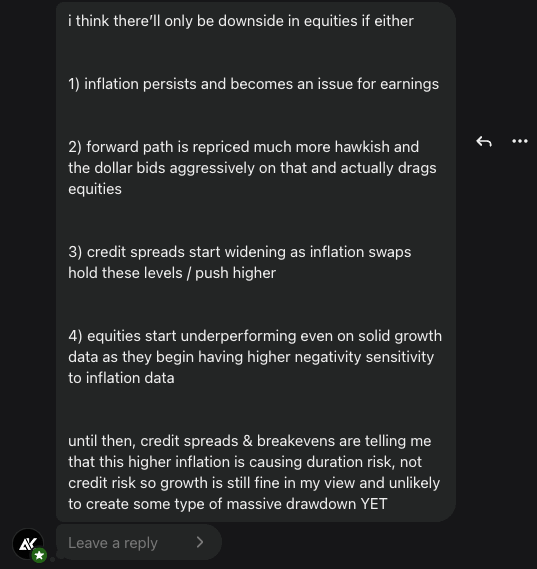
I made this point below in the Substack chat, now I thought it’d be a great time to write a full report on WHEN I’d flip from long to neutral/short equities
The DAX is rallying from the thesis I shared 2 weeks ago and I still believe we will see ATHs in the DAX across the next month given that there is NO changes to the ideas I laid out, see these 2 reports below:


The four boxes that would actually flip me bearish
Equities have had a tiny bit of a wobble as breakevens are sat firm, while the dollar is still trading firm, now a LOT of people are already lining up to call the top on this rally (which I completely disagree with). The conditions that would actually break the setup we have in equities right now have not shown up, and the cross-asset signature we’re getting from credit, spreads, breakevens, and equity sensitivity is consistent with a market repricing duration risk, NOT credit risk. The difference between duration risk and credit risk is the difference between a multi-week chop inside a structurally intact uptrend (duration risk), and a genuine regime-defining top (credit risk).
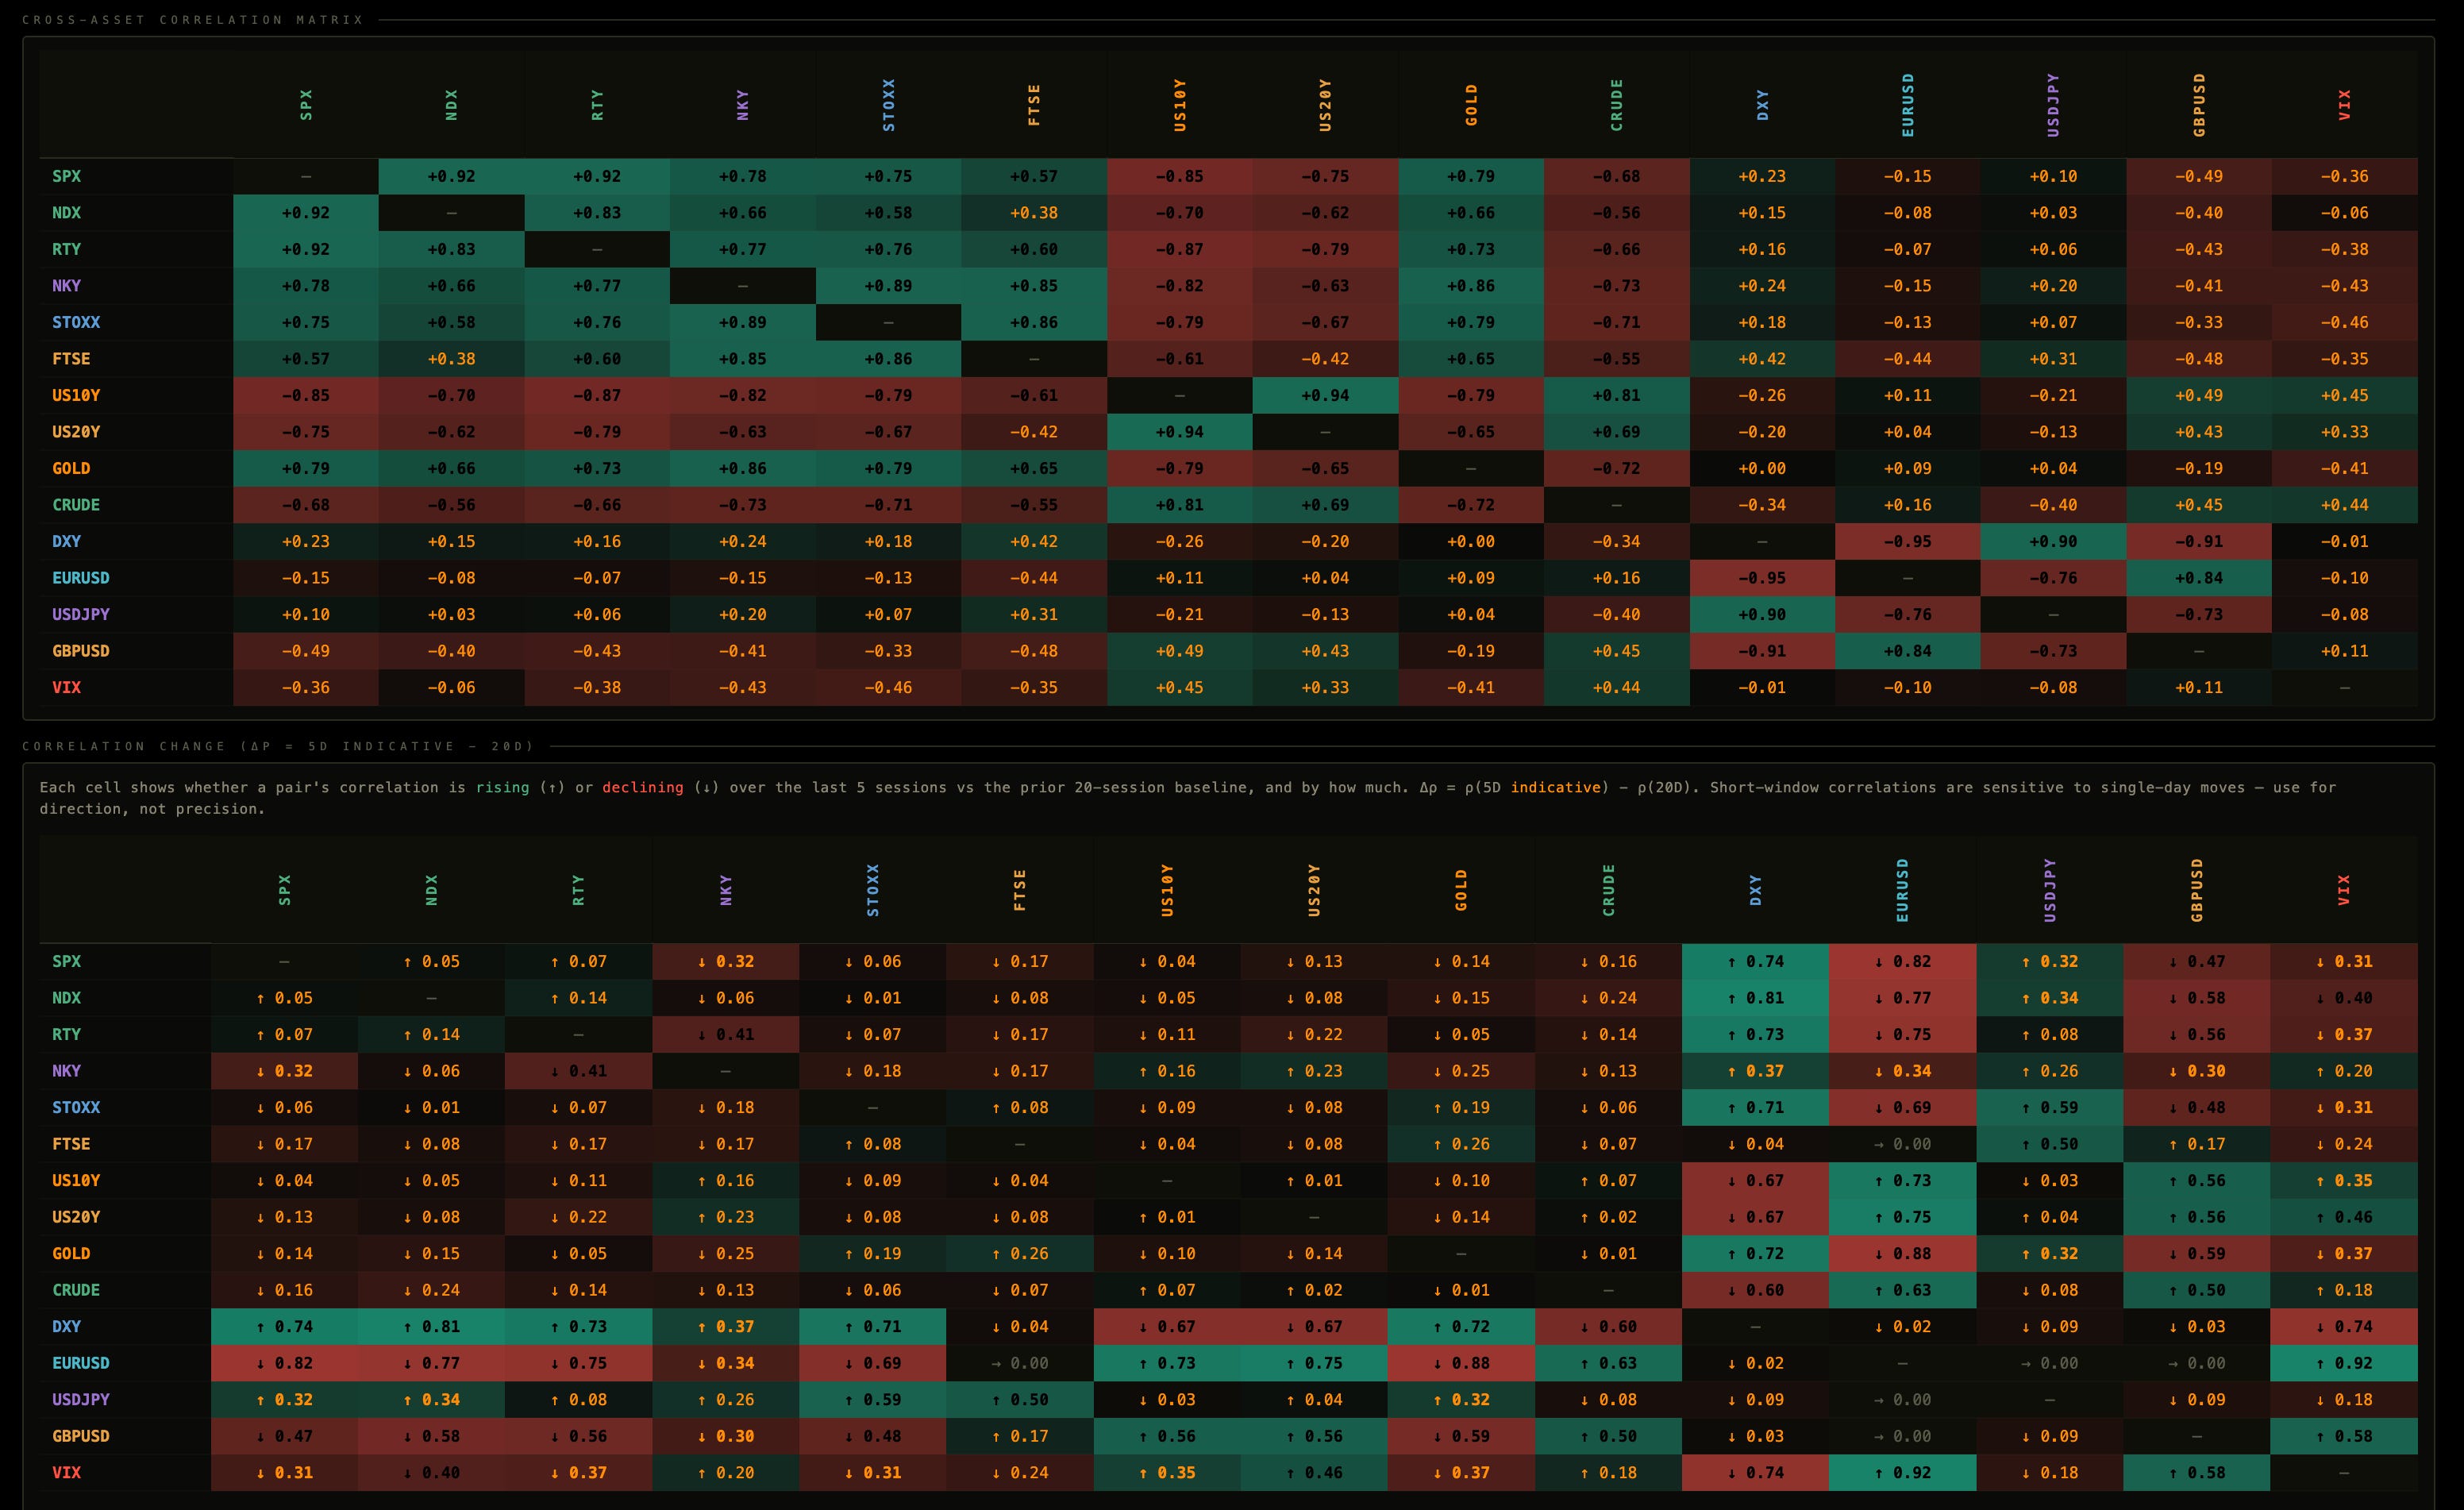
This is how my economic data and asset market pricing model sees the setup:

I remain bullish on equities. In this report I will walk through the framework I’m running, the four specific transmission channels that would have to fire for me to flip, the cross-asset evidence on each one, and the EXACT signals I’m monitoring to flag the regime change in real time.
Why this matters: not all inflation is created equal
Before I get into the four boxes, I want to push back hard on a piece of pattern-matching that I think is doing real damage to bearish positioning right now. The intuition goes like this: inflation print comes in hot, then equities should sell off, then I should be short. That’s a one step reasoning chain in a five step transmission system and it skips EVERY key question along the way.
Inflation can transmit to equities through at least four distinct channels, and each one has a different signature, a different time horizon, and a different cross-asset fingerprint. The reason this matters is that the cross-asset signal tells you which channel the market is pricing, and the channel determines whether you’re looking at a vol event or a regime change.
Channel one is the earnings channel, where persistent inflation eats into corporate margins, real wages compress, top line growth slows, and you get a fundamentals-led drawdown. Channel two is the rates channel, where a hot print forces the curve to reprice the forward path, the dollar bids on that, and equities get dragged through tightening financial conditions and FX translation (we had this marginally in March/April).
Channel three is the credit channel, where inflation stays sticky, real growth starts to look fragile, and credit decides that’s a default risk rather than a duration risk, with spreads widening as the lead indicator. Channel four is the most regime-defining one, where equity beta to growth and inflation surprises flips, the market starts trading hot data as bad news, and we move from “growth is good” to a “Fed has more work to do”.
These channels are NOT mutually exclusive, but they are sequentially distinct. The cross-asset tape tells you which one is active, and right now the answer is pretty clear (the rates channel is doing some work, the other three are dormant).
Channel 1: Inflation persists and becomes an earnings problem
This is the slowest moving channel. For inflation to genuinely break equities through the earnings channel, you need to see three things lining up: input cost pressures that corporates can’t pass through, real disposable income compression that slows the top line, and revisions rolling over in a way that’s broad-based rather than sector-idiosyncratic.
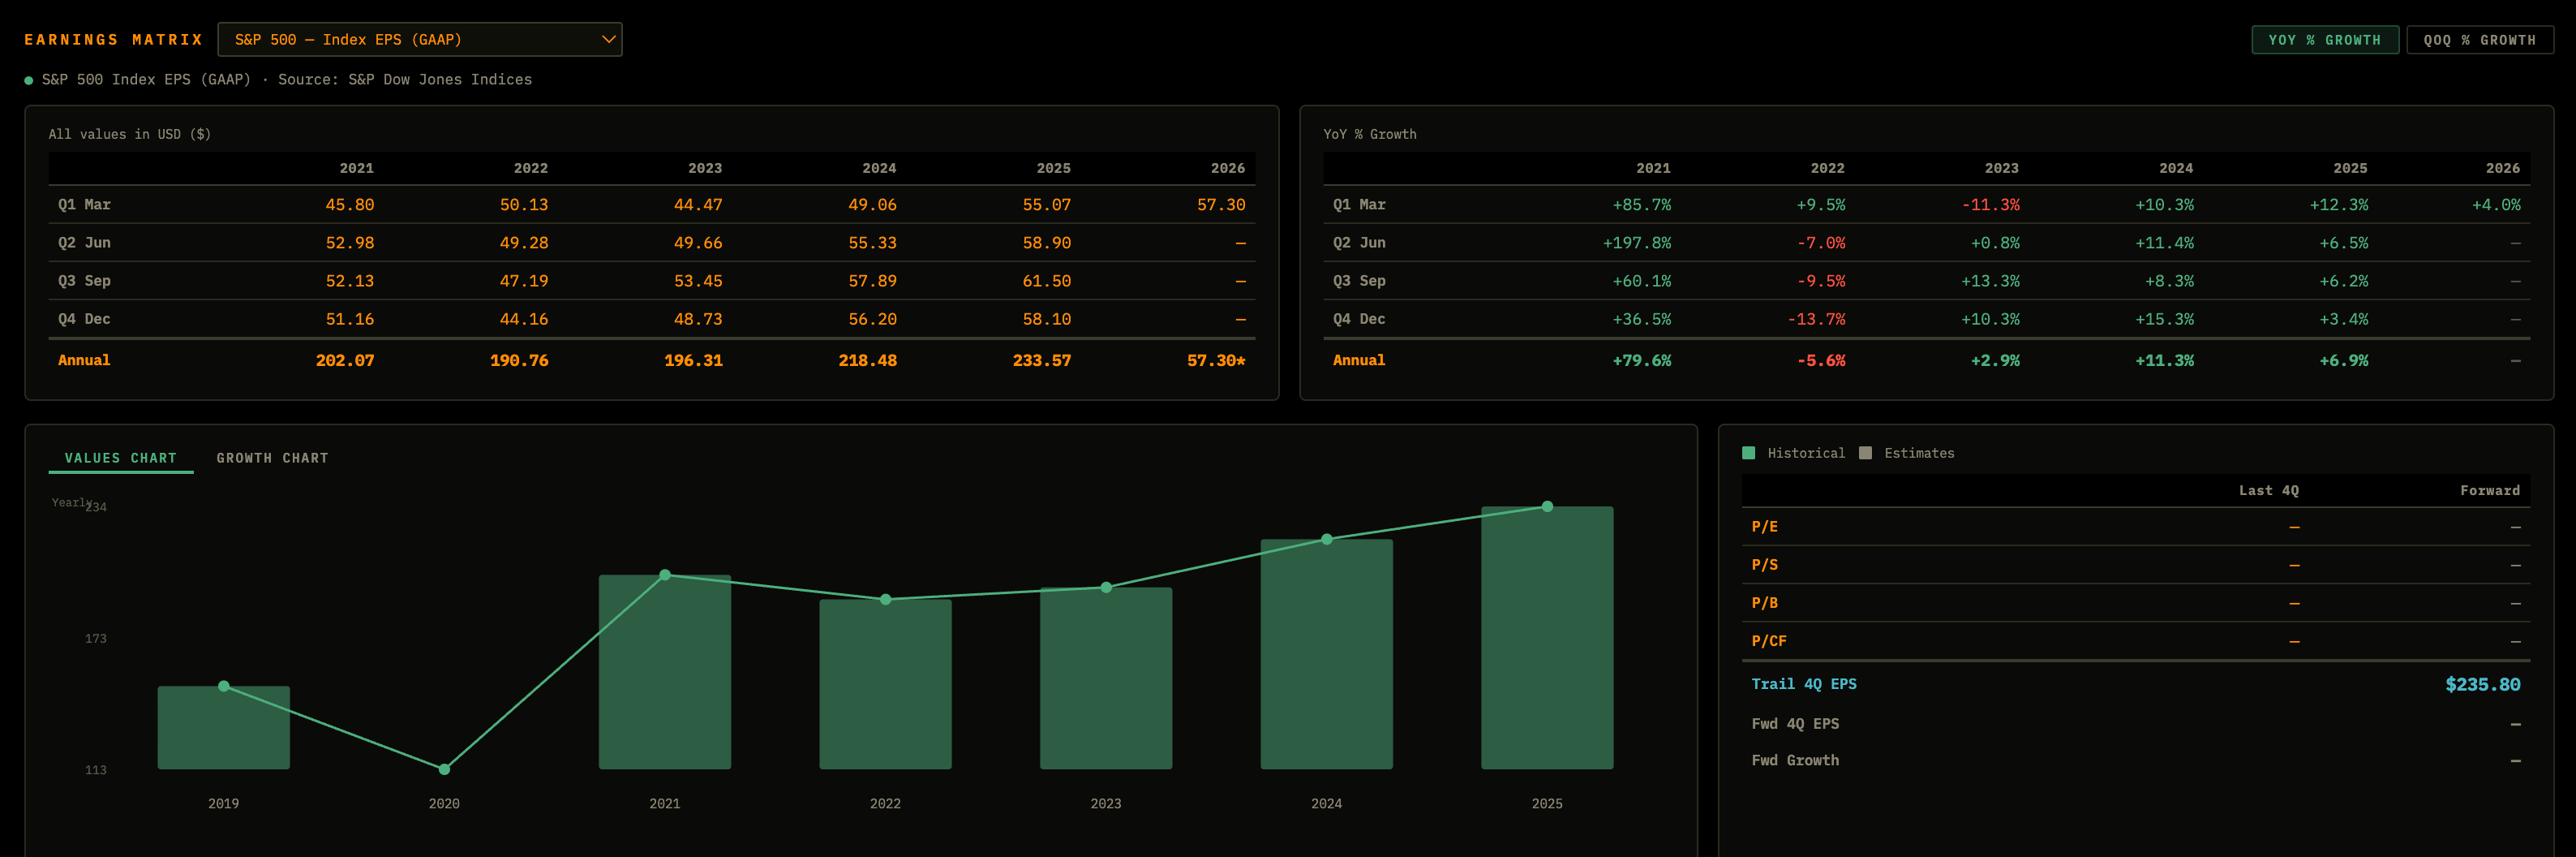
Where we actually are is a place where revisions have been mixed, margins have held up better than the bear case predicted 12 months ago, and the dispersion across sectors suggests we’re seeing minor rotation rather than a broad earnings deterioration. The ERP, earnings yield minus real yield, is not flashing the kind of compression you’d expect if the market thought earnings were about to roll. Forward EPS estimates are still drifting up in aggregate.
The reason this matters A LOT for the bullish thesis is that the earnings channel is the only channel that produces a sustained, fundamentals-led equity drawdown rather than a vol event. Rates-driven sell-offs can be sharp but they tend to mean-revert when the rates side calms down. Credit-driven sell-offs require credit to actually start widening (which it isn’t). Sentiment-driven sell-offs unwind. Only the earnings channel produces a sustained move lower, and the data we have right now is just NOT consistent with that channel being active.
What I’m monitoring is the forward EPS revisions breadth (not just headline number, but the proportion of revisions going up vs down), margin commentary in earnings calls, and crucially the relationship between nominal and real corporate revenue growth (and broad nominal vs real growth). When that gap starts to compress because pricing power is breaking I’d worry. We’re not there.
Channel 2: Forward path repriced much more hawkish, dollar bids aggressively, and drags equities
This is the channel with the shortest fuse and the one I’m watching most actively. It’s also the channel that’s done the most work over the last few weeks/month, but critically, not enough to flip the regime.
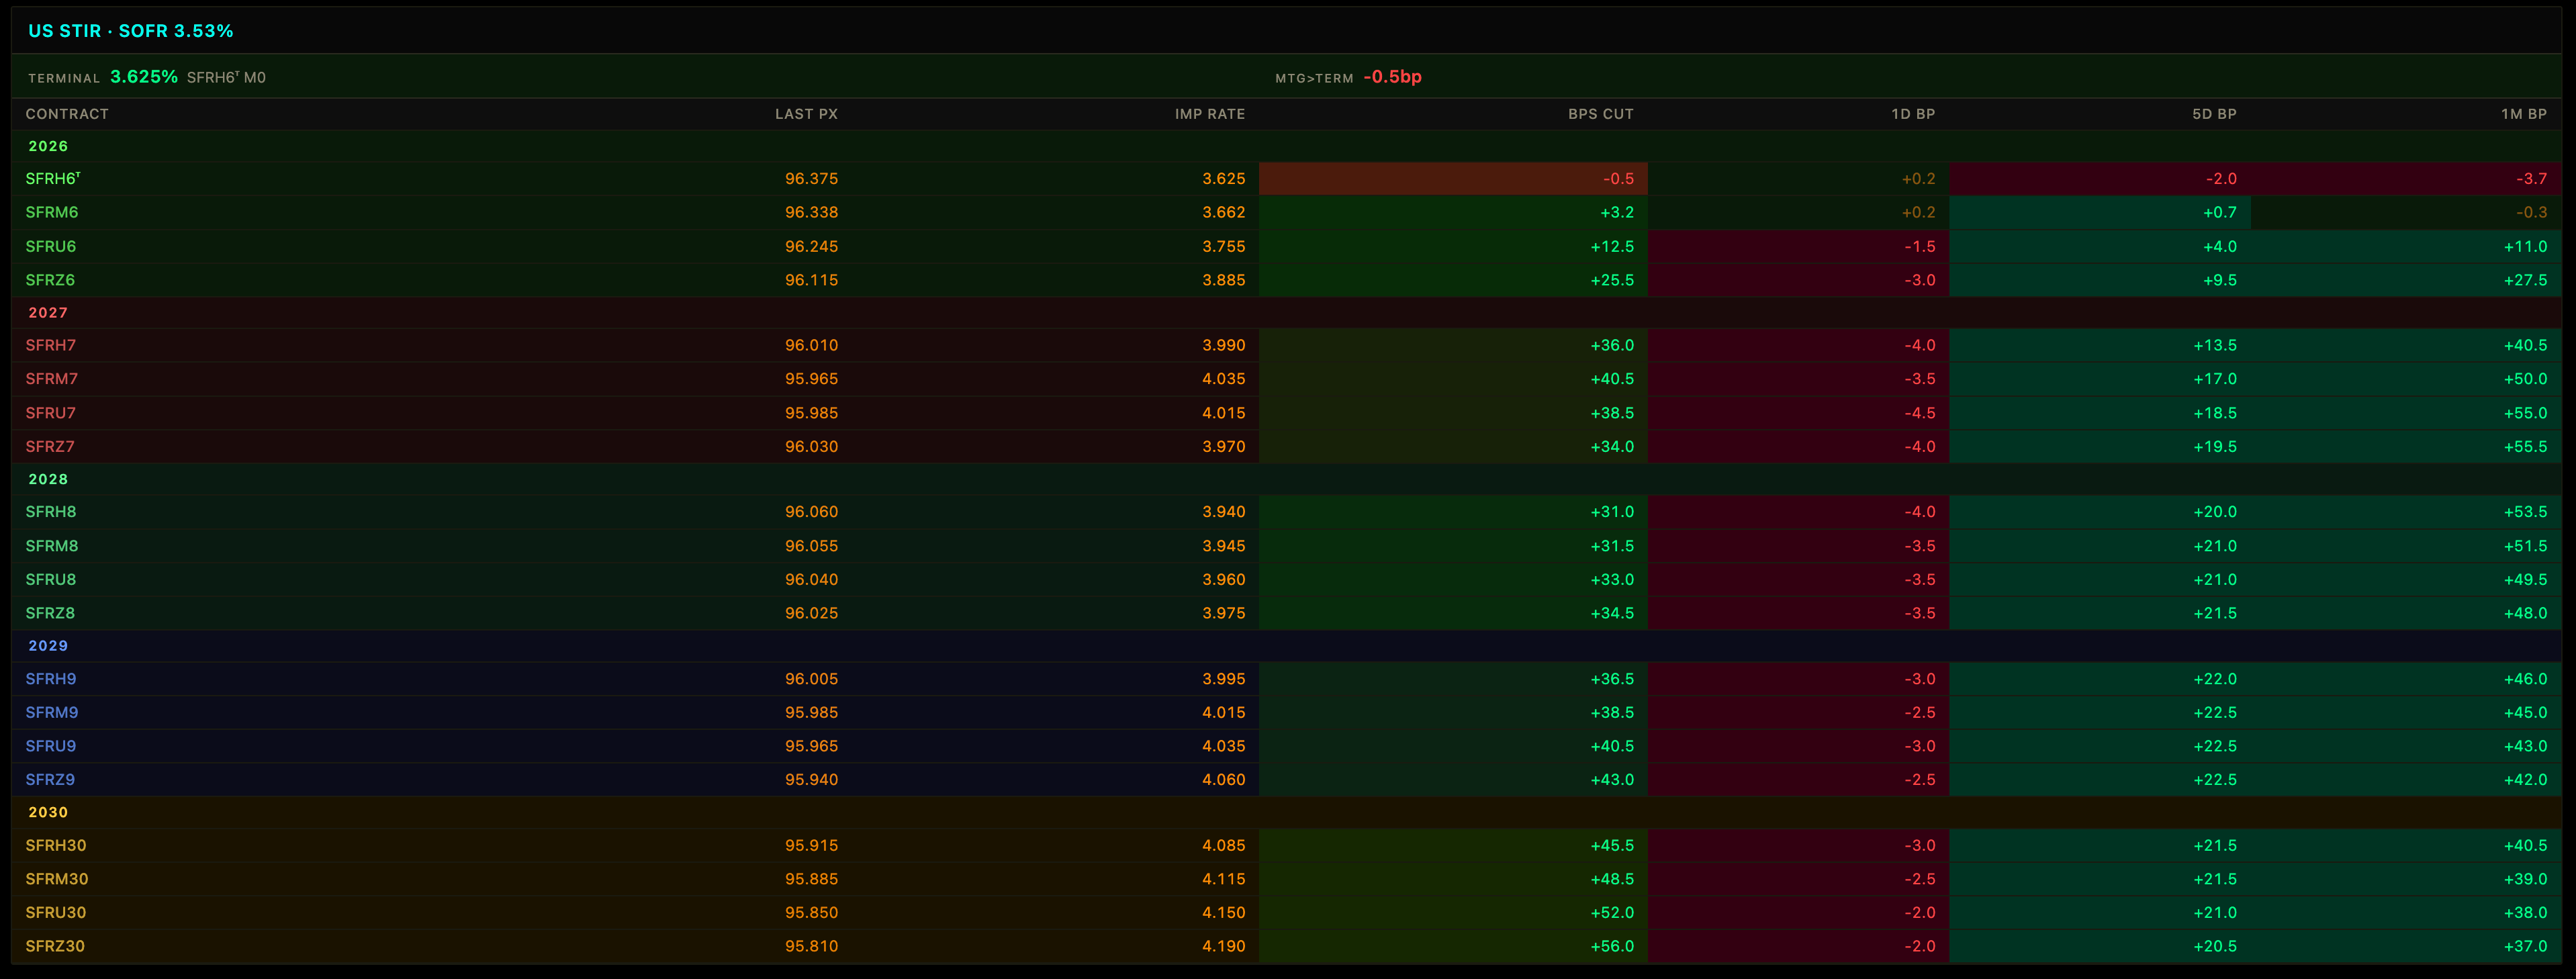
A hot inflation print forces the curve to reprice the terminal rate higher. Short-end yields back up. The SOFR strip pushes the cutting cycle further out or fewer cuts overall. Real yields back up because the nominal repricing outpaces the breakeven move. The dollar bids on rate differentials, and a stronger dollar tightens global financial conditions, hurts emerging markets, drags multinational earnings through translation, and increases the discount rate on equity duration.
But people forget that these forward inflation prints are already priced, we’d need to see significant surprises to the upside to reprice this forward curve (probably a 20-30bp range higher).
Now the setup above doesn’t neccesarily look great for equities, but we’re just off ATHs as the forward curve sits here, meaning if we reprice the forward curve, it’ll be an assymetric move.
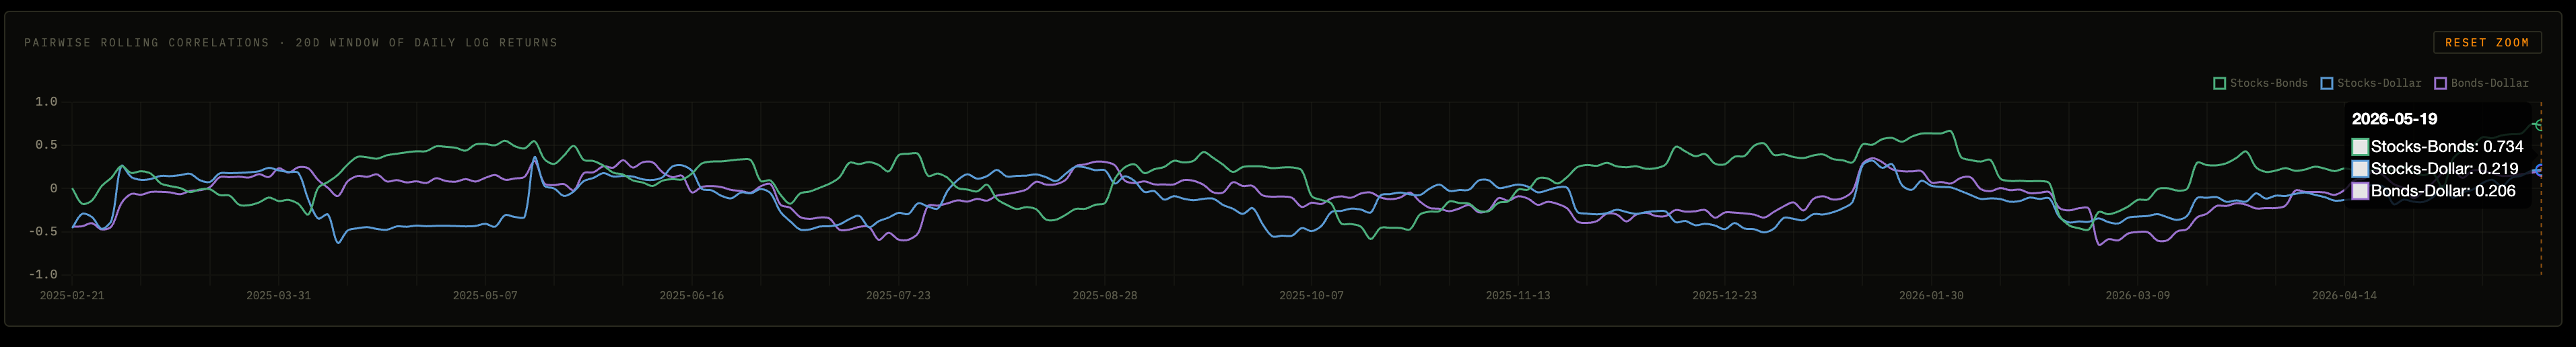
For the dollar channel to actually drag equities, you need to see the equity-dollar correlation flip from neutral or weakly negative to strongly negative. You need DXY going up while SPY is going down, and you need that to be persistent across multiple sessions rather than coincident on one print. Rolling beta of SPY returns to DXY returns is the cleanest measurement of this, and right now it’s wobbling around neutral, occasionally negative on specific days but not regime-shifted.
The other thing to monitor here is the SOFR strip shape itself. If the market is pricing fewer cuts but the terminal rate is stable, that’s a delayed-easing story instead of a hawkish shock. If the terminal rate itself starts pushing meaningfully higher and the strip steepens at the long end, that’s a hawkish regime shift and that’s when the dollar bids in a way that causes tailwinds.
There’s a second-order point here worth making, which is that not all dollar strength is equal in its equity impact. Dollar strength driven by US economic outperformance is generally equity-positive (the risk-on dollar). Dollar strength driven by hawkish Fed repricing is equity-negative (the rate-differential dollar). The same DXY number can be either, depending on what’s actually driving it, which si why attribution analysis is SO important.
The way to disambiguate is to look at whether front-end US yields are leading the dollar move (rate-differential, bearish) or whether US growth surprises are leading it (outperformance, neutral to bullish). Right now, it’s been more outperformance than rate-differential, which is why the dollar bid has not yet started doing equity damage.
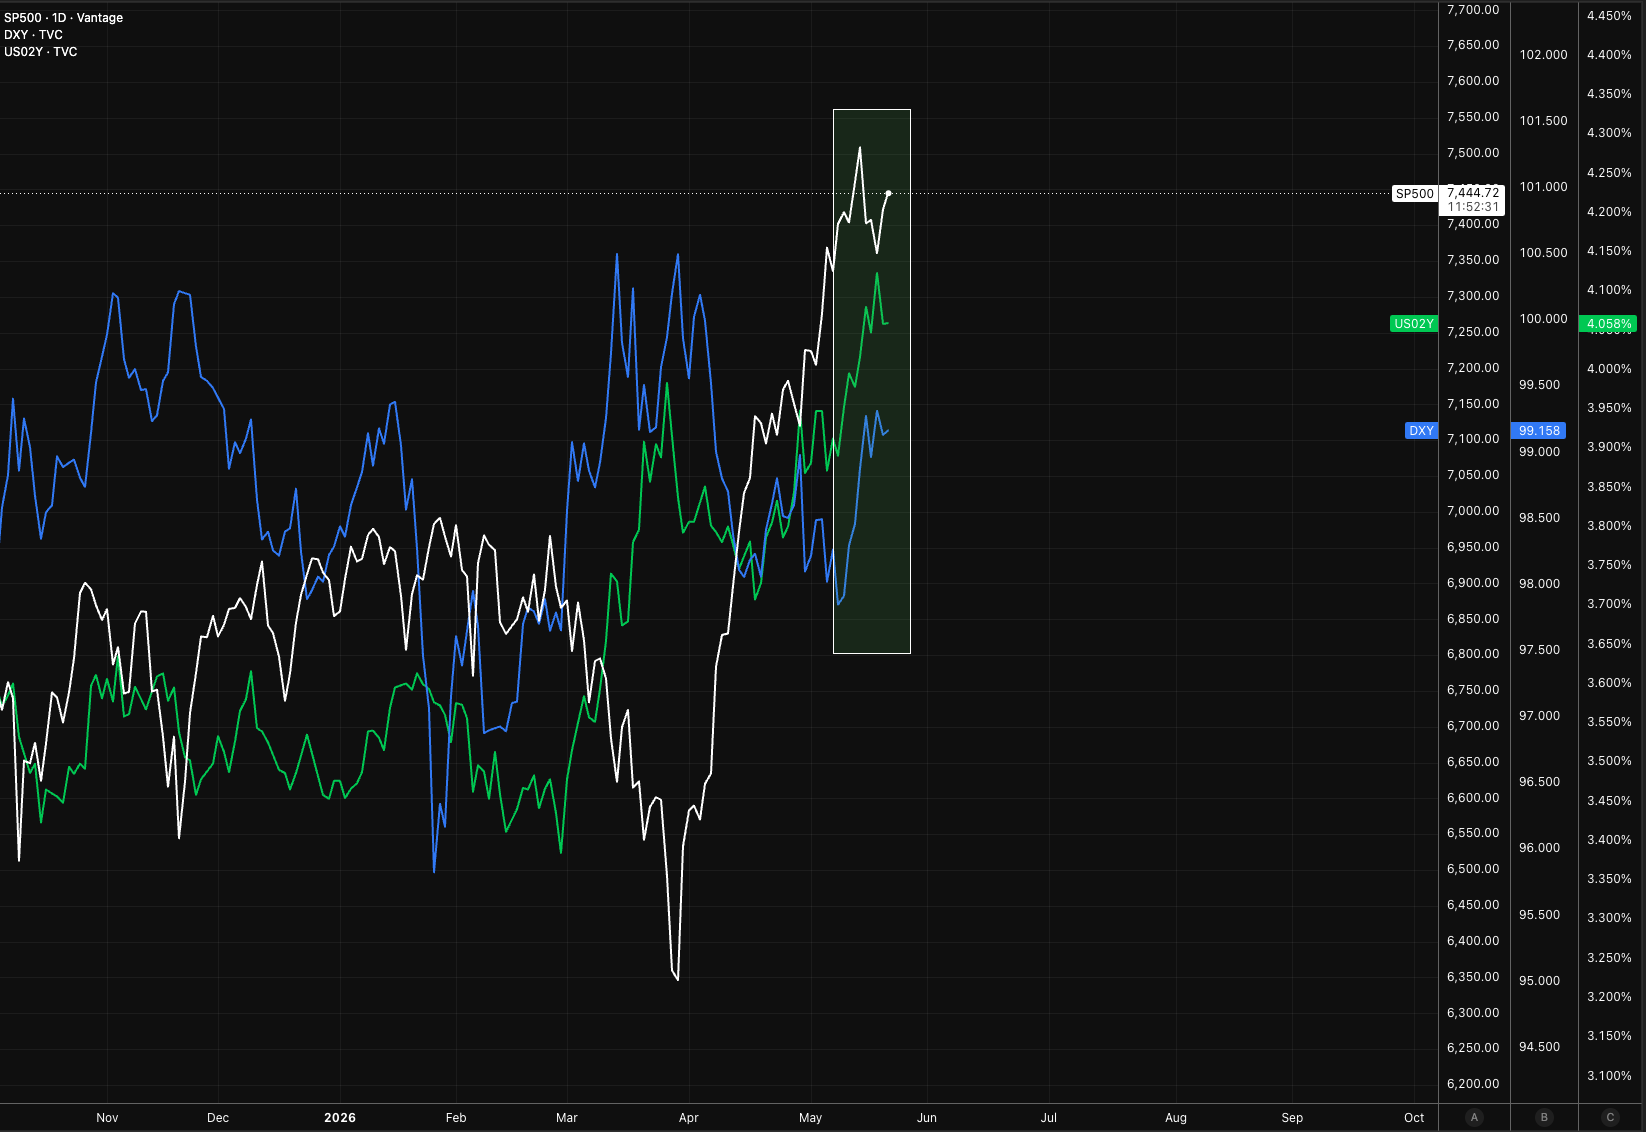
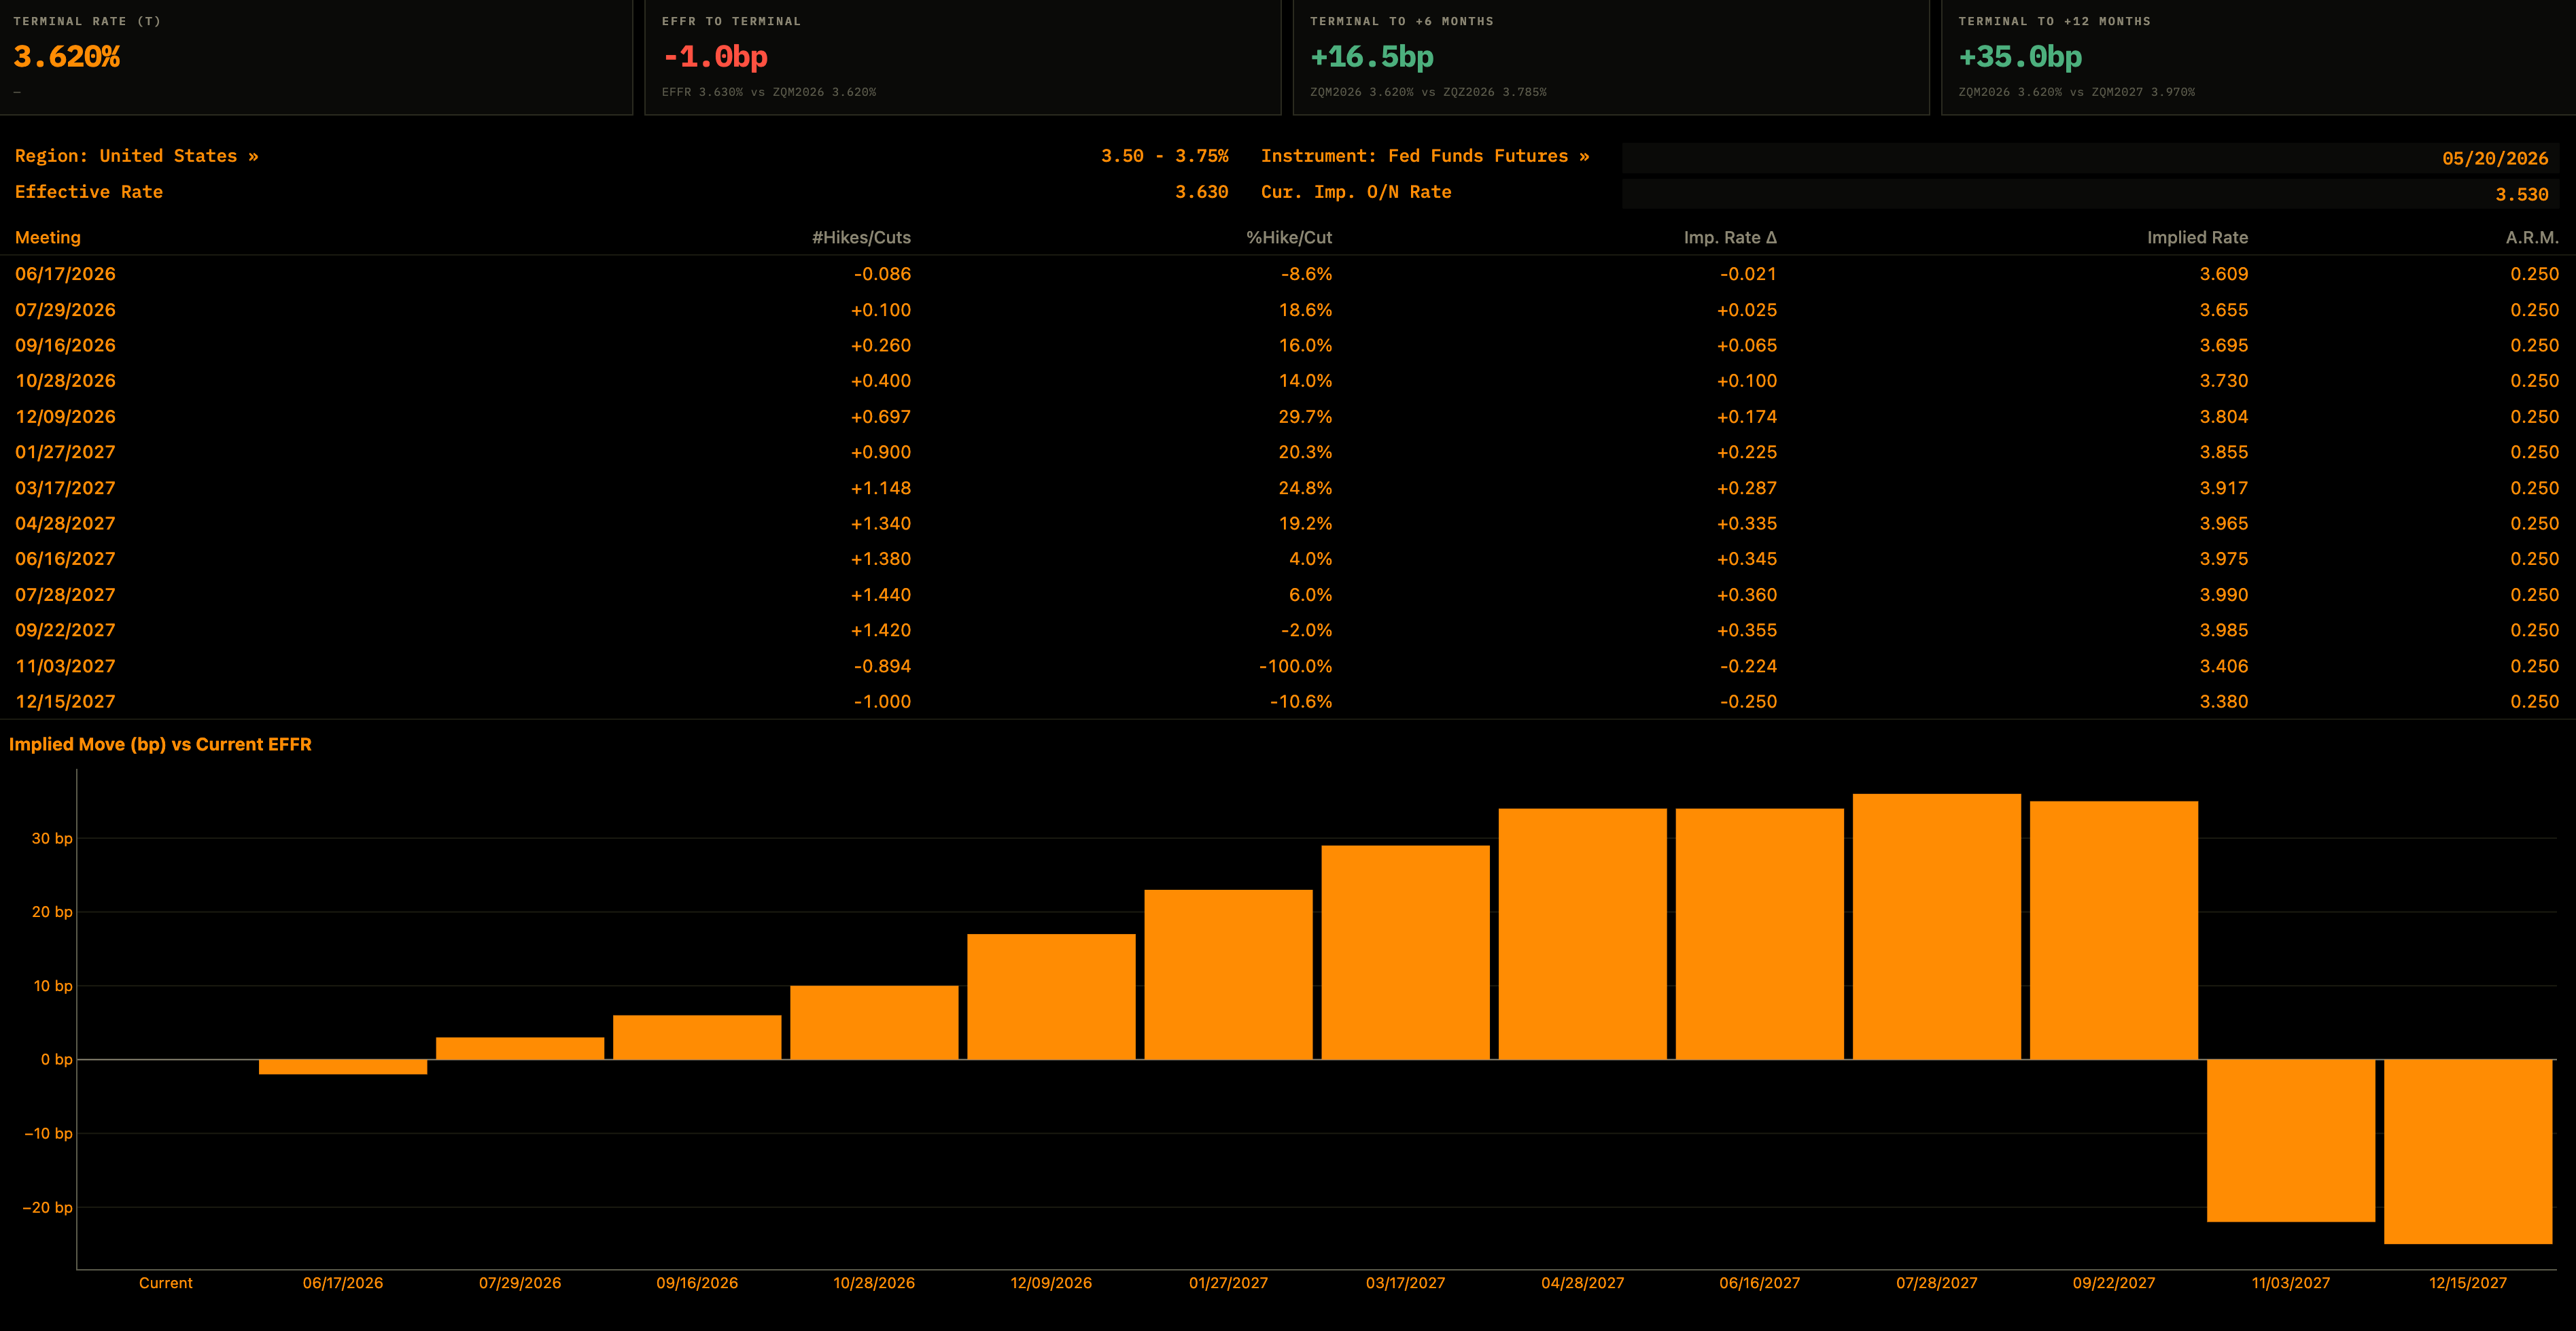
What I’m monitoring is where the terminal rate implied by SOFR strip sits, real 2y yields, rolling 30-day beta of SPY to DXY, and the decomposition of dollar strength into rate-differential versus growth-differential components.
Channel 3: Credit spreads start widening as inflation swaps hold these levels or push higher
This is the chart that carries the entire report. If I had to pick a single image to communicate why I’m still bullish (and why credit risk is so low), look at how credit spreads are still at cycle lows EVEN as breakevens hold a higher range.
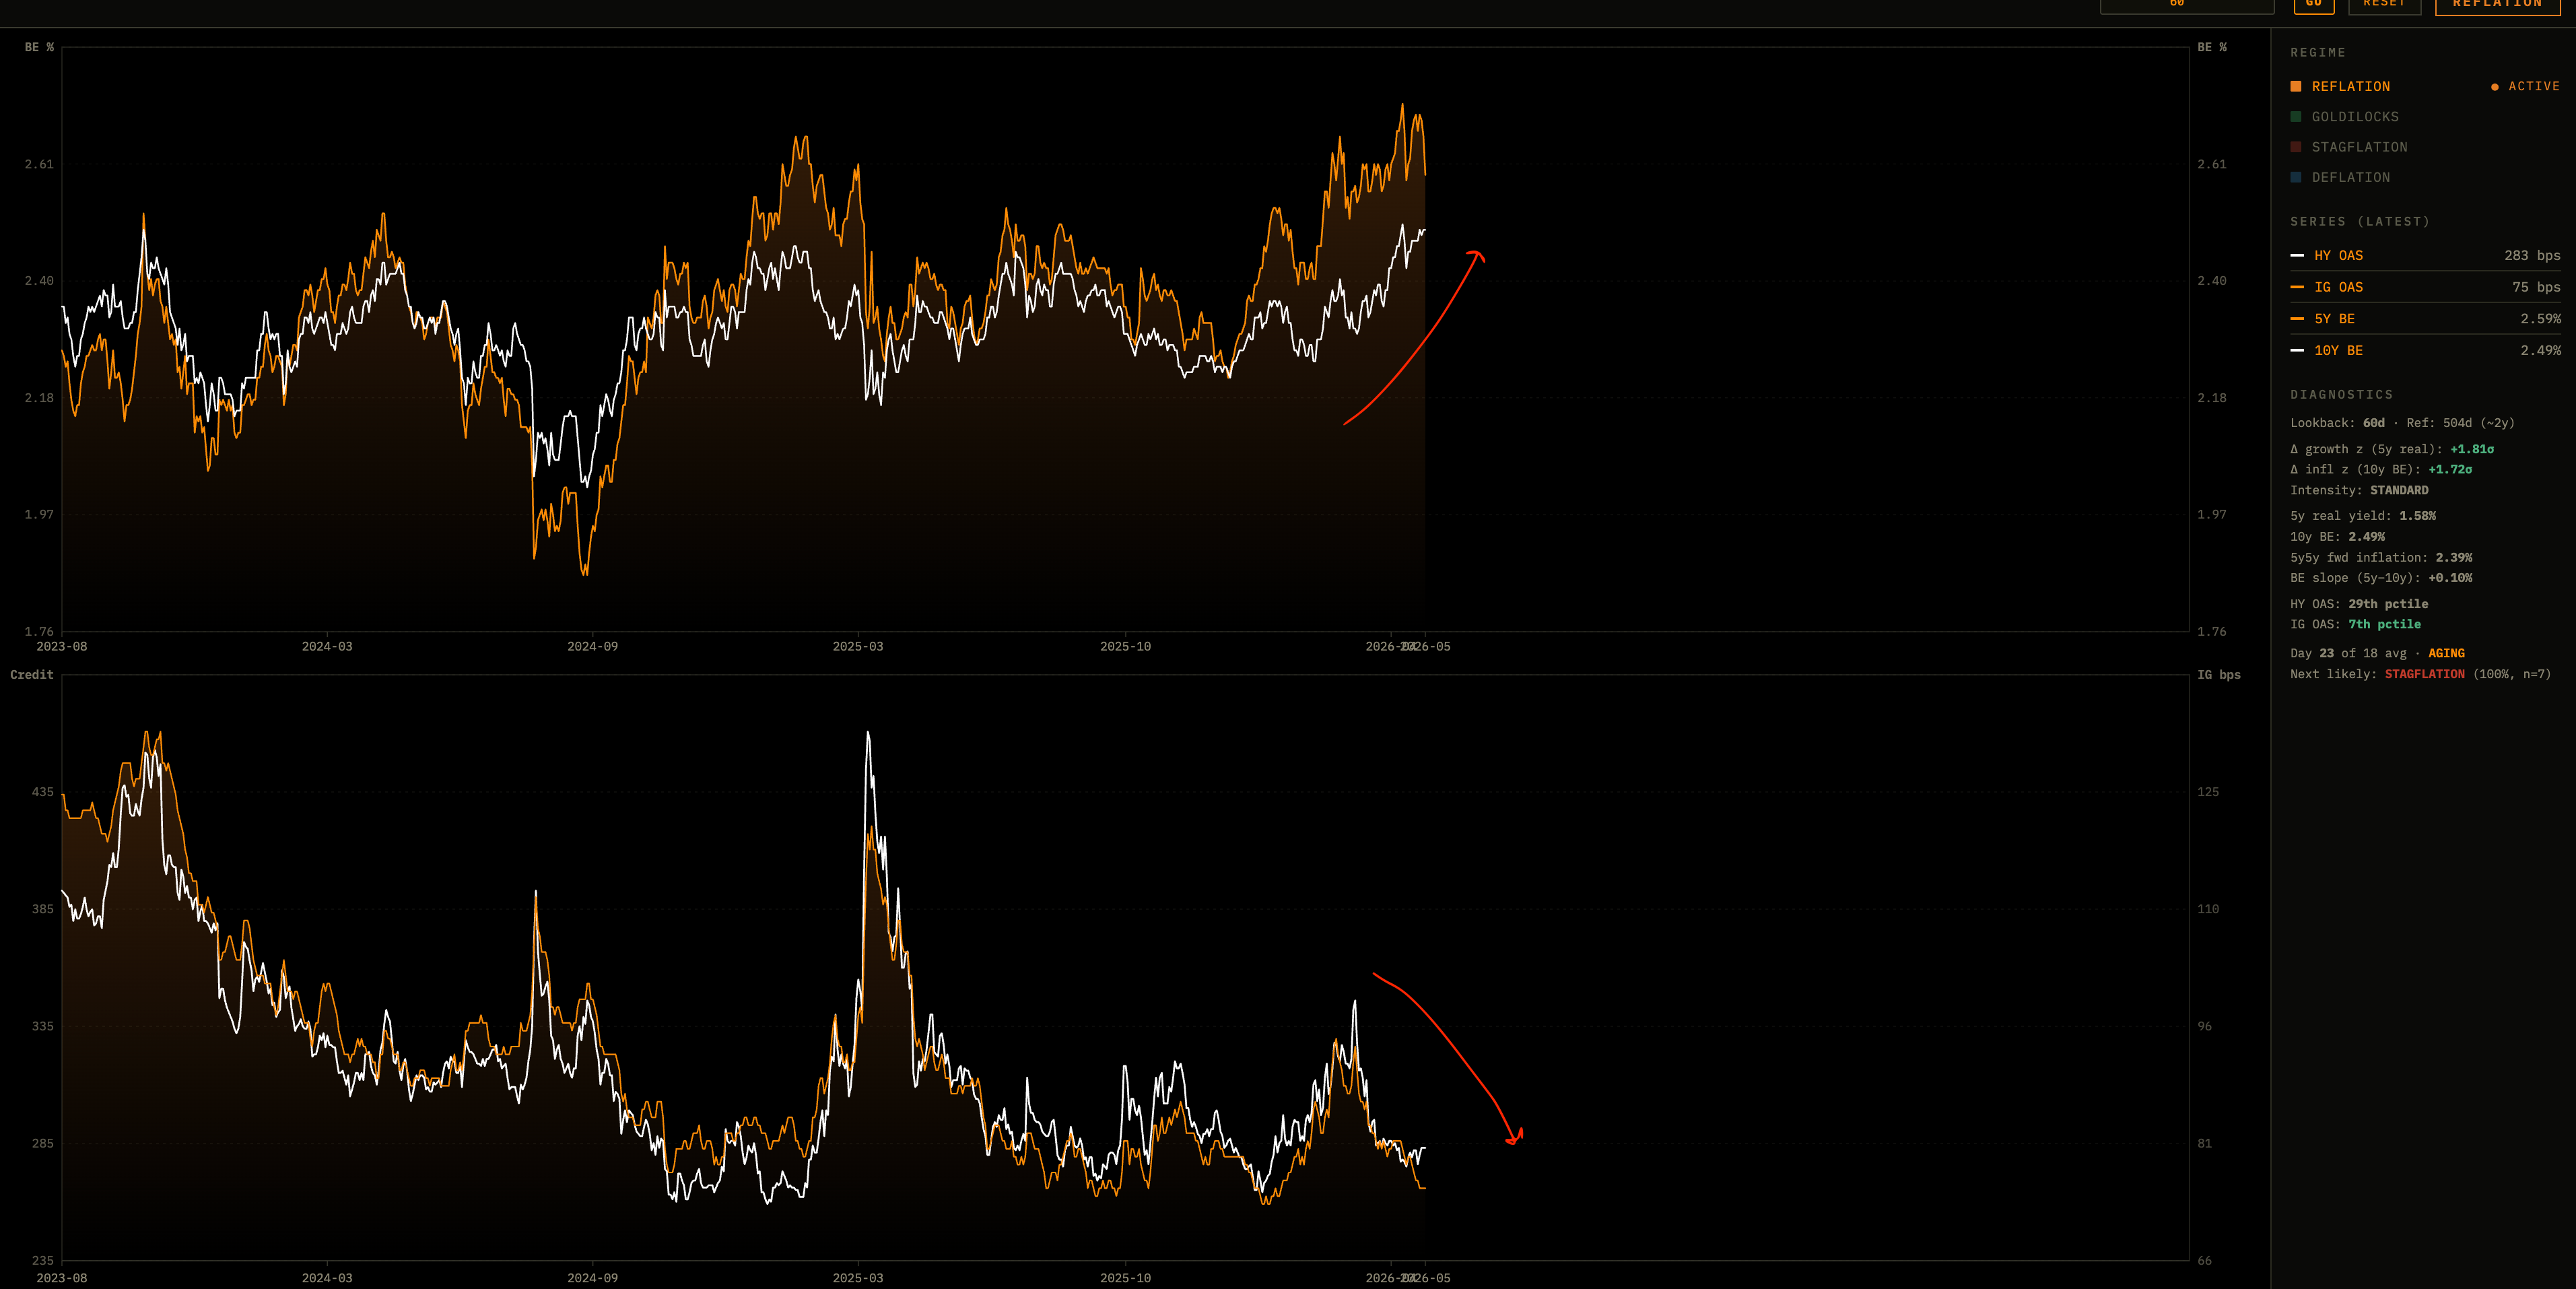
Here’s why this matters so much. Credit is the cleanest read on whether the market thinks elevated inflation is a growth problem. When breakevens push higher and credit shrugs, the market is literally saying that inflation is a problem for bondholders who are getting their fixed coupons inflated away, but it is not a problem for corporate solvency. Corporates can pass through, refinancing windows are open and balance sheets are intact. Duration risk, not credit risk.
When breakevens push higher and credit also widens, that’s the regime change. That’s the market now saying that inflation is sticky enough that the Fed will have to engineer a slowdown to break it, and that slowdown will hit corporate cash flows, defaults will rise, and the spreads need to compensate for that. That’s when you get the genuine equity drawdown because the credit signal precedes the equity signal almost every time. Credit ALWAYS knows first.
Right now, HY and IG spreads are tight. The combination of firm breakevens and tight spreads is EVIDENTLY a duration story. It’s the cross-asset market telling you (with very high information content) that this inflation print is being absorbed by the curve, not by credit.
There’s a nuance worth flagging here. The credit signal works best when you look at the change in spreads relative to the change in breakevens. If breakevens are up 20bp and HY is up 5bp, that’s a duration story. If breakevens are up 20bp and HY is up 50bp, then you can start saying it’s a credit story. The ratio matters more than the level because spreads can be tight in absolute terms but widening at the margin (and the margin is what flags the regime shift).
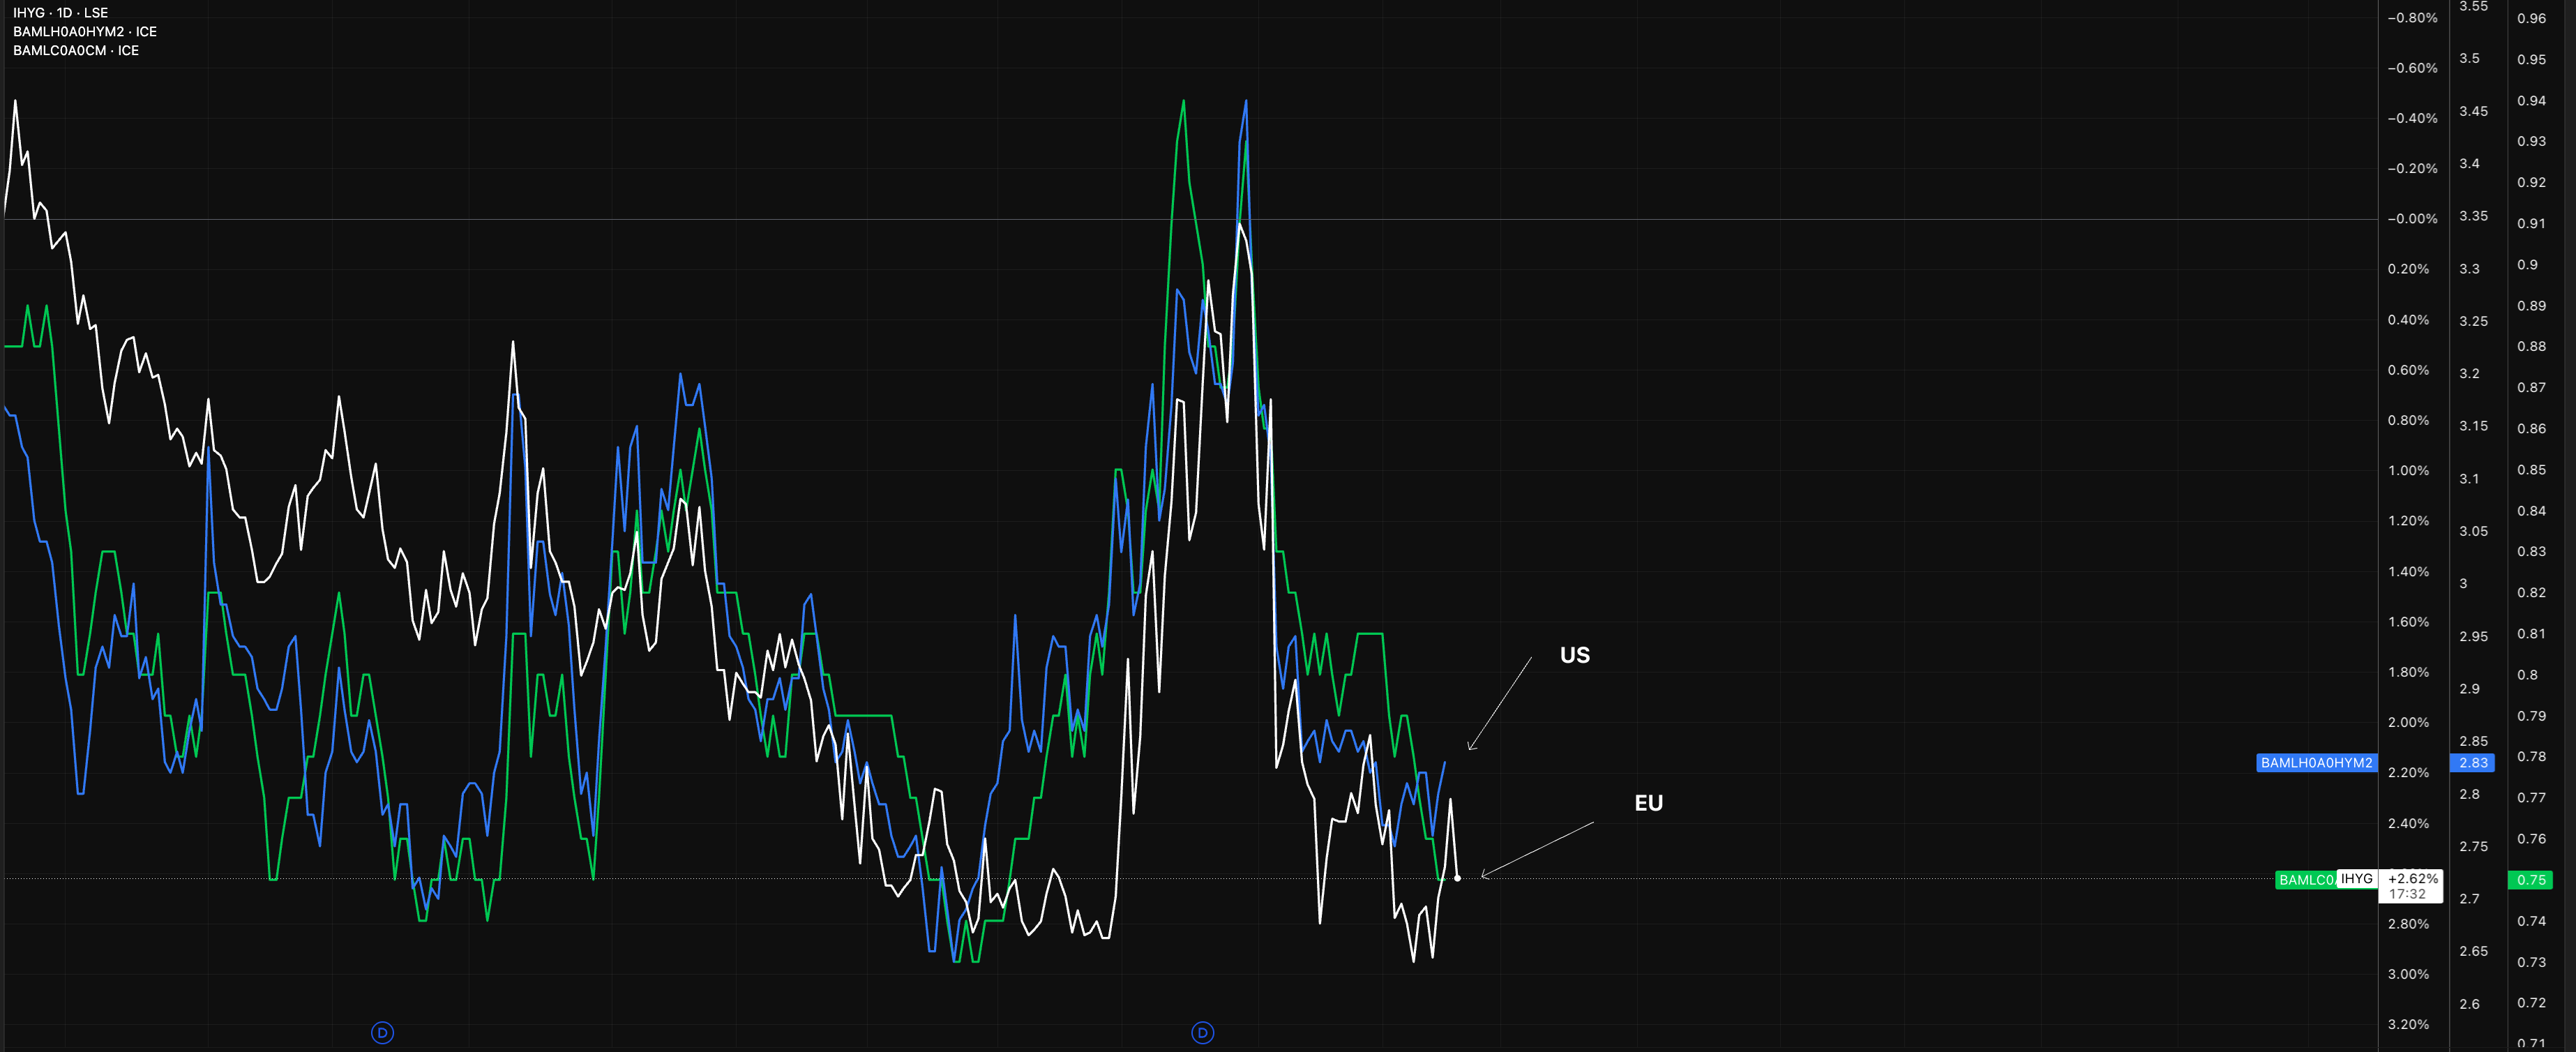
The other place to watch is the cross-currency credit signal. European IG and HY should be moving roughly in line with the US analogs. If you start seeing dispersion (US credit calm but European credit widening, or vice versa), that flags a region-specific issue rather than a systemic credit deterioration, and the equity read becomes more nuanced. Right now, the cross-Atlantic credit signal is broadly aligned and broadly calm.
Channel 4: Equities start underperforming on solid growth data, the negativity sensitivity flip
This is the most subtle of the four channels and the most regime-defining, but I’d actually say it’s also the hardest to see in real time because it requires you to watch the reaction function of equities to incoming data rather than just the data itself.
So in a goldilocks backdrop, strong growth data is bought. Why? Because strong growth implies strong earnings, the Fed is on a path that’s already priced, and the marginal new data point about growth is good news for the cash flows that equities are valuing. The equity beta to positive growth surprises is positive.
In an inflation fear backdrop, the reaction function inverts. Strong growth data is sold. Why? Because strong growth implies sticky inflation, which implies the Fed has more work to do, which implies higher rates for longer, which compresses the multiple faster than the cash flows can grow. Good news becomes bad news. Equity beta to positive growth surprises flips negative.
In this backdrop, you’d see strong growth data be broken in asset markets. For example, if we have strong NFP, the low of that day will struggle ot hold.
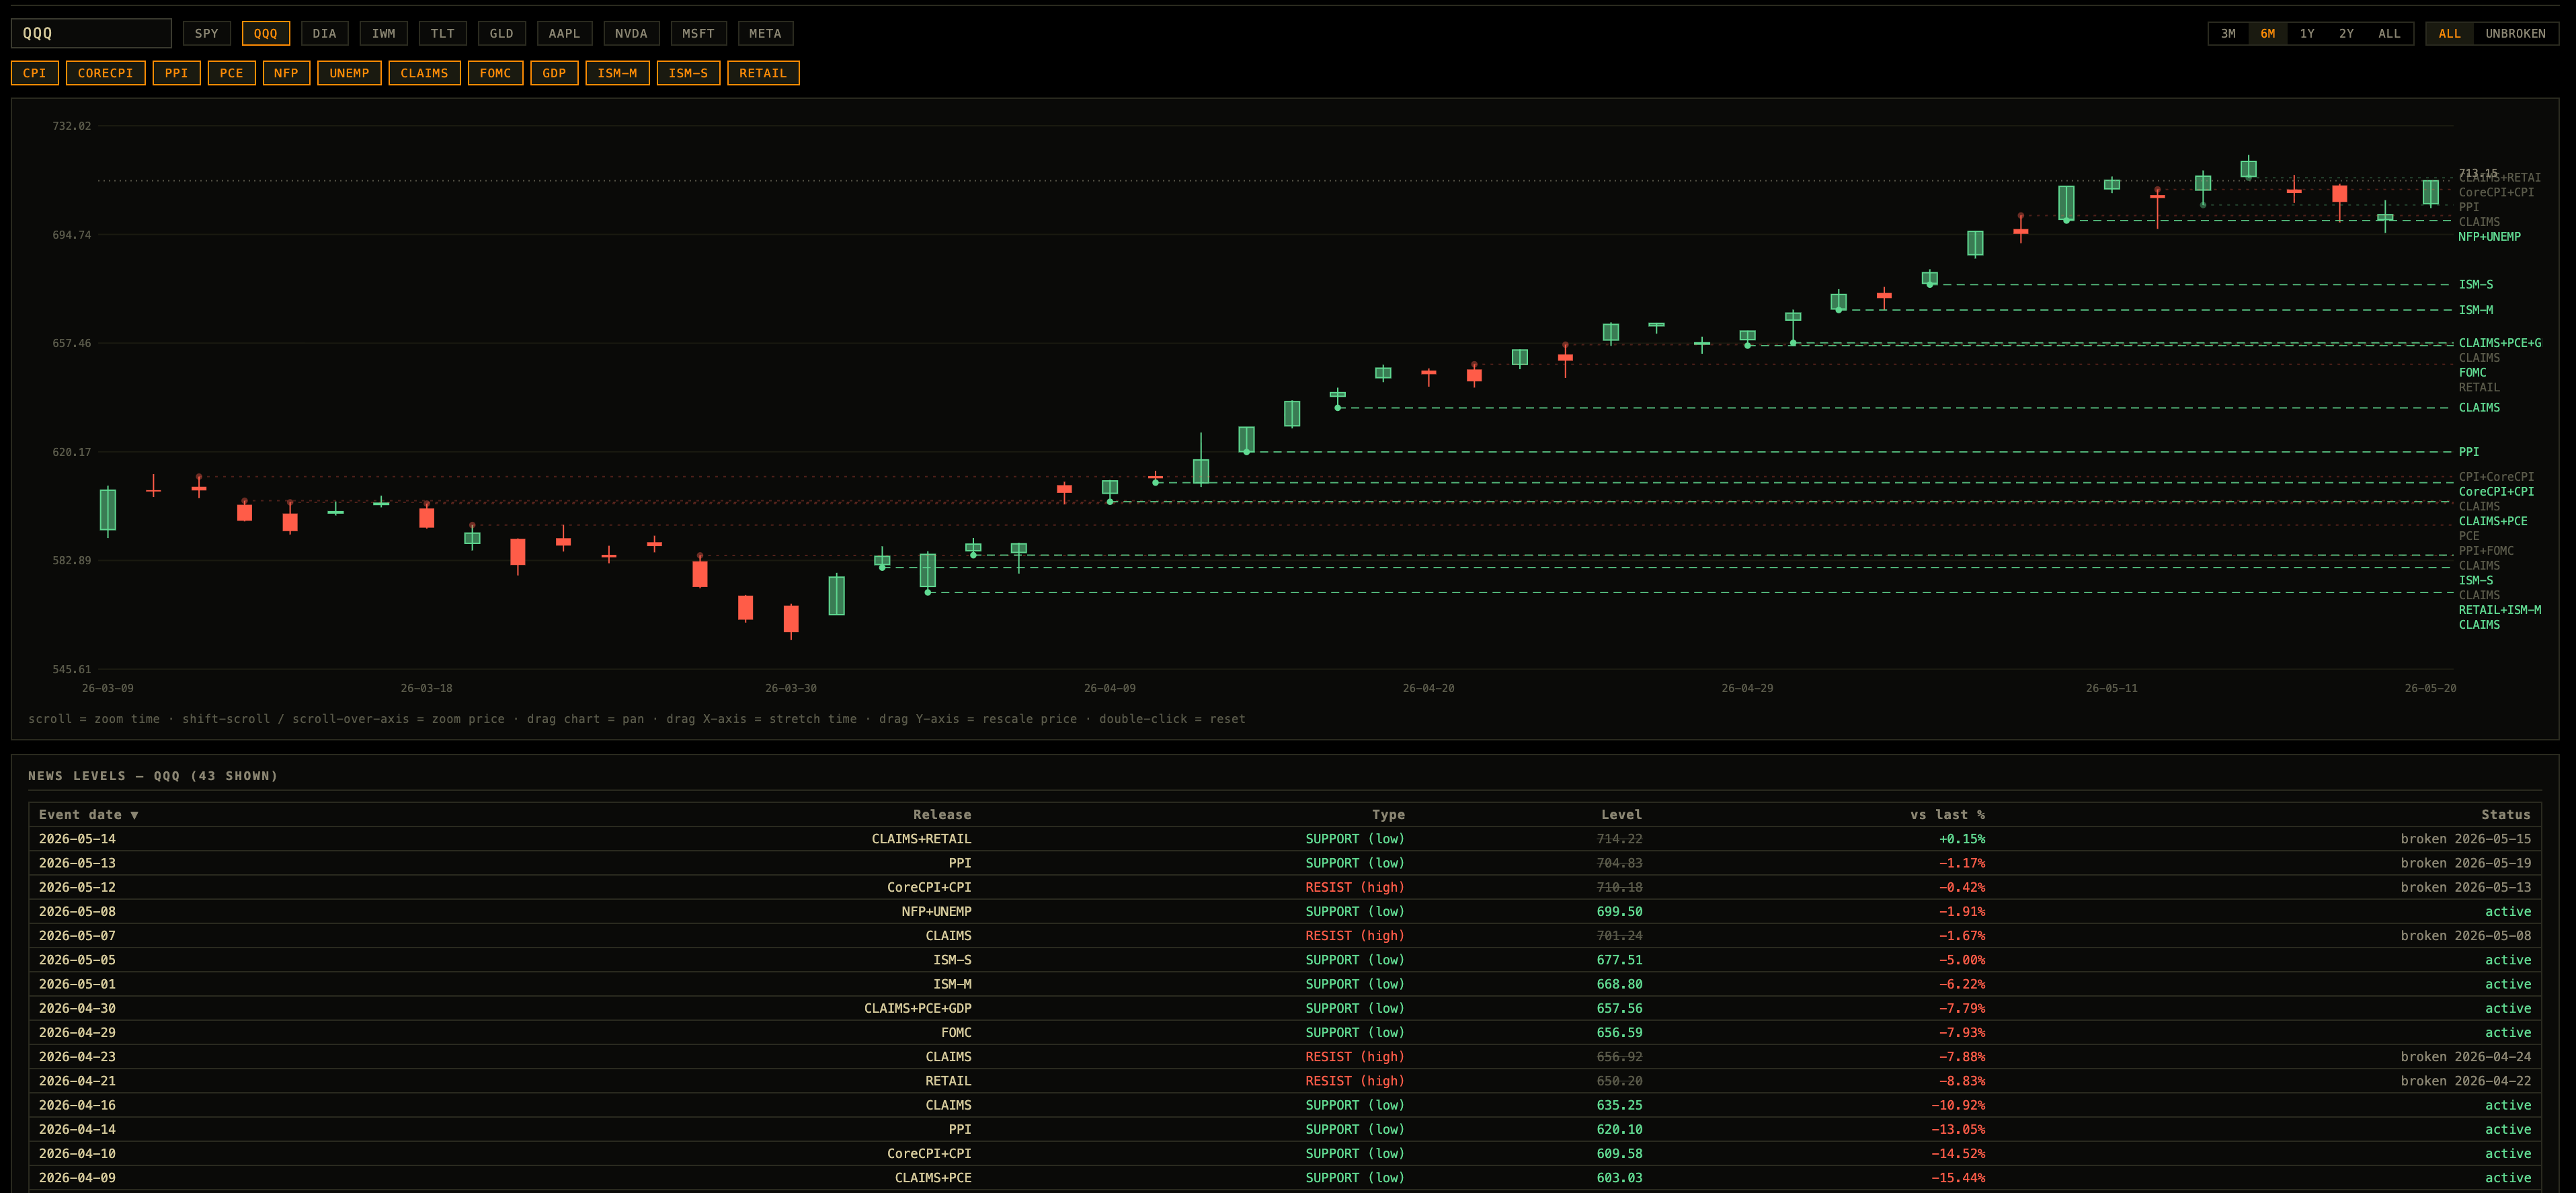
This flip is the cleanest regime-definition signal in the ENTIRE cross-asset toolkit because it is internal to the equity market itself. You don’t need to look at credit, you don’t need to look at the dollar, you don’t need to look at the curve. You just need to look at how SPY responds to NFP, to ISM, to retail sales, to CPI itself. If hot data lifts equities, it is a growth-positive regime. If hot data drags equities, the regime has flipped.
Right now, we’re broadly still in the growth-positive reaction function. The reactions have been noisy, individual prints have been mixed, but the pattern has not yet shifted to consistent “good news is bad news” trading. Until that pattern shifts, the regime is intact.
A caveat worth noting is that this signal works best when you separate growth surprises from inflation surprises. The reaction function to growth surprises tells you about the regime. The reaction function to inflation surprises is more mechanical (hot CPI almost always drags equities in the moment, regardless of regime, because it forces an immediate repricing). So the diagnostic is specifically about growth data (NFP, ISM, retail sales, GDP) rather than inflation data (CPI, PCE, PPI).
Vol regime confirmation: MOVE doing the work, VIX calm
A useful cross-asset diagnostic that doesn’t fit cleanly into the four boxes but supports the entire thesis: the MOVE-VIX divergence.
Rates vol is elevated because the rates market is genuinely uncertain about the forward path. Equity vol is contained because earnings are landing, growth is tracking, credit is tight, and the cross-asset stack is voting growth positive. When MOVE is doing all the work and VIX is calm, that’s the textbook signature of a duration repricing inside an intact growth regime.
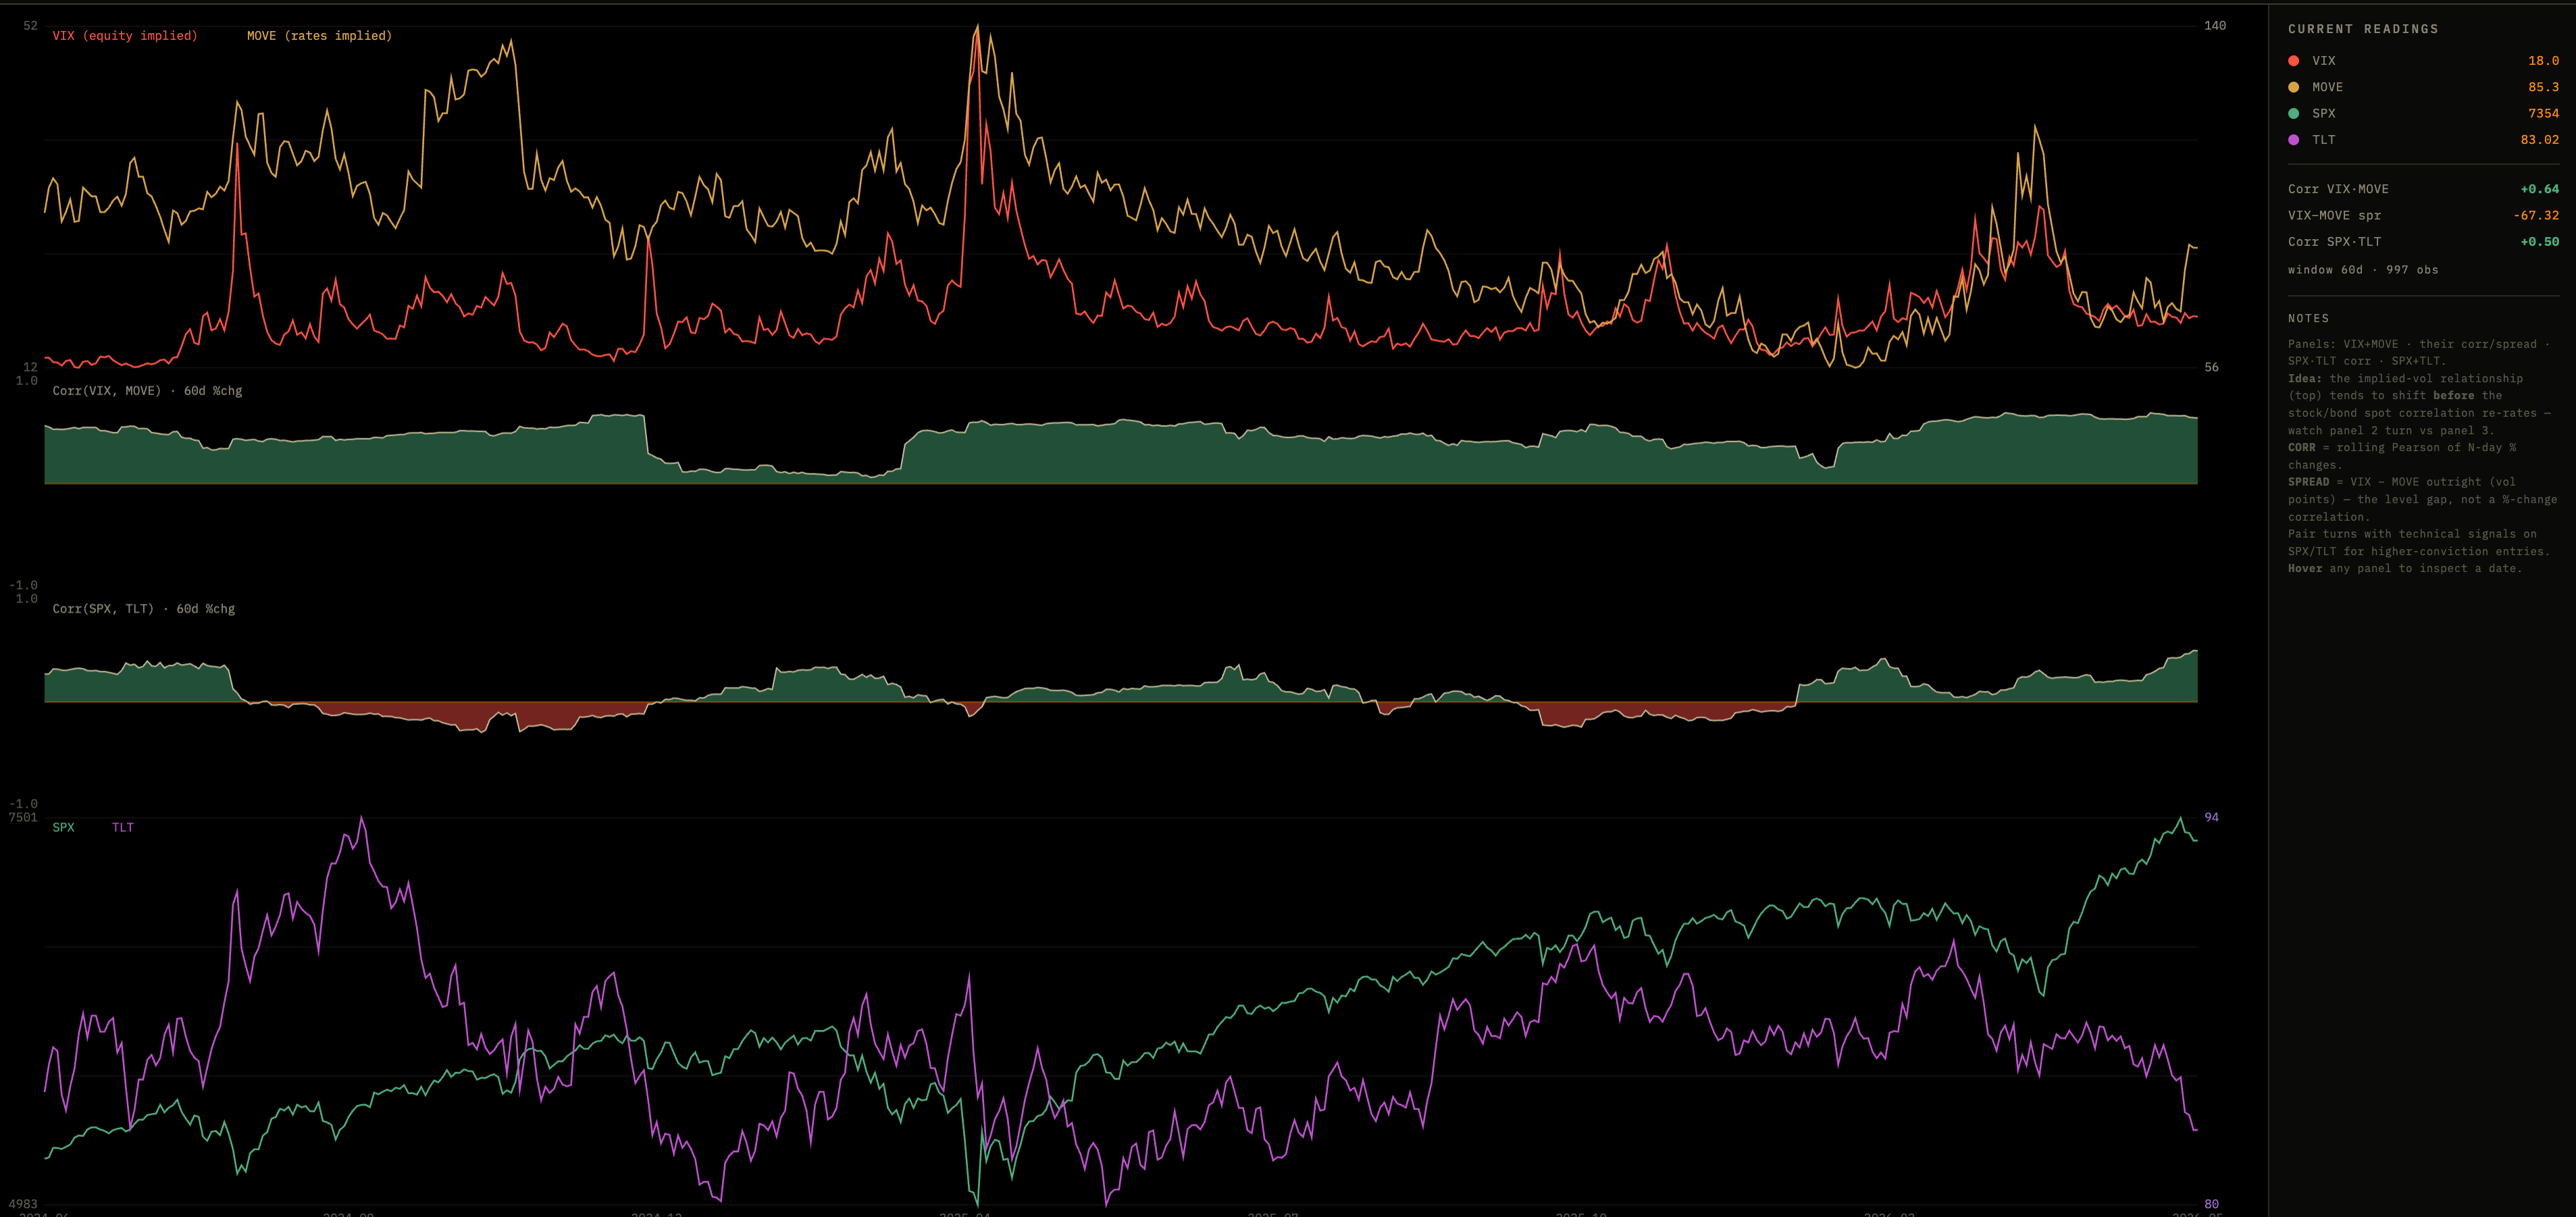
Historically (sorry to be that guy again…), sustained equity drawdowns have been preceded by VIX climbing while MOVE was already elevated, the equity market joining the rates market in pricing risk. The reverse pattern (MOVE up and VIX calm) has typically been a buying setup once the rates volatility burns off.
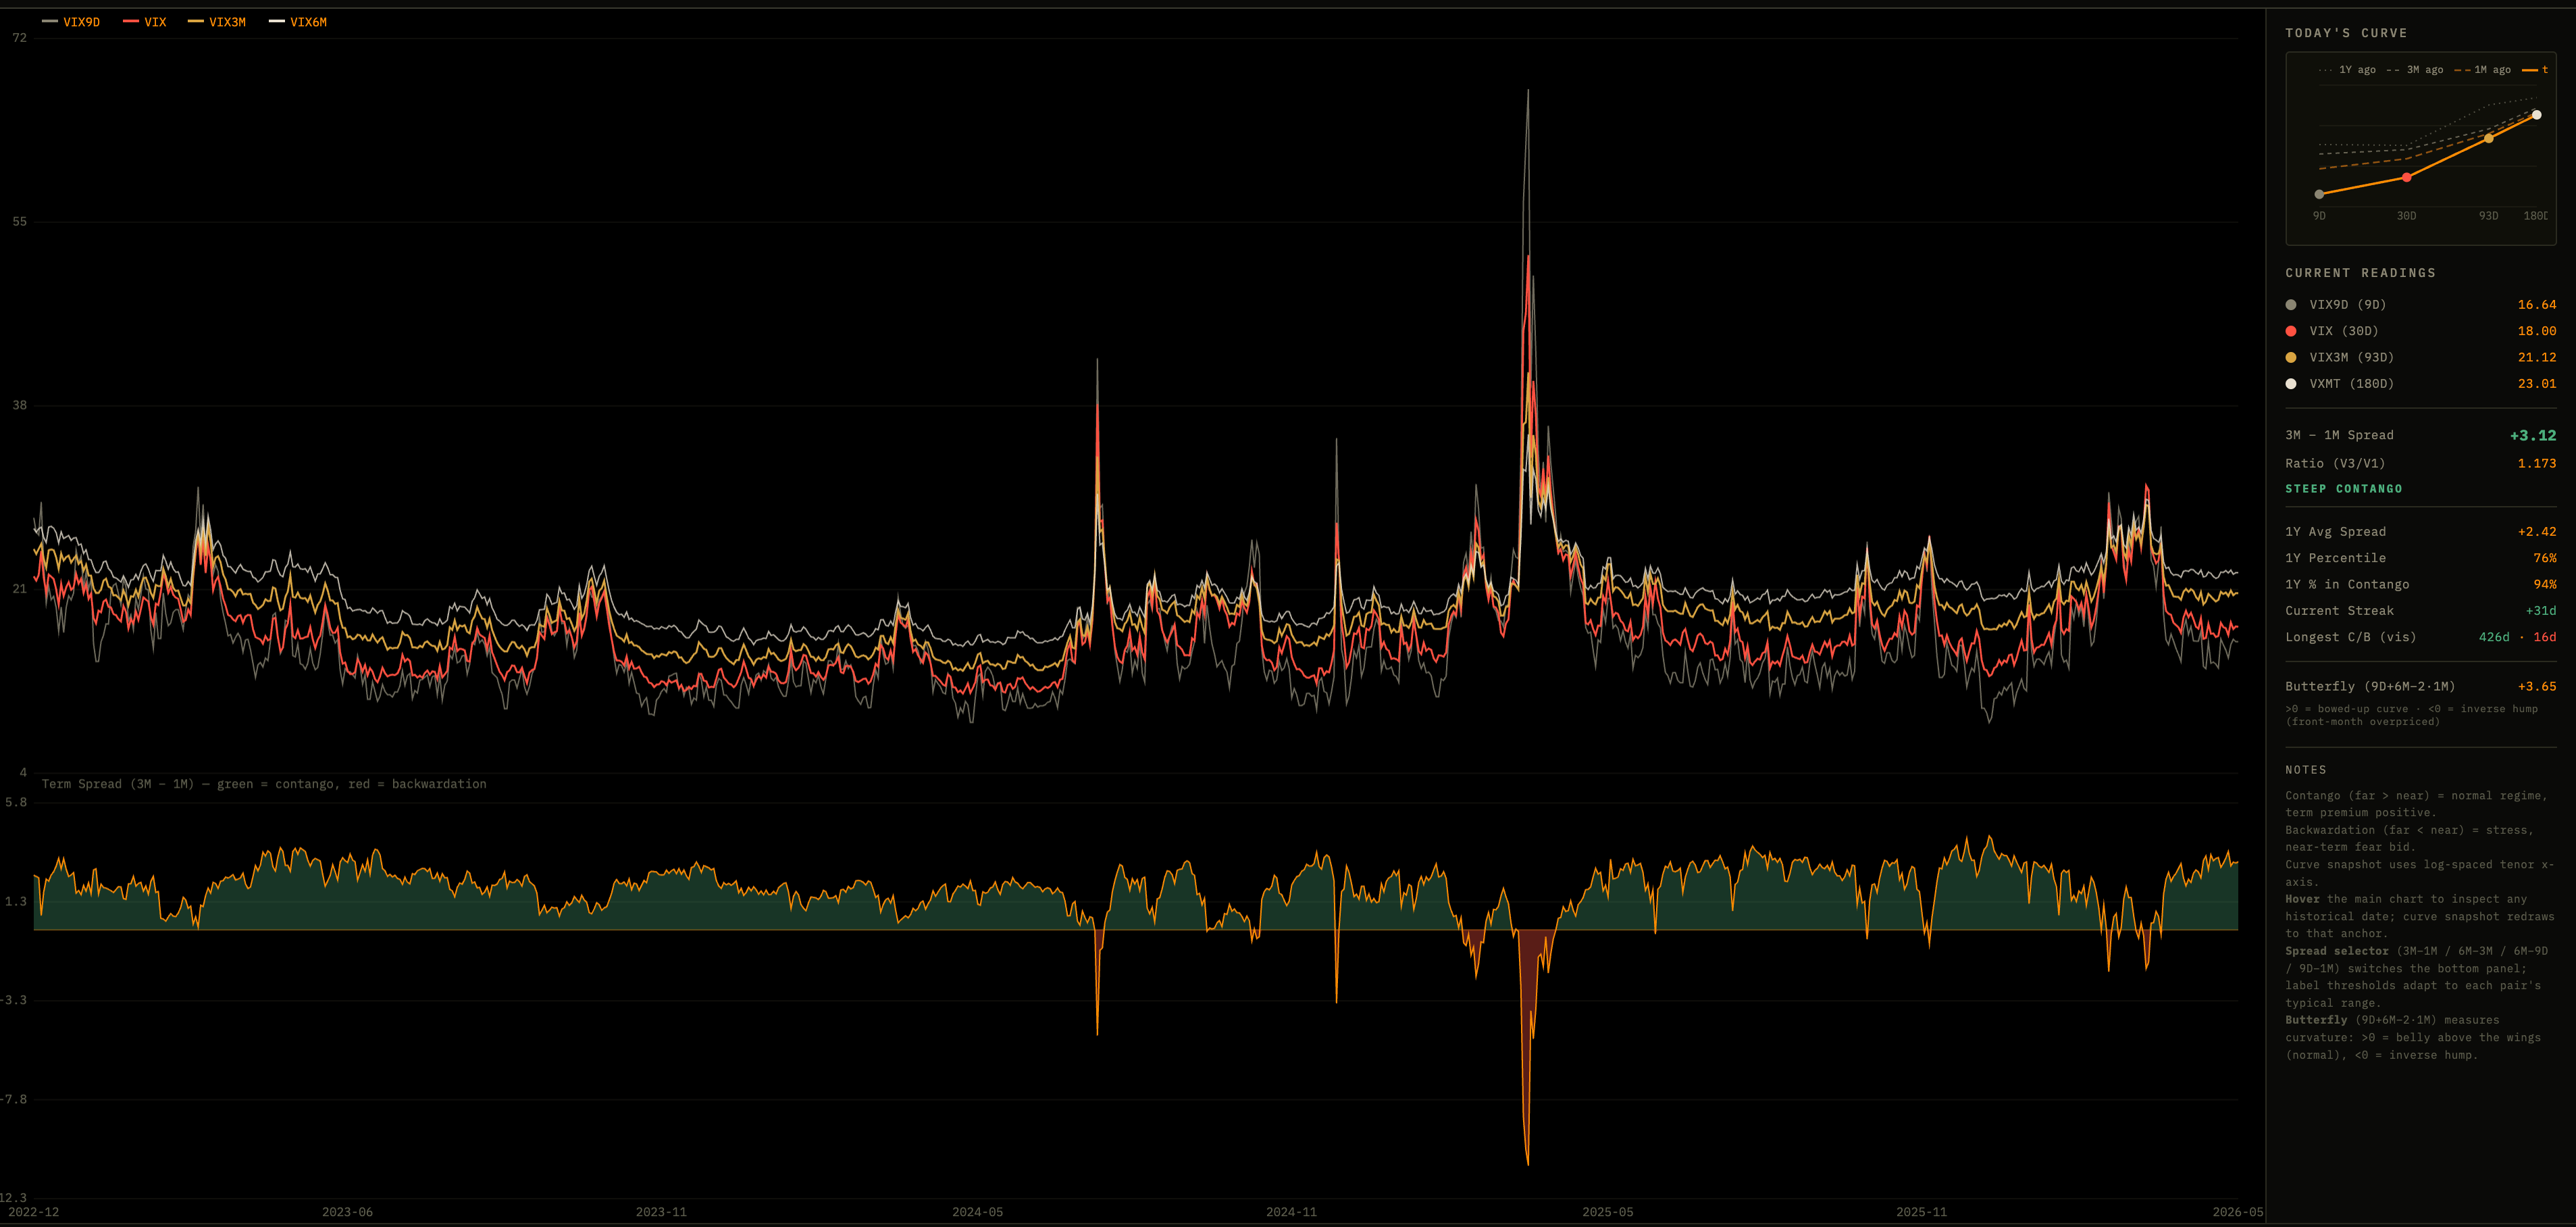
What I’m monitoring is the MOVE-VIX ratio and its z-score, the term structure of both, and any signs of VIX backwardation that would suggest the equity market is starting to price genuine tail risk.
What I’d need to see to flip
I want to be explicit about the exit plan rather than just stacking bullish points. Here’s the framework for when I actually change my mind.
If HY OAS widens through recent ranges while breakevens stay bid or push higher, the duration vs credit thesis breaks and I’d cut risk meaningfully. This is the HIGHEST priority signal because credit always knows first (in my view).
If the SOFR strip prices in a materially higher terminal rate over a compressed timeline, and DXY breaks higher with the rolling SPY-DXY beta turning persistently negative, I’d cut risk. The combination matters: a higher dollar without an equity correlation flip is just dollar strength. A higher dollar with the correlation flipping negative is the rates channel actively doing damage.
If earnings revisions roll over broadly in a way that’s not explainable by sector idiosyncrasy, and forward EPS trajectory bends down rather than flatlines or drifts up, I’d cut risk. This is the slowest signal but the most definitive.
If equity beta to growth surprises flips negative, meaning hot growth data starts dragging equities rather than lifting them, I’d cut risk fast. This is the regime-flip signal and it tends to move quickly once it starts.
If MOVE-VIX dynamics shift to VIX leading MOVE higher, equity vol starting to price tail risk independent of rates vol, that’s the equity market joining the bears, and I’d respect that signal.
None of these are firing right now. Not one. The cross-asset tape is unambiguous on this point.
How I’m positioning
Bullish equities, with appropriate respect for the volatility the rates side is generating. I still believe in my DAX thesis, although this report is US-centric.
I’m not adding aggressively into strength here, because the rates side genuinely needs to sort itself out and a hot print can absolutely produce a 3-5% wobble that’s uncomfortable to sit through if you’re maxed out on equity beta. The chop is real and the rates vol is going to keep generating equity vol until the curve stabilizes.
I’m also not trimming, because the conditions that would justify trimming, the four boxes laid out above, are not ticked. Trimming on rates vol alone is fading the regime, and the regime says growth is fine.
The positioning that makes sense to me right now is to stay long equity beta, but lean into the parts of the market that benefit from the duration story rather than getting hurt by it. Quality over junk, where junk is most exposed to refinancing risk if rates stay elevated. Cash-generative businesses over long-duration growth. Sectors with pricing power over those with margin squeeze risk. And keep some dry powder for a deeper wobble that might come if condition 2 starts to fire harder.
The thing to avoid here is the same thing to avoid in every cycle, confusing a vol event with a regime change. Higher inflation prints generate volatility. Regime changes require credit, the dollar, equity sensitivity, and earnings to all rotate together. We have one of those rotating with any conviction, the rates channel, and even that one hasn’t broken through into equity-dragging dollar strength yet.
The regime is intact until proven otherwise, and right now nothing is proving otherwise.
Thanks
Alfie
Very good piece!
Good read mate