
The Oil Shock, Rates, and the Recession Call (Part 1)
Why the data and price action are NOT signalling a global recession

The recession call is back, louder than it has been all year. This time it comes with Oil above $100, the ECB framing turning hawkish, the BoE still squeezing, and the usual talk about a slowdown into a global downturn.
I want to address this DIRECTLY because the data and the price action are NOT saying what the recession crowd thinks they are saying. If anything, they are saying the opposite in my view.
This is a two part series again!
Part 1 (this piece) lays out why the macro setup is NOT a recession. The curve, the US data, the inflation read, and the 10y decomposition all point the same way. Then I make the case that oil is the single variable doing the heavy lifting on the bearish narrative, and that the base rates and price action on oil are pointing toward normalisation, not extension.
Part 2 (next) takes that setup and turns it into a trade. Specifically, why the DAX is the cleanest expression of the asymmetry, why the ECB OIS curve is the release valve, and why the 2022 to 2024 analogue is the template.
I laid out multiple times over the last few weeks how the DAX has the most upside in my view, I’ve been holding my long positions and will continue to until the macro backdrop says otherwise.
Let’s start with the recession call itself.
The yield curve is bear steepening
The first thing you check in a recession scare is the curve because that usually picks are the backdrop first. Recessions come with bull flatteners and eventual bull steepeners as the front end gets ripped lower on cuts. That is the textbook sequence and it’s what every legitimate recession has looked like.
What is the US 2s10s doing right now? Bear steepening. So is the German curve. So is the UK curve. The long end is repricing HIGHER because the market is pricing higher inflation expectations and a re-acceleration in growth, while the short end stays anchored because central banks are not cutting.
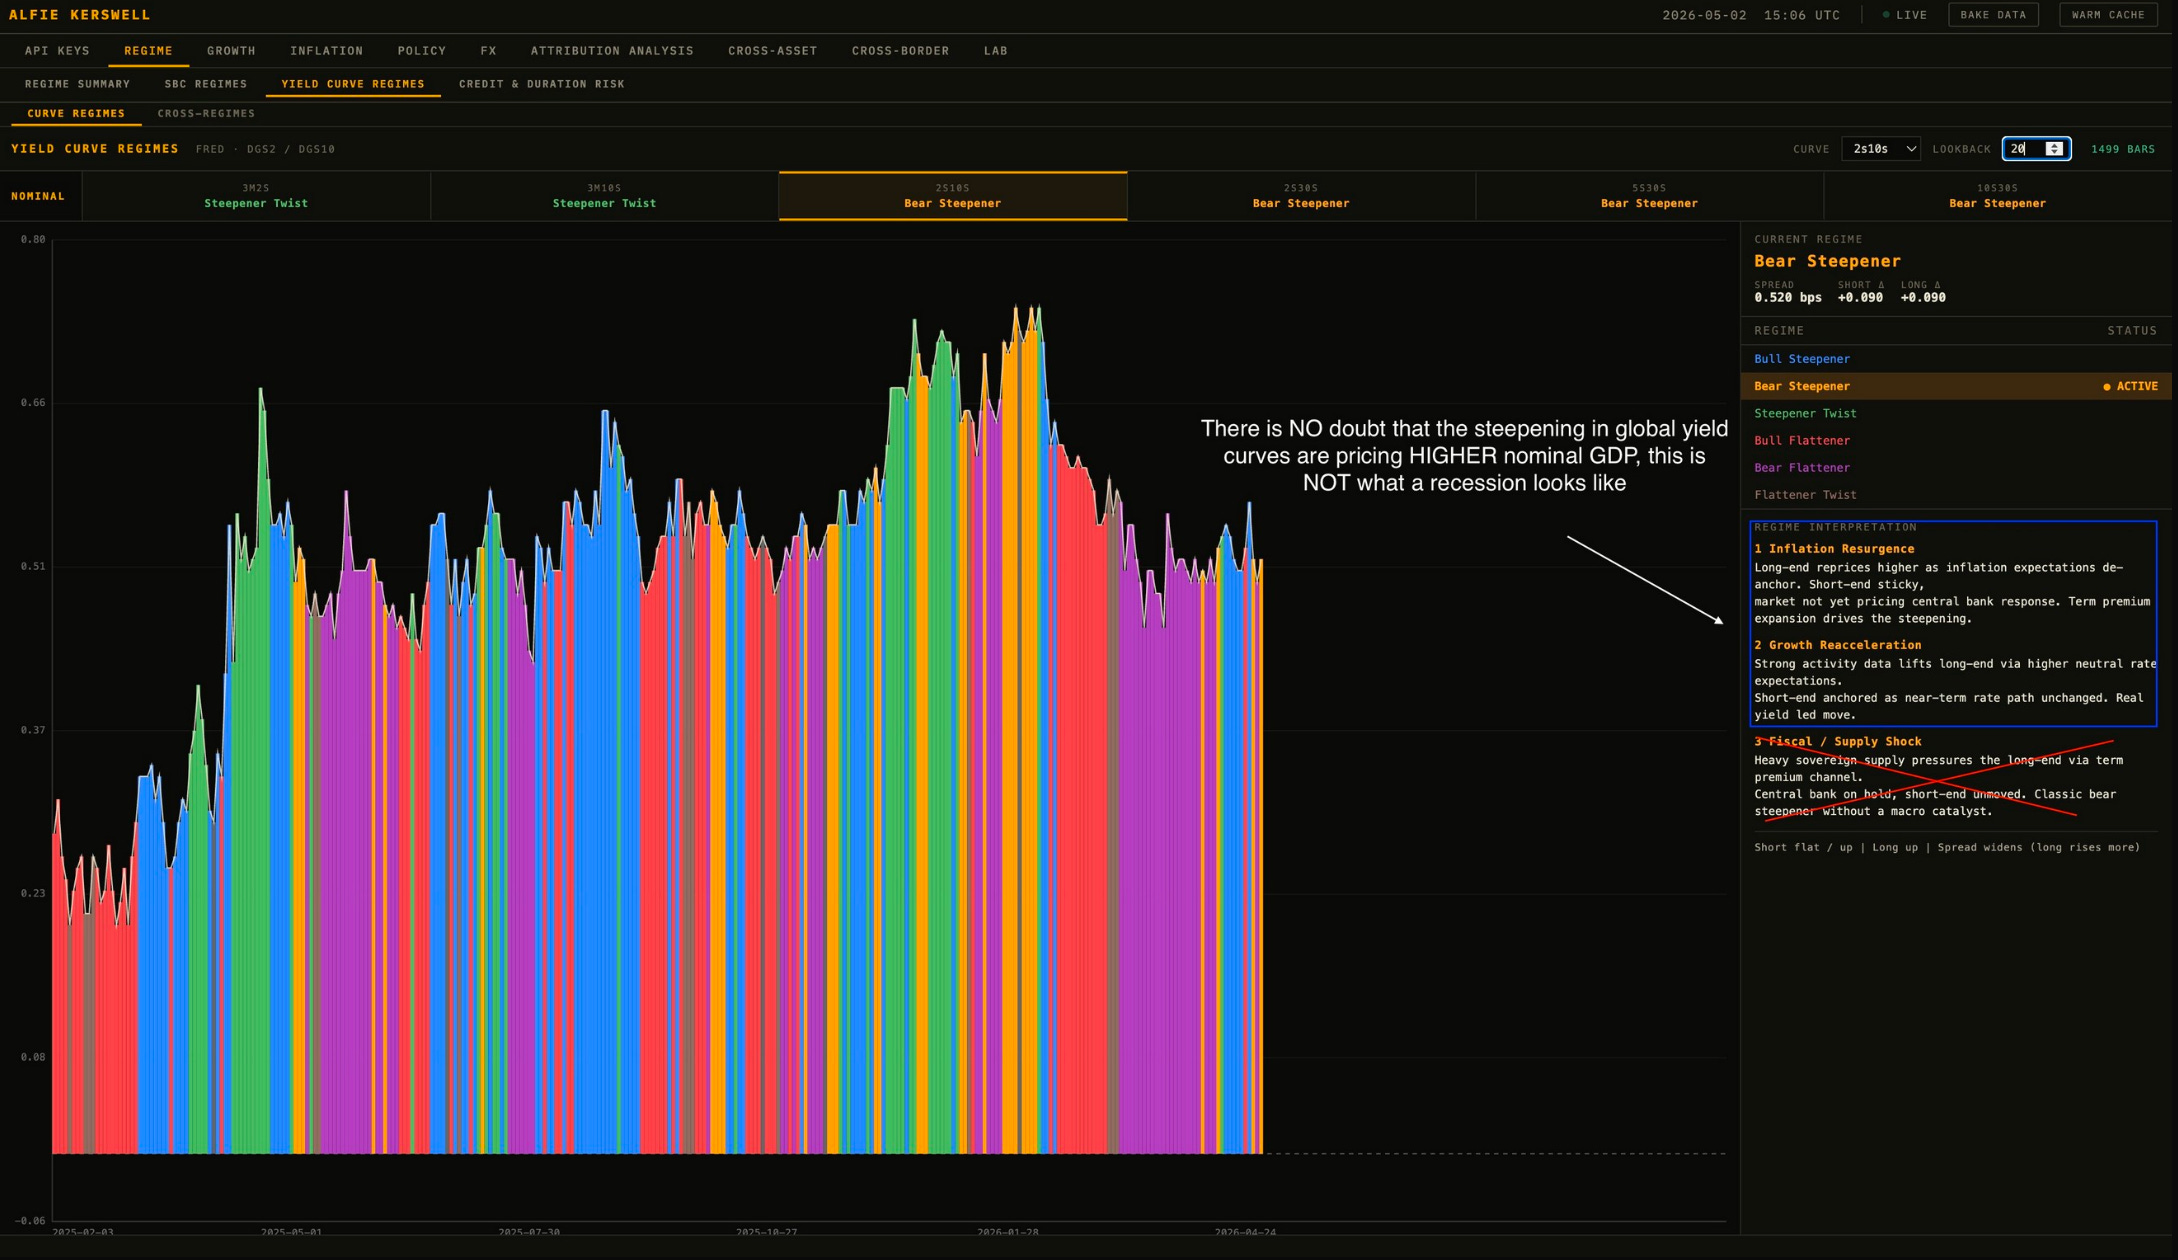
This is the regime that prices HIGHER nominal GDP. It is not the regime that prices a recession. There is genuinely no historical precedent for a global synchronised bear steepener being the leading edge of a global recession. The two things do not happen at the same time.
If your view is that we are heading into a recession, your first job is to explain the curve. I have NOT seen a coherent answer.
US growth data is consistent with expansion
If the US is supposedly the source of this global recession, the data should be flagging it.
GDPNow is tracking 3.52%
Unemployment, NFP, jobless claims, retail sales: all consistent with expansion
Manufacturing PMI back into expansion territory
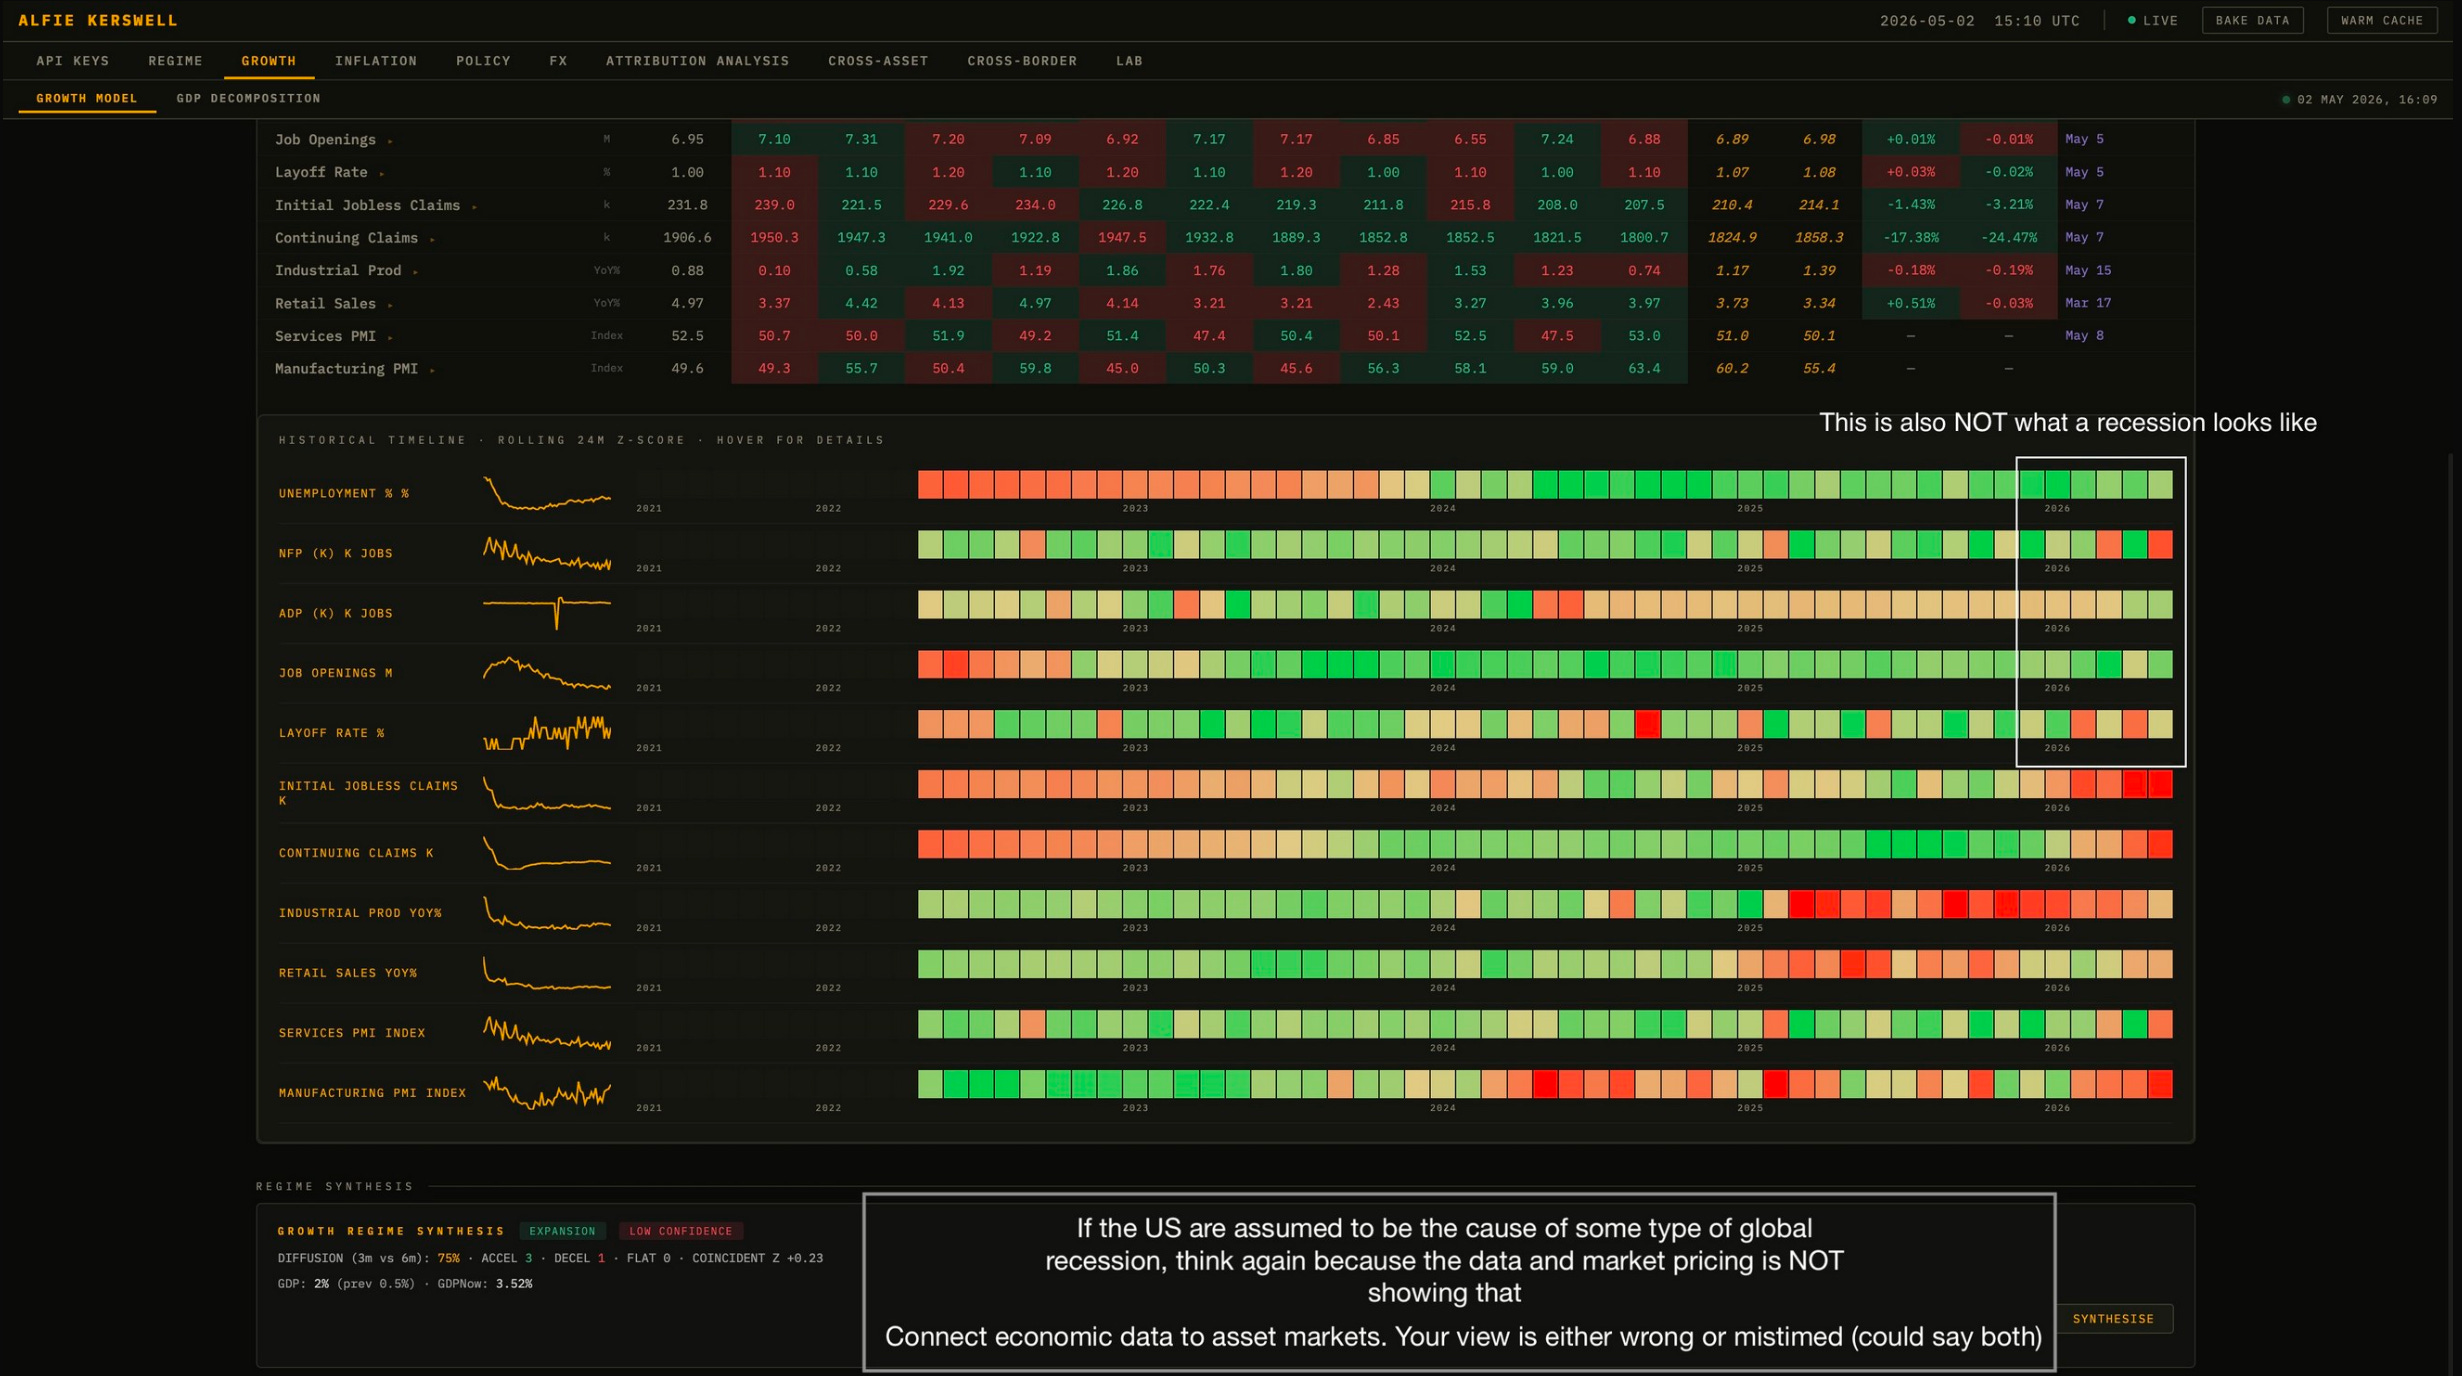
Look at the rolling 24m z-score grid across unemployment, NFP, ADP, job openings, layoffs, jobless claims, continuing claims, industrial production, retail sales, services PMI, and manufacturing PMI. The recent prints are NOT flashing a recession. They are flashing an expansion regime with low confidence on acceleration vs deceleration, but expansion all the same.
If you hold the recession view, your view is either wrong, mistimed (or both). The job of a macro trader is to connect the data to the asset markets. The data and the asset markets are telling you the same story right now.
Headline inflation is priced, so core is what matters
Yes, headline CPI is going to tick higher because of the oil move. Yes, that is going to generate headlines. No, it should NOT move markets, because the market has already discounted it.
Markets price the unknowns. Being shocked that headline CPI ticks higher because oil rallied is like being shocked the Fed cut when the forward curve had a 100% chance priced in. The information value is zero.
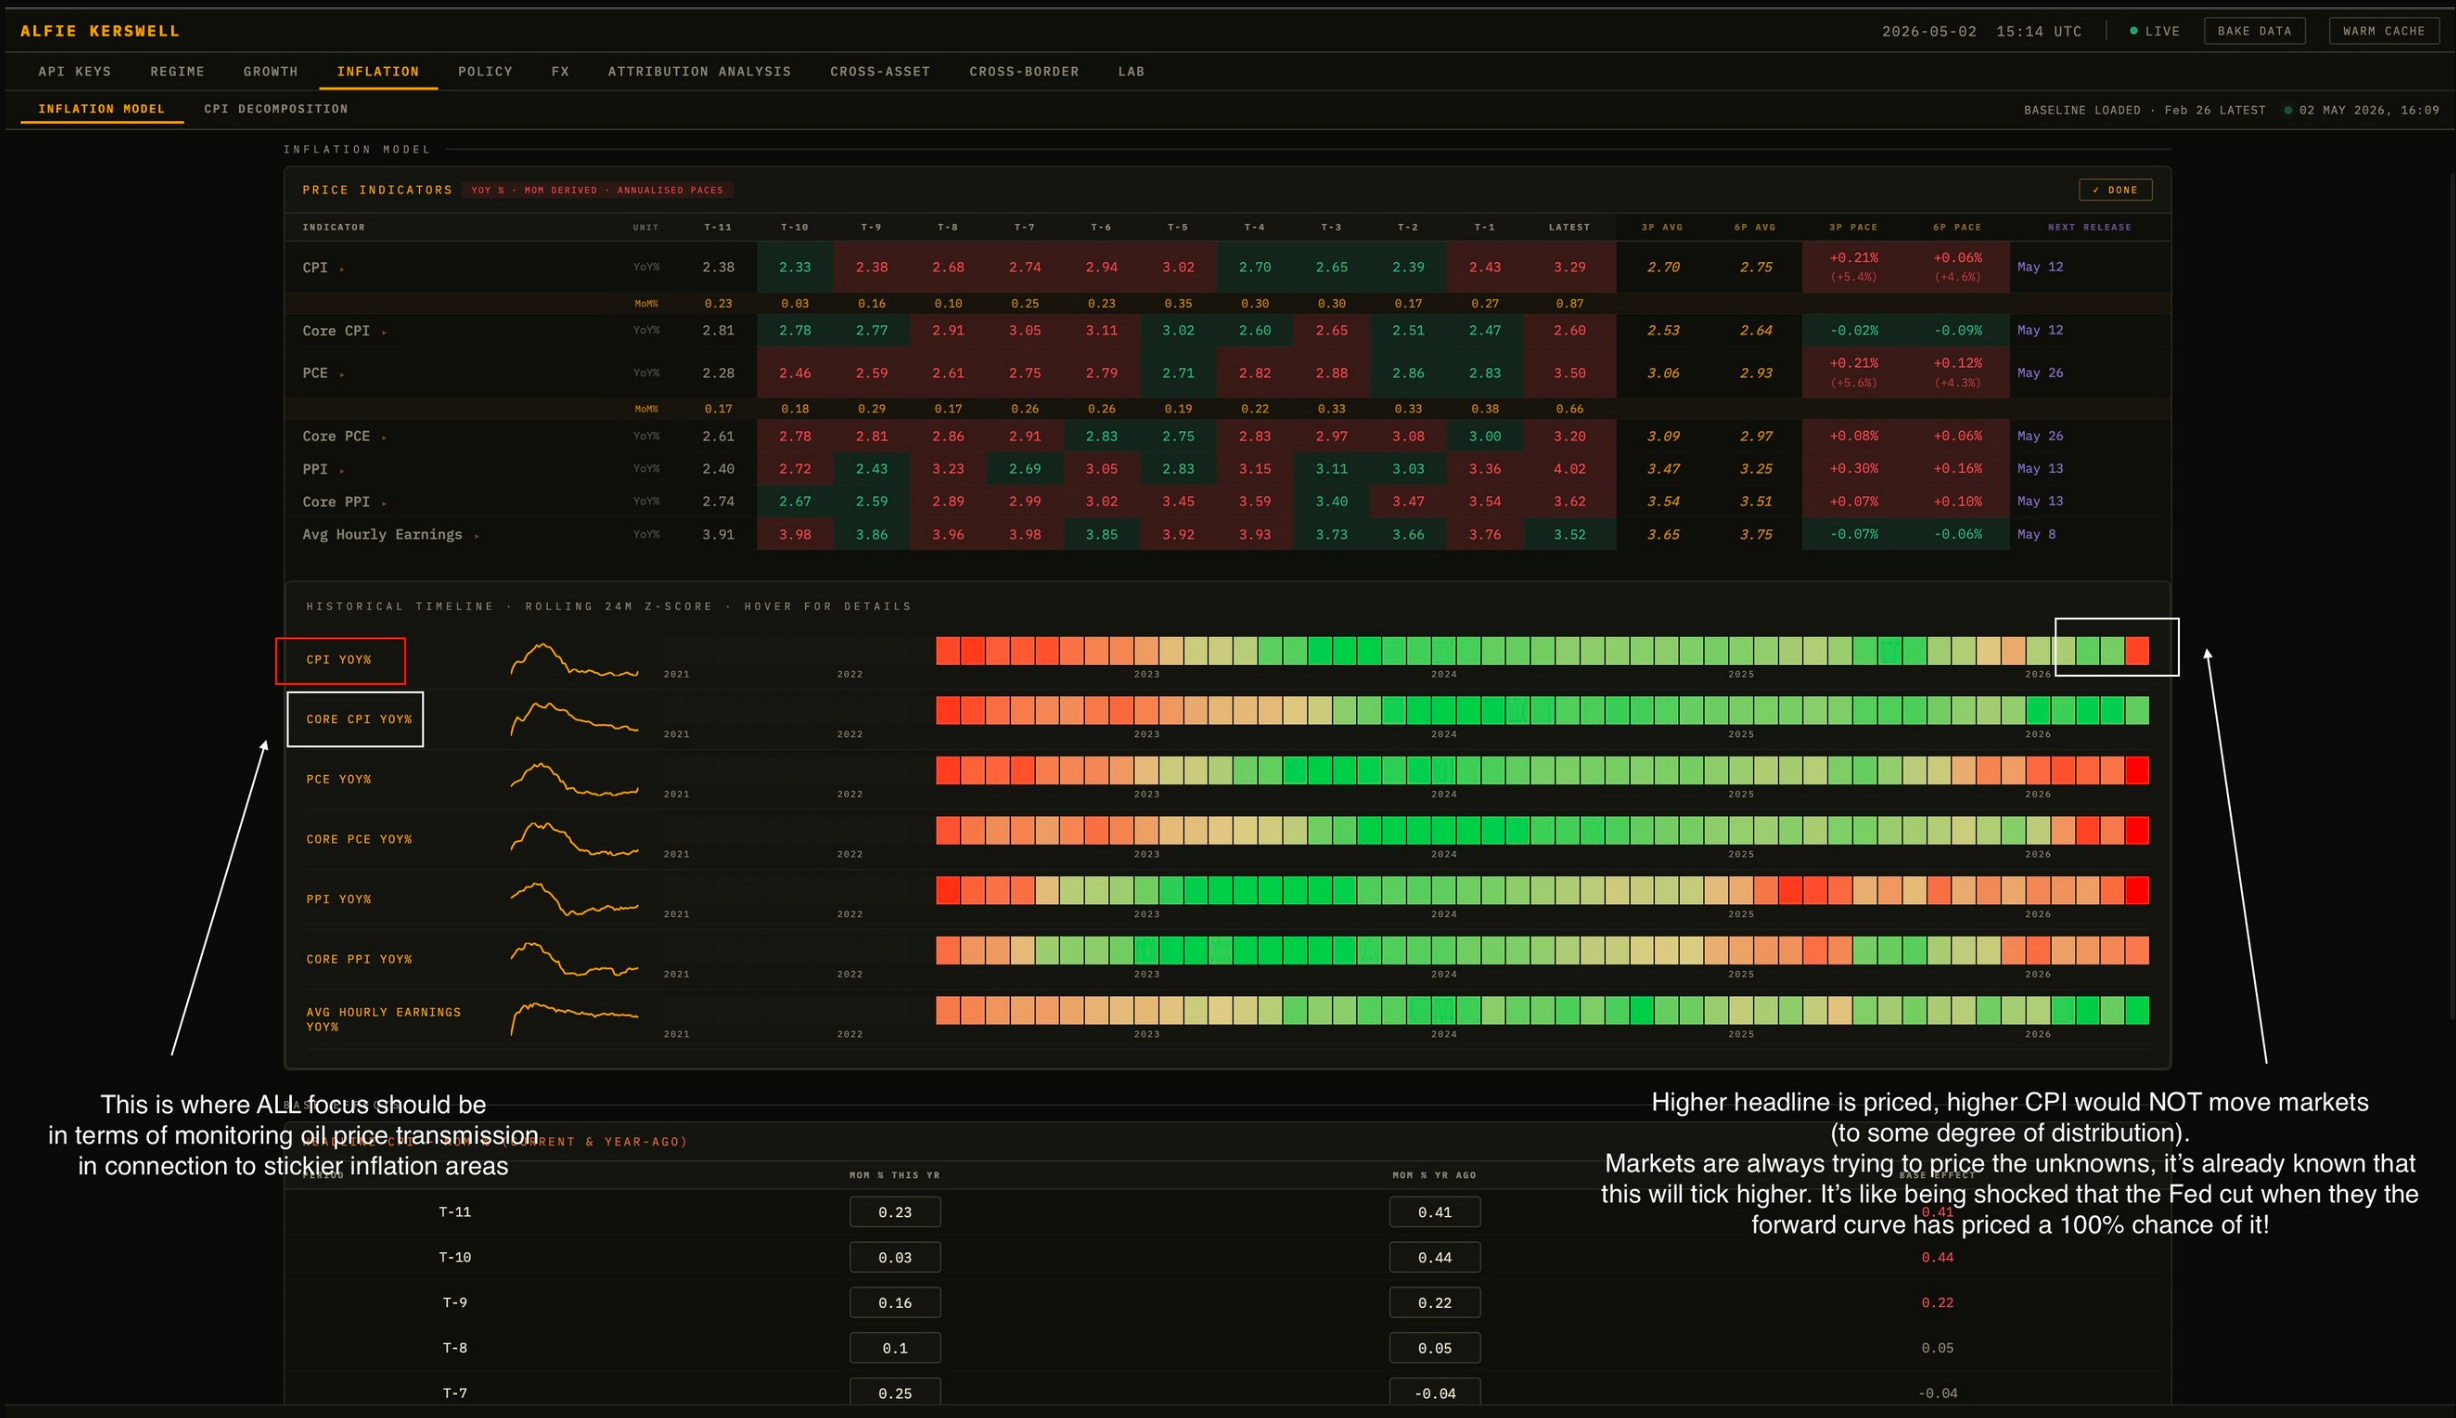
The variable that matters is core. The transmission from oil into stickier core CPI and Core PCE is the only thing that would change the macro regime. So far, on the data we have, that transmission is not showing up. Core PCE has been printing in the 2.65% to 2.81% range, with the latest tick at 2.60. Avg hourly earnings are running 3.65% with a 24m z-score that is not flashing pressure.
The headline number is going to be noisy, so the core number is the one to watch, and right now it is not validating the inflation resurgence call. It definitely could, I’m not discounting that.
The 10y nominal decomposition: it is real rates doing the work
Decompose the US 10y move and the dominant driver is real rates. Real / nominal correlation is sitting at 0.85. Inflation expectations and breakevens are showing materially LESS movement than the real rate component.
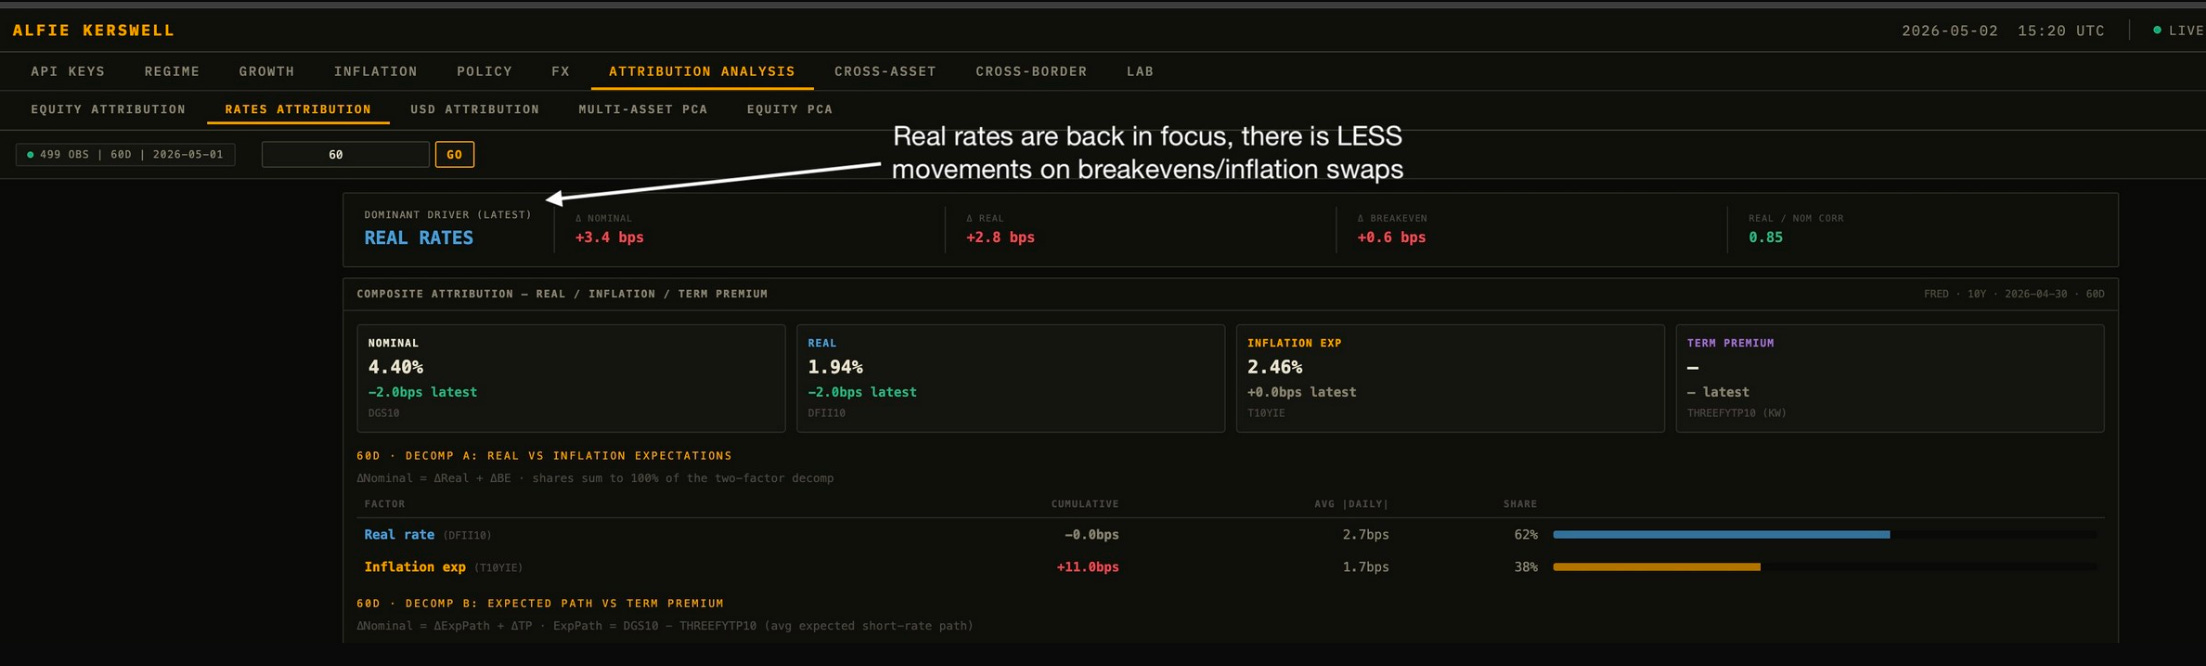
This matters because it tells you what the market is actually repricing. It’s inflation expectations, real growth expectations and term premium. The market is repricing real growth higher and demanding more compensation for duration risk. It’s not panicking about runaway inflation and it’s certainly not pricing a growth scare.
Oil is the pivot
Every bearish macro narrative right now traces back to oil. Higher oil drives higher headline CPI, which drives the hawkish ECB framing, which drives the rates repricing, which drives the equity drawdown in energy exposed names.
So let’s look at oil on its own terms.
Global risk is rallying through the shock
Before getting into the oil setup itself, look at what risk assets are doing. NDX, SPX, RTY are MASSIVELY outperforming on a 20-day vol-adjusted basis. Strong bids across global equities, even with BoE and ECB hikes priced in and oil above $100 (so the market is rallying in the face of hikes priced, says it all).
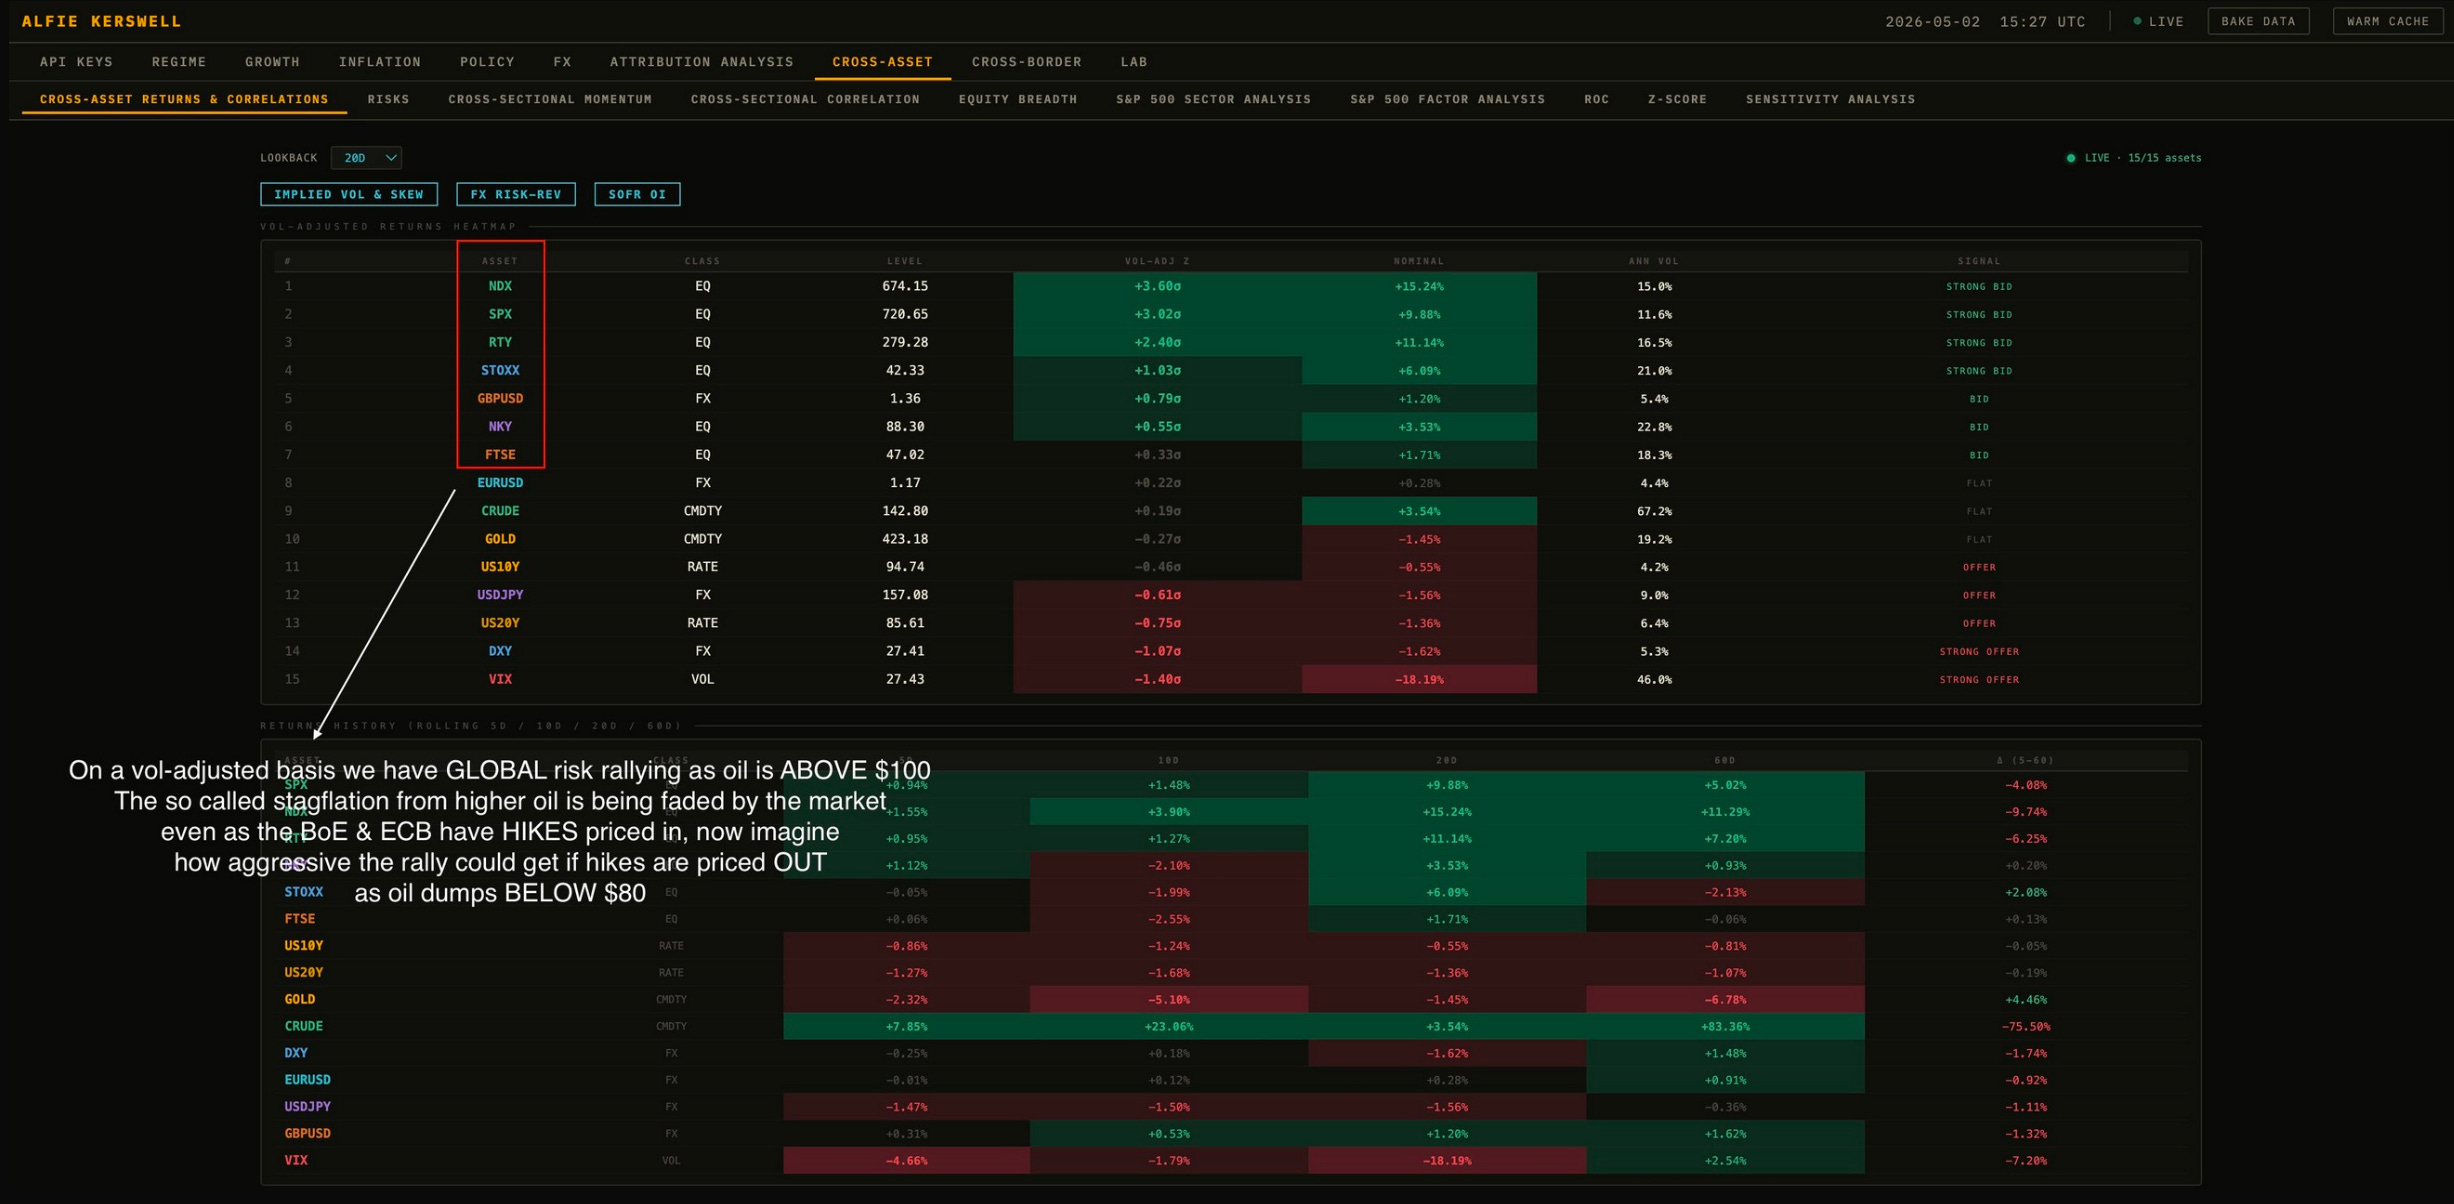
The market is fading the stagflation narrative in real time. Stagflation does not produce +3σ rallies in global equity indices. The release valve is set, imagine the upside IF hikes start getting priced out and oil normalises.
The base rate for normalisation is overwhelming
20-day z-score on Oil is currently moving out of an extreme again. The pattern of the last several years is unambiguous: every prior excursion above +3σ has mean-reverted violently.
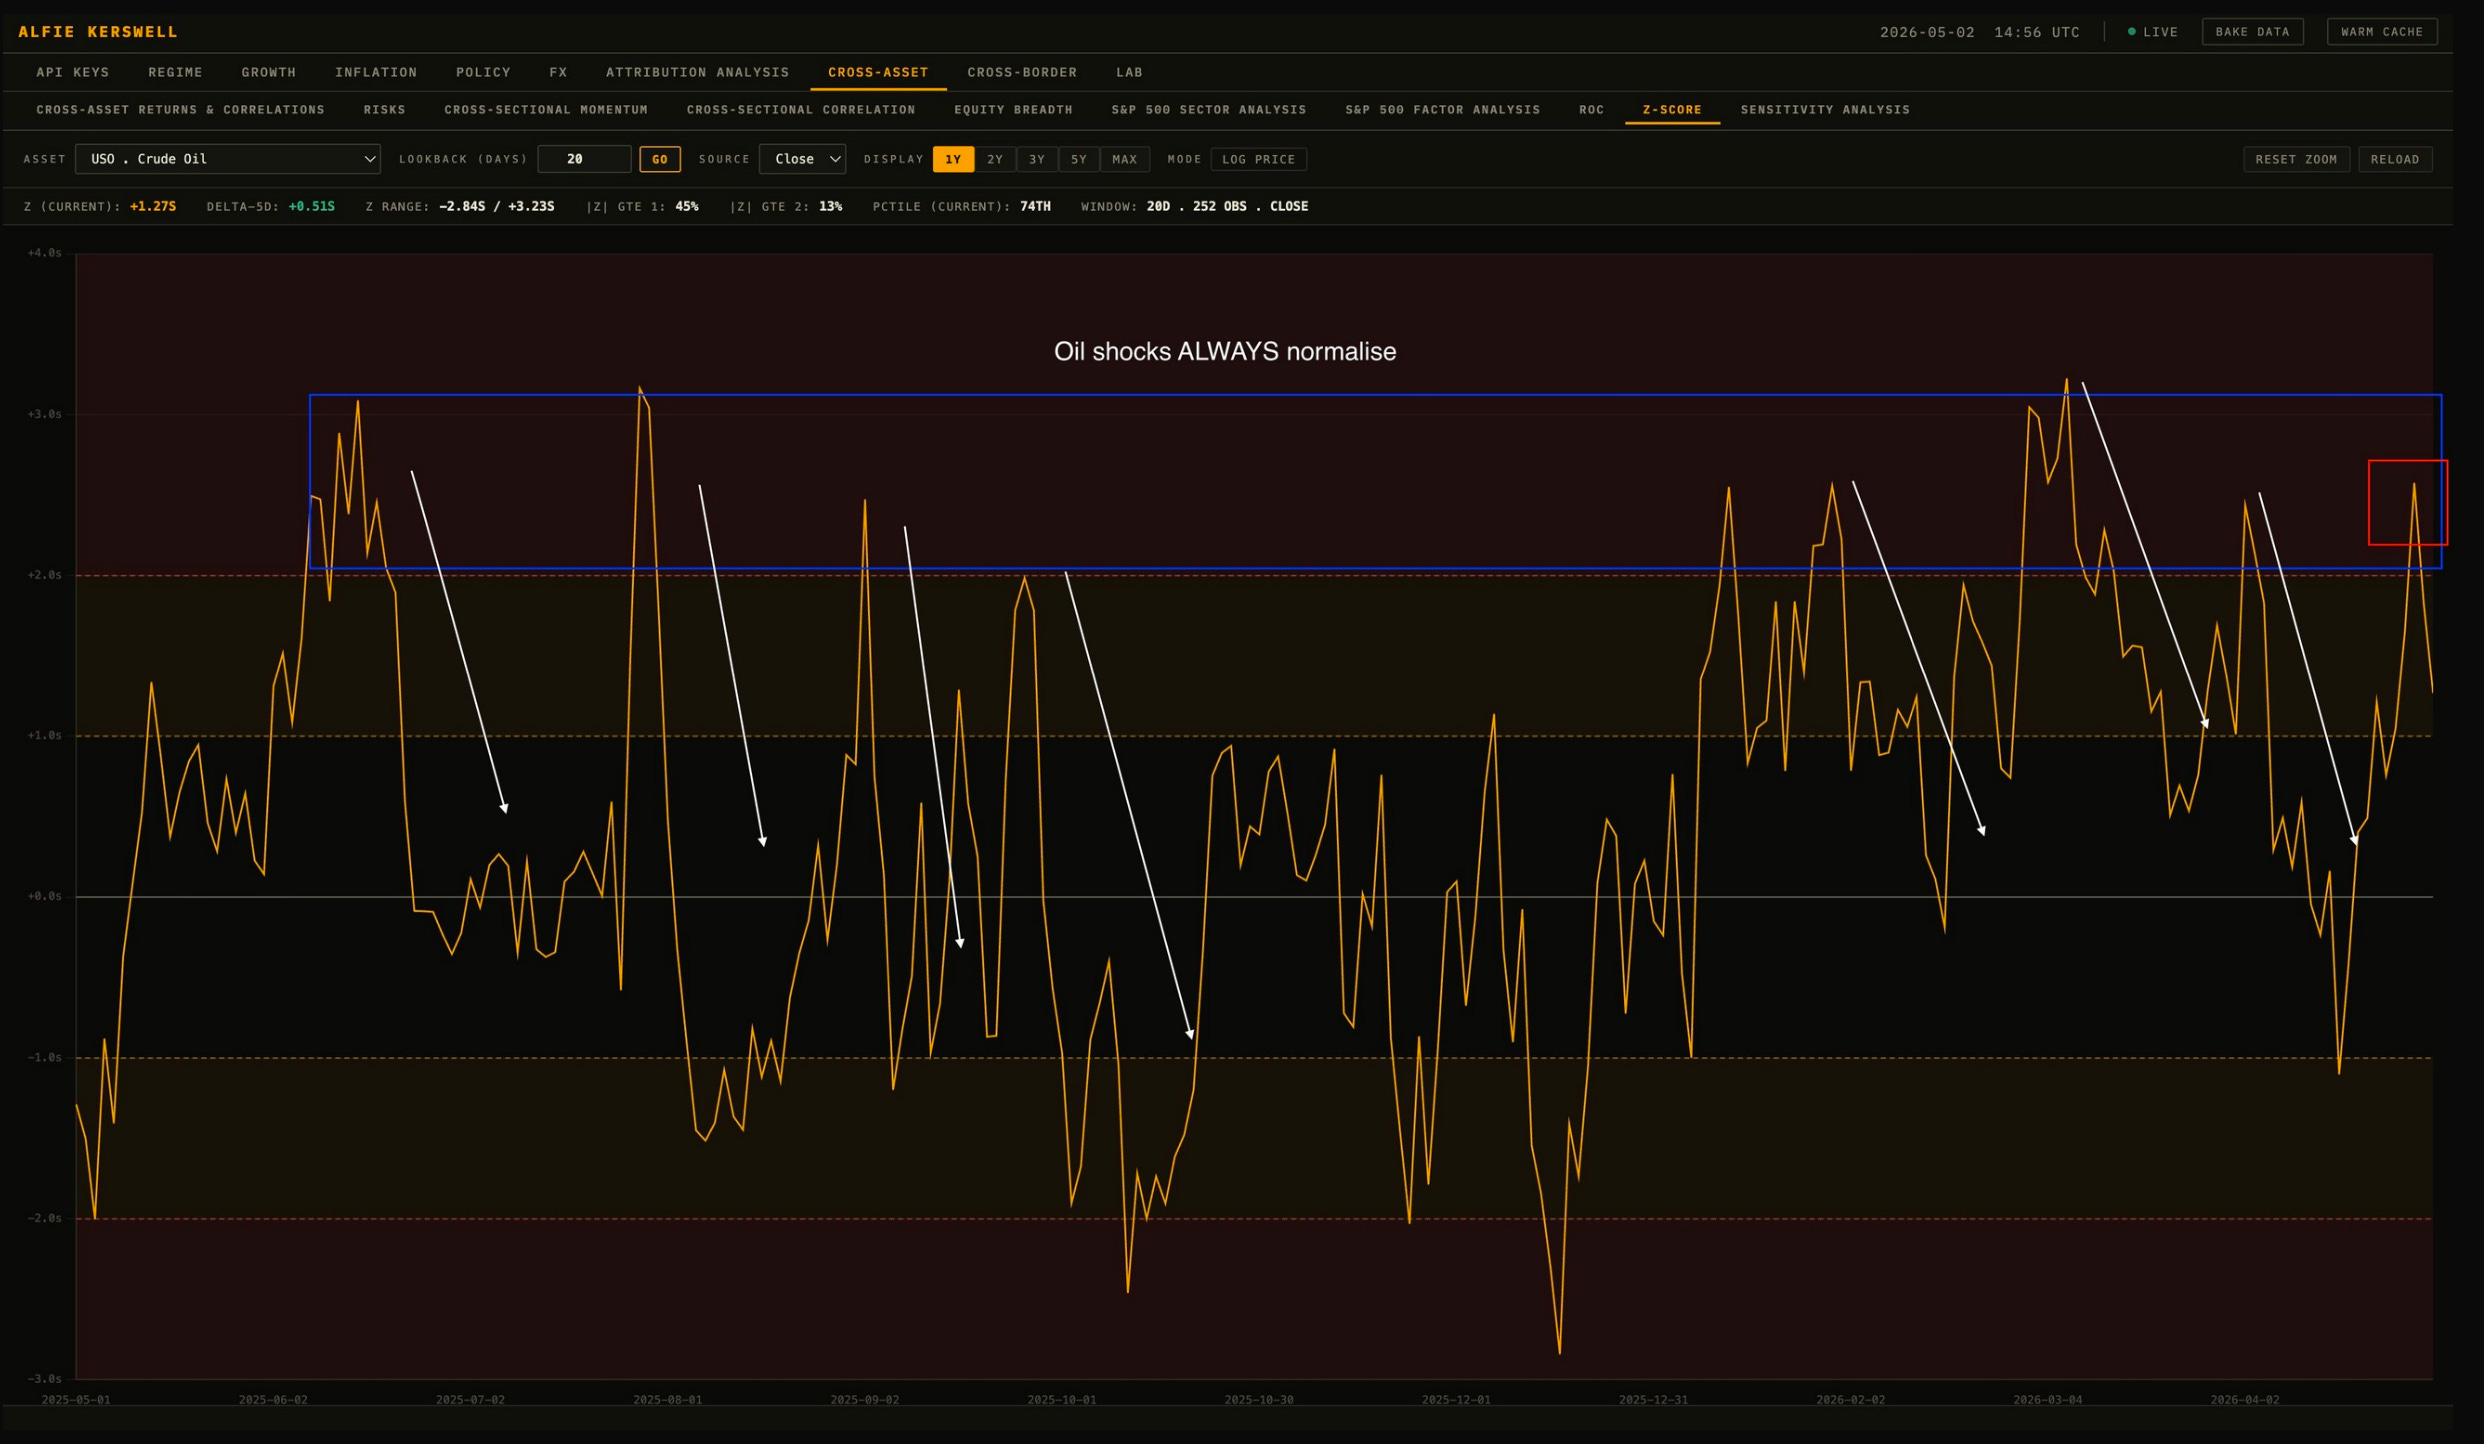
I am NOT making a directional call that oil collapses tomorrow. But what I’m saying is that positions in oil at extended z-scores have a poor expected return on the long side and a strong expected return on the short side, on a multi-week horizon, and I definitely WOULDN’T bet against that.
The price / implied vol divergence is the tell
This is the more interesting setup. Look at WTI price vs OVX over the last few weeks. Price is sitting at the highs of the move while OVX has compressed meaningfully off the spike. That is skew flipping and realised vol starting to come in even as the headline price stays bid.
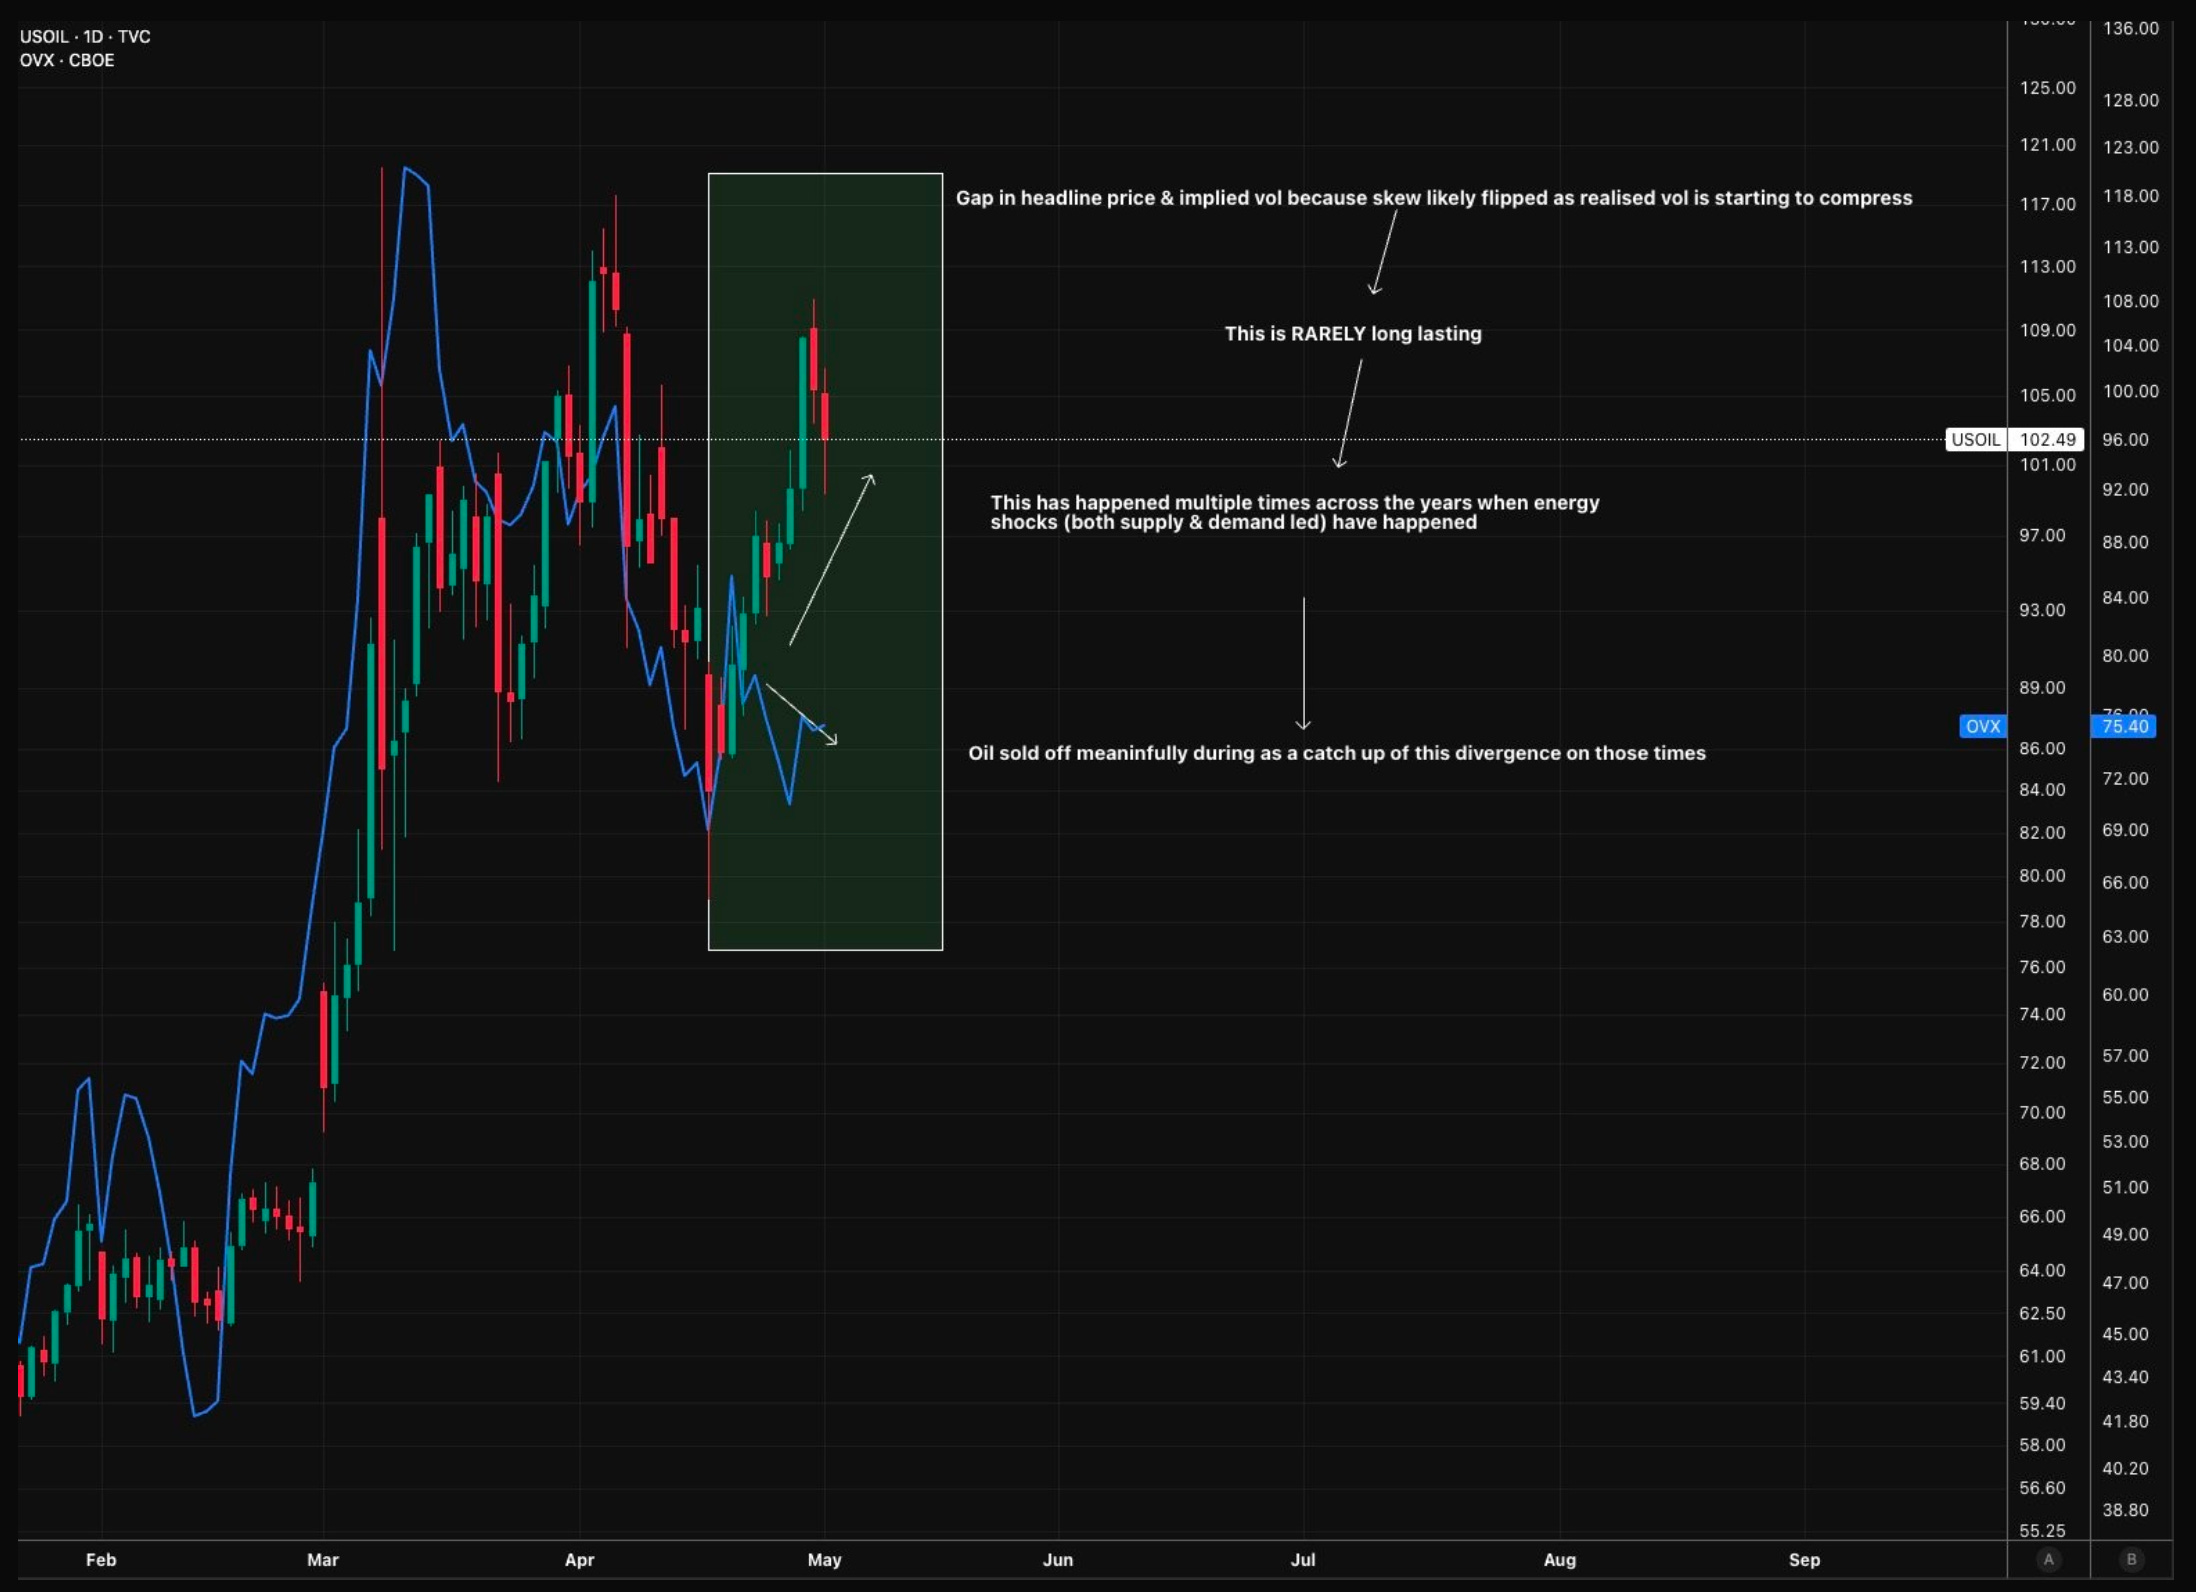
Historically (sorry I don’t wanna be the guy that says that but…), this divergence does not last. The way it resolves (almost without exception across both supply-led and demand-led shocks) is the price comes down to meet the vol rather than the other way round.
This is the kind of setup where you want to be paying attention because the unwinds tend to be sharp and they tend to mark the regime change (which is already underway in my view, just look at equities).
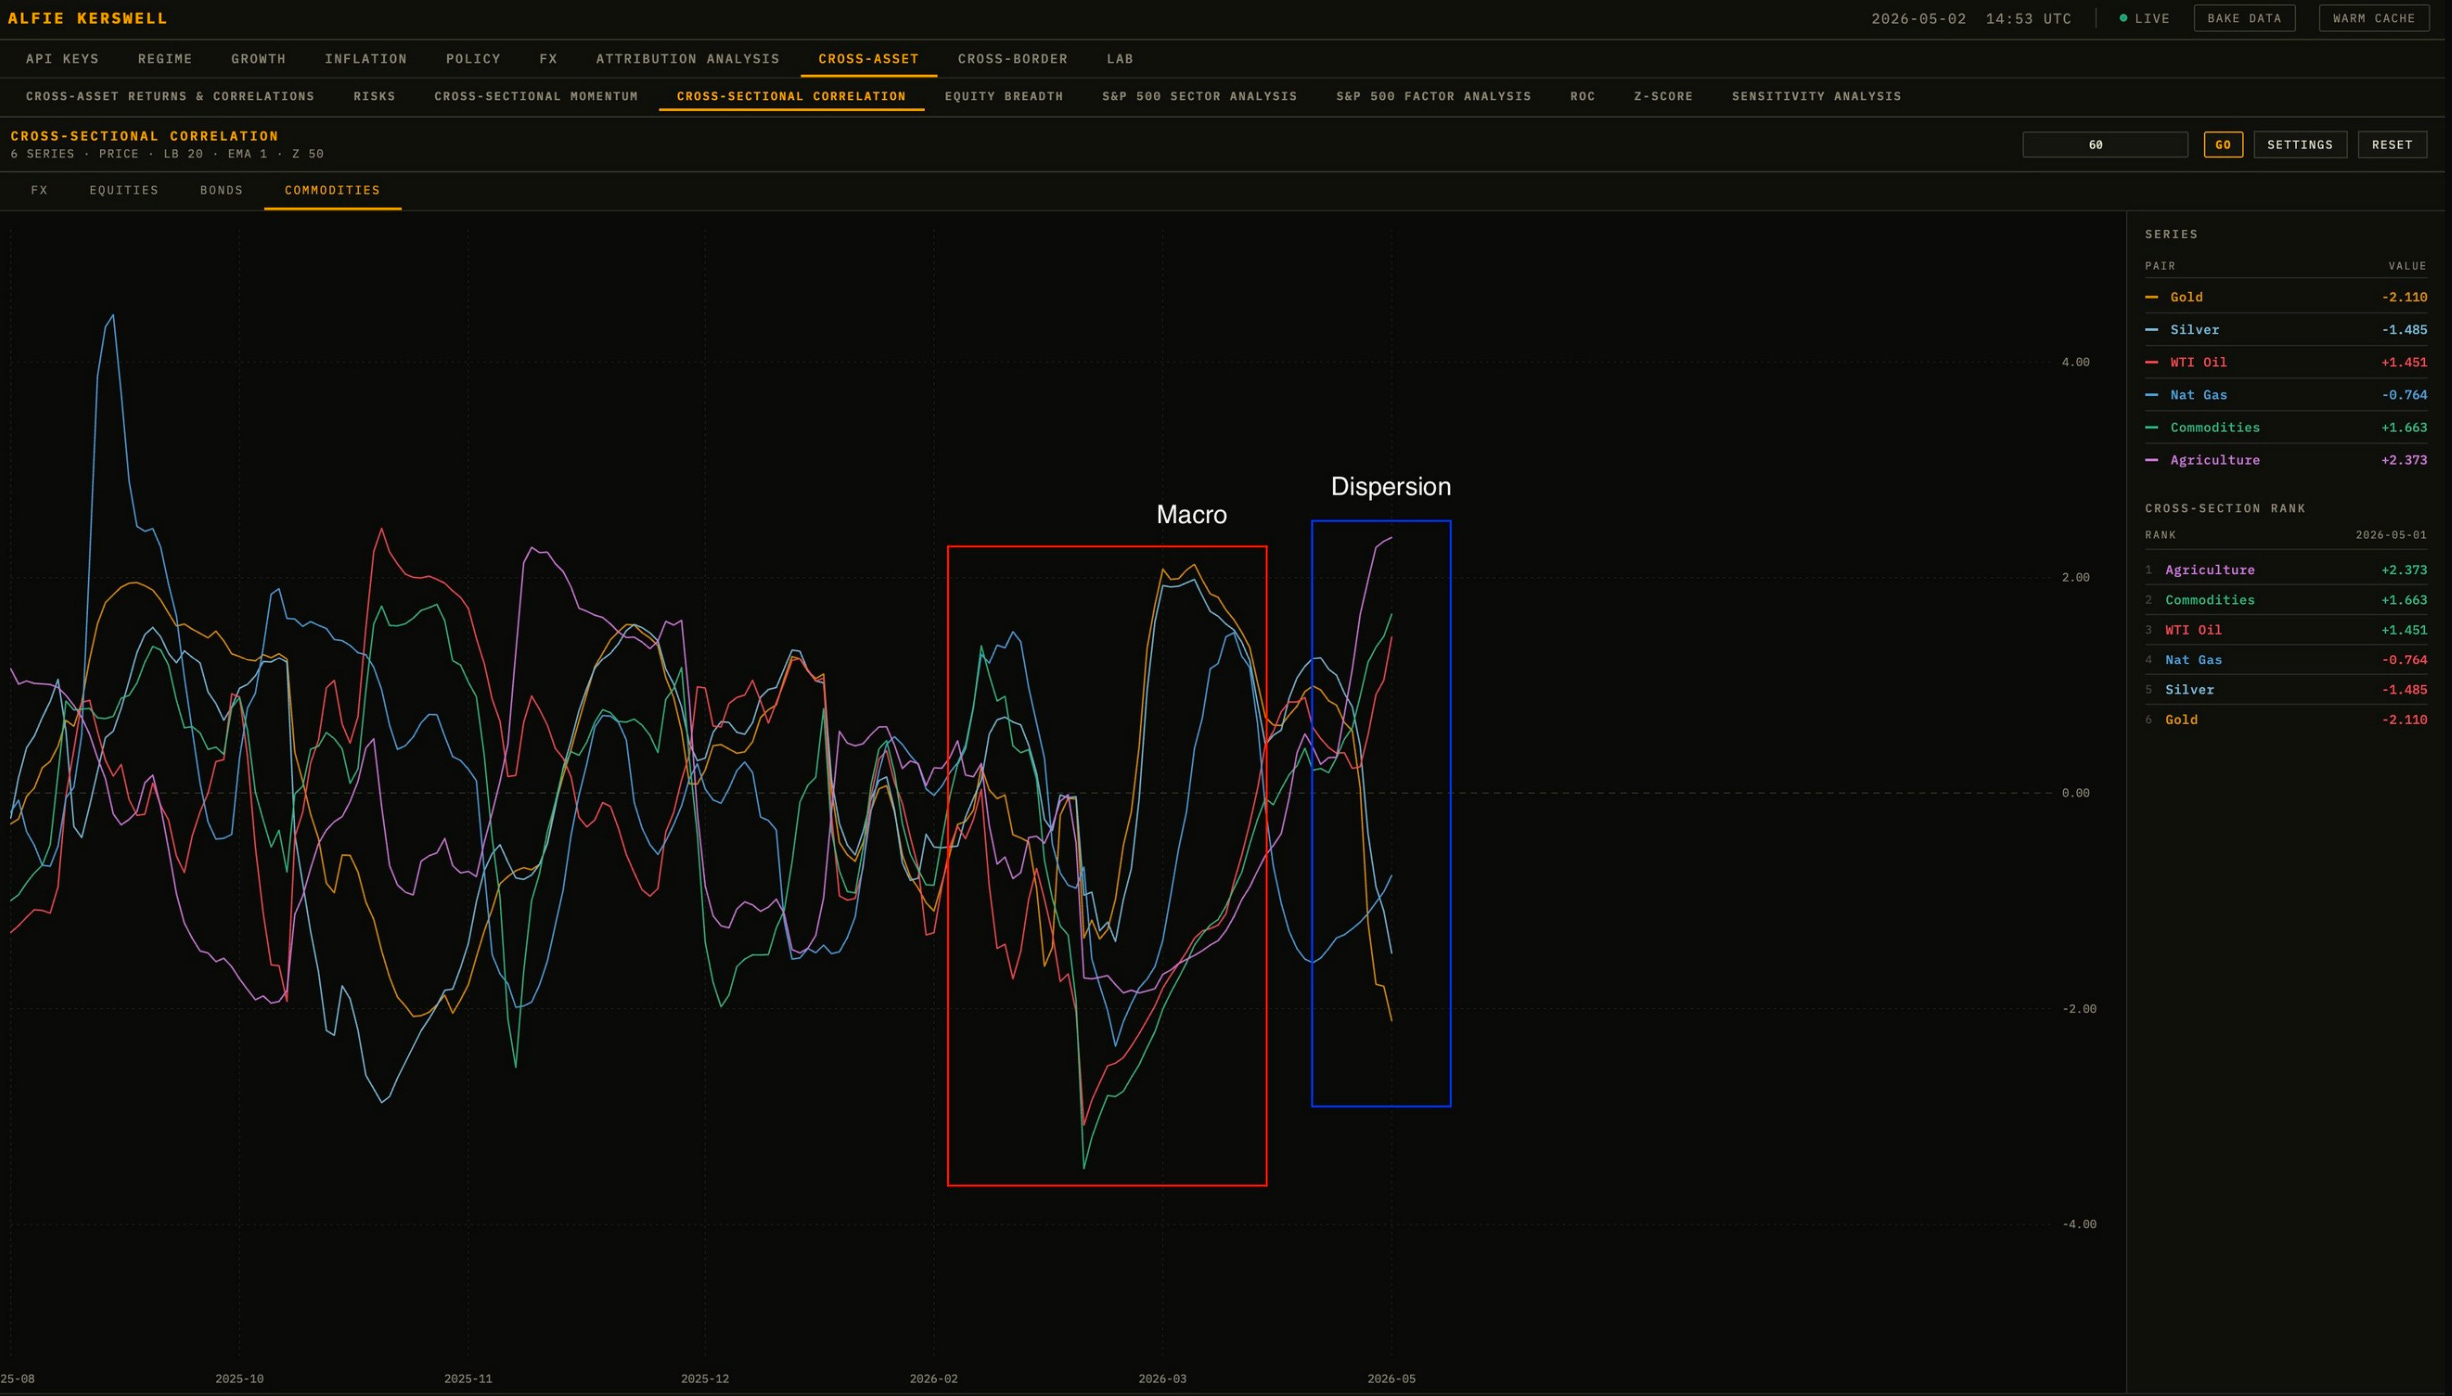
The commodity complex has rotated from macro to dispersion
60-day CS correlation & momentum tells the same story. The commodity complex moved as one block during the macro phase when the oil shock was driving everything. We are now in a dispersion phase.
Correlation:
Momentum:
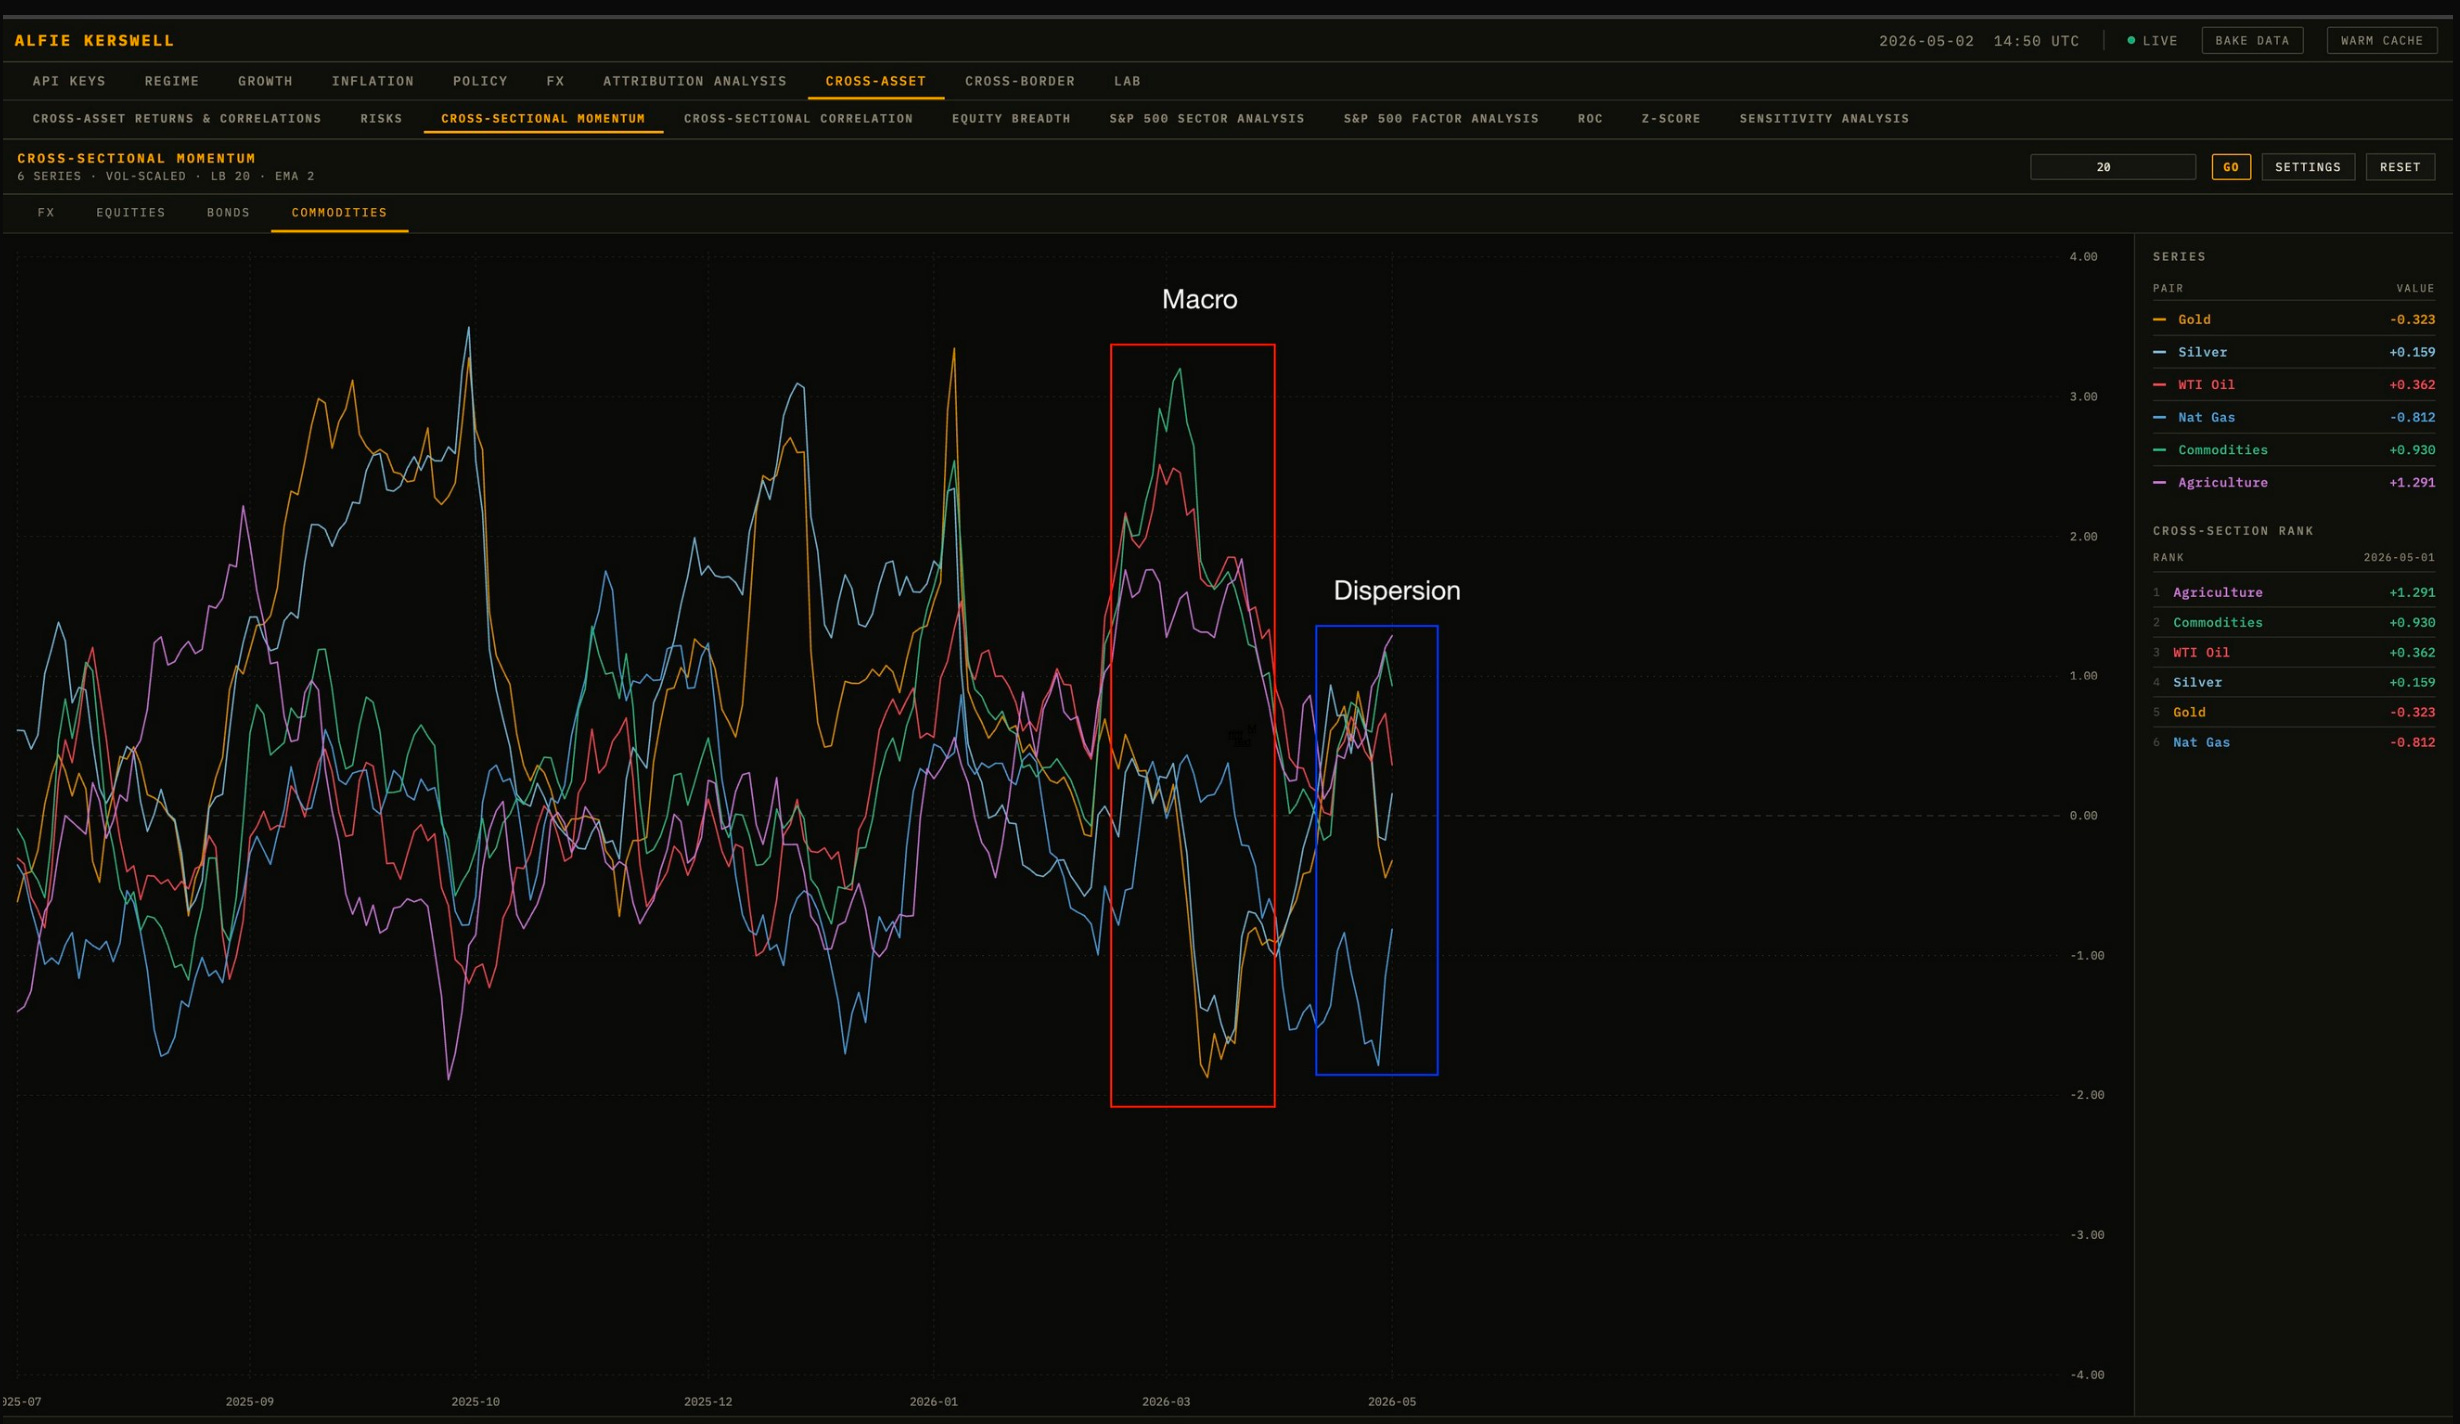
Dispersion regime is NOT what you see when a macro shock is in front of you, with more to come. Dispersion regime is what you see when a macro shock has run its course and the cross-section is starting to trade on its own fundamentals again.
If the oil shock had legs the complex would still be moving as one (macro driven).
Where this leaves us
The data is NOT on the side of the recession call. The curve is bear steepening, GDPNow is at 3.52%, the 10y is repricing real rates and nominal growth, and core inflation is not showing energy pass-through.
Oil is doing ALL the work on the bearish narrative. And oil is sitting at an extended z-score, with a price / implied vol divergence that historically does not last, in a complex that has rotated from macro to dispersion.
The setup is ready. The question is HOW to express it.
In Part 2, I make the case that the DAX is the cleanest expression of this asymmetry. ECB OIS still pricing 80bps of hikes that have to come out if oil normalises. A 2022 to 2024 analogue that ran exactly this script and ended at all-time highs.
That is the trade. See you in Part 2.
Thanks
Alfie
Thoughtful and differentiated view. New subscriber based on the quality of this work.
great work! i’m excited for part 2