
The Case for an Inevitable Market Downturn
Building Toward a U.S. Market Collapse

Hey MMH readers,
Firstly, let me know what you think of the new additions at the start of reports:
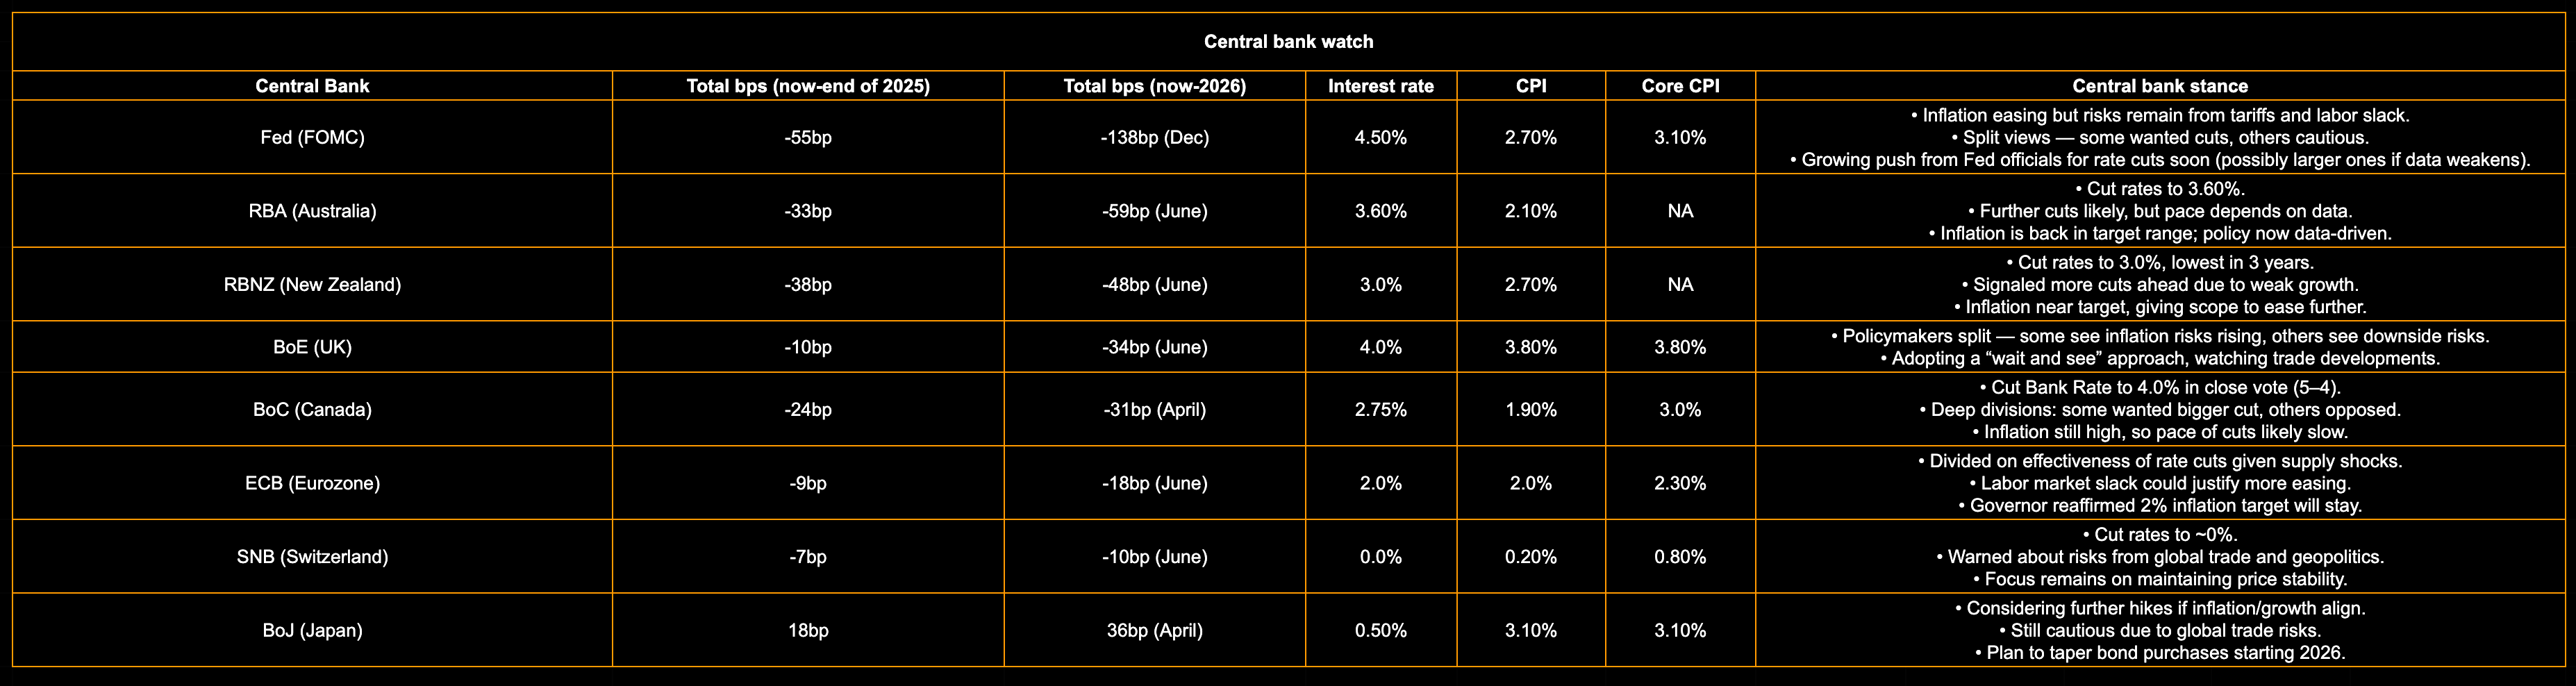
Central bank watch
Geopolitics & Headlines: Summary
Data: Summary
Sector Performance: Last Week
Some weeks feel like a sprint, others like a grind, but both test how well we manage our energy and focus.
It’s easy to chase everything at once, harder to slow down and decide what actually matters most.
That clarity is what creates the real edge in trading, in work, and in life.
Let’s begin.
Central bank watch
Geopolitics & Headlines: Summary
Ukraine / Russia:
Zelenskiy: Ukraine doesn’t plan to reduce its military.
Meeting prep with U.S. envoy Kellogg re: possible Putin talks.
Zelenskiy: Ukraine using its own weapons for strikes in Russia, not consulting Washington.
Italy’s foreign minister: no end to Ukraine war this year.
Russia struck EU Mission and British Council building in Kyiv.
Tariffs:
Switzerland & Japan: Suspending some U.S. goods shipments due to tariffs and de minimis changes.
Lagarde (ECB):
Said European companies will adjust to higher U.S. tariffs.
Estimated tariffs will have only a small effect on Eurozone GDP.
Europe:
Citi: French-German 10Y bond yield spread could widen to 95 bps after confidence vote.
Political turmoil in France may weigh on rating reviews.
France, Britain, Germany trigger process to reimpose UN sanctions on Iran (Reuters letter).
US:
Trump pick Miran is on track for confirmation before the Fed meets.
Lisa Cook (Fed Governor):
White House says Trump had lawful cause to remove her, accused her of lying.
Cook is suing Trump over her ouster from the Fed board.
White House also said Robert Primus was terminated for not aligning with “America First” agenda.
Crypto push: U.S. to put GDP data on blockchain (trial across 9 blockchains including Bitcoin).
NVIDIA ($NVDA):
Stock extended decline to –2%.
Willing to give the U.S. a cut of Blackwell chip sales in China (Fox).
Data: Summary
US
Consumer Confidence (Aug, CB): 97.4 vs 96.4 exp (higher, though still down from 98.7 prior).
GDP (Q2, 2nd est.): +3.3% QoQ SAAR (beat 3.0% forecast; prior –0.5%).
Core PCE prices Q2: +2.5% (inline, down from 3.5% prior).
Real Consumer Spending Q2: +1.6% vs +1.4% exp.
GDP Sales: +6.8% vs 6.3% exp (big rebound from –3.1%).
Initial Jobless Claims (Aug 28): 229K vs 231K exp (steady).
Core PCE Price Index (Jul): +0.3% MoM, +2.9% YoY (inline).
Personal Income/Spending (Jul): Income +0.4% (exp 0.3%); Spending +0.5% (exp 0.3%).
Michigan Consumer Sentiment (Aug final): 58.6 (lower vs 61.7 prior). Inflation expectations steady (1y 4.9%, 5y 3.9%).
Eurozone / Germany
German Unemployment (Aug): –9K change vs +10K exp; unemployment rate steady at 6.3%.
German CPI (Aug flash): 2.1% YoY vs 2.0% exp; MoM flat.
Japan
Tokyo CPI (Aug): Headline +2.6% YoY, Core +2.5% YoY (slowing vs prior 2.9%).
Unemployment (Jul): 2.3% vs 2.5% exp (better).
Australia
Monthly CPI (Jul): +2.8% YoY vs 2.3% exp (hotter).
Switzerland
GDP (Q2): +0.1% QoQ (exp 0.1%, down from 0.4% prior); +1.2% YoY (below 1.4% exp).
Global Themes
Housing/real estate data in U.S. remained soft (permits, pending, new homes).
U.S. Q2 GDP rebound strong, with spending and sales surprising to upside.
Inflation measures (Core PCE, Tokyo CPI, German CPI) showing modest disinflation, but stickiness in services.
Canada GDP a major miss (–0.6% annualised).
Australia CPI hotter than expected (hawkish risk for RBA).
Eurozone sentiment fragile despite slightly better German IFO.
Sector Performance: Last Week
Utilities: -1.32%
Consumer staples: -2.26%
Consumer discretionary: +0.79%
Energy: +2.23%
Healthcare: -1.25%
Financials: +0.71%
Industrials: +0.58%
Tech: 1.57%
Materials: +0.07%
Real estate: -0.51%
Communication services: +0.31%
Trades update from last report
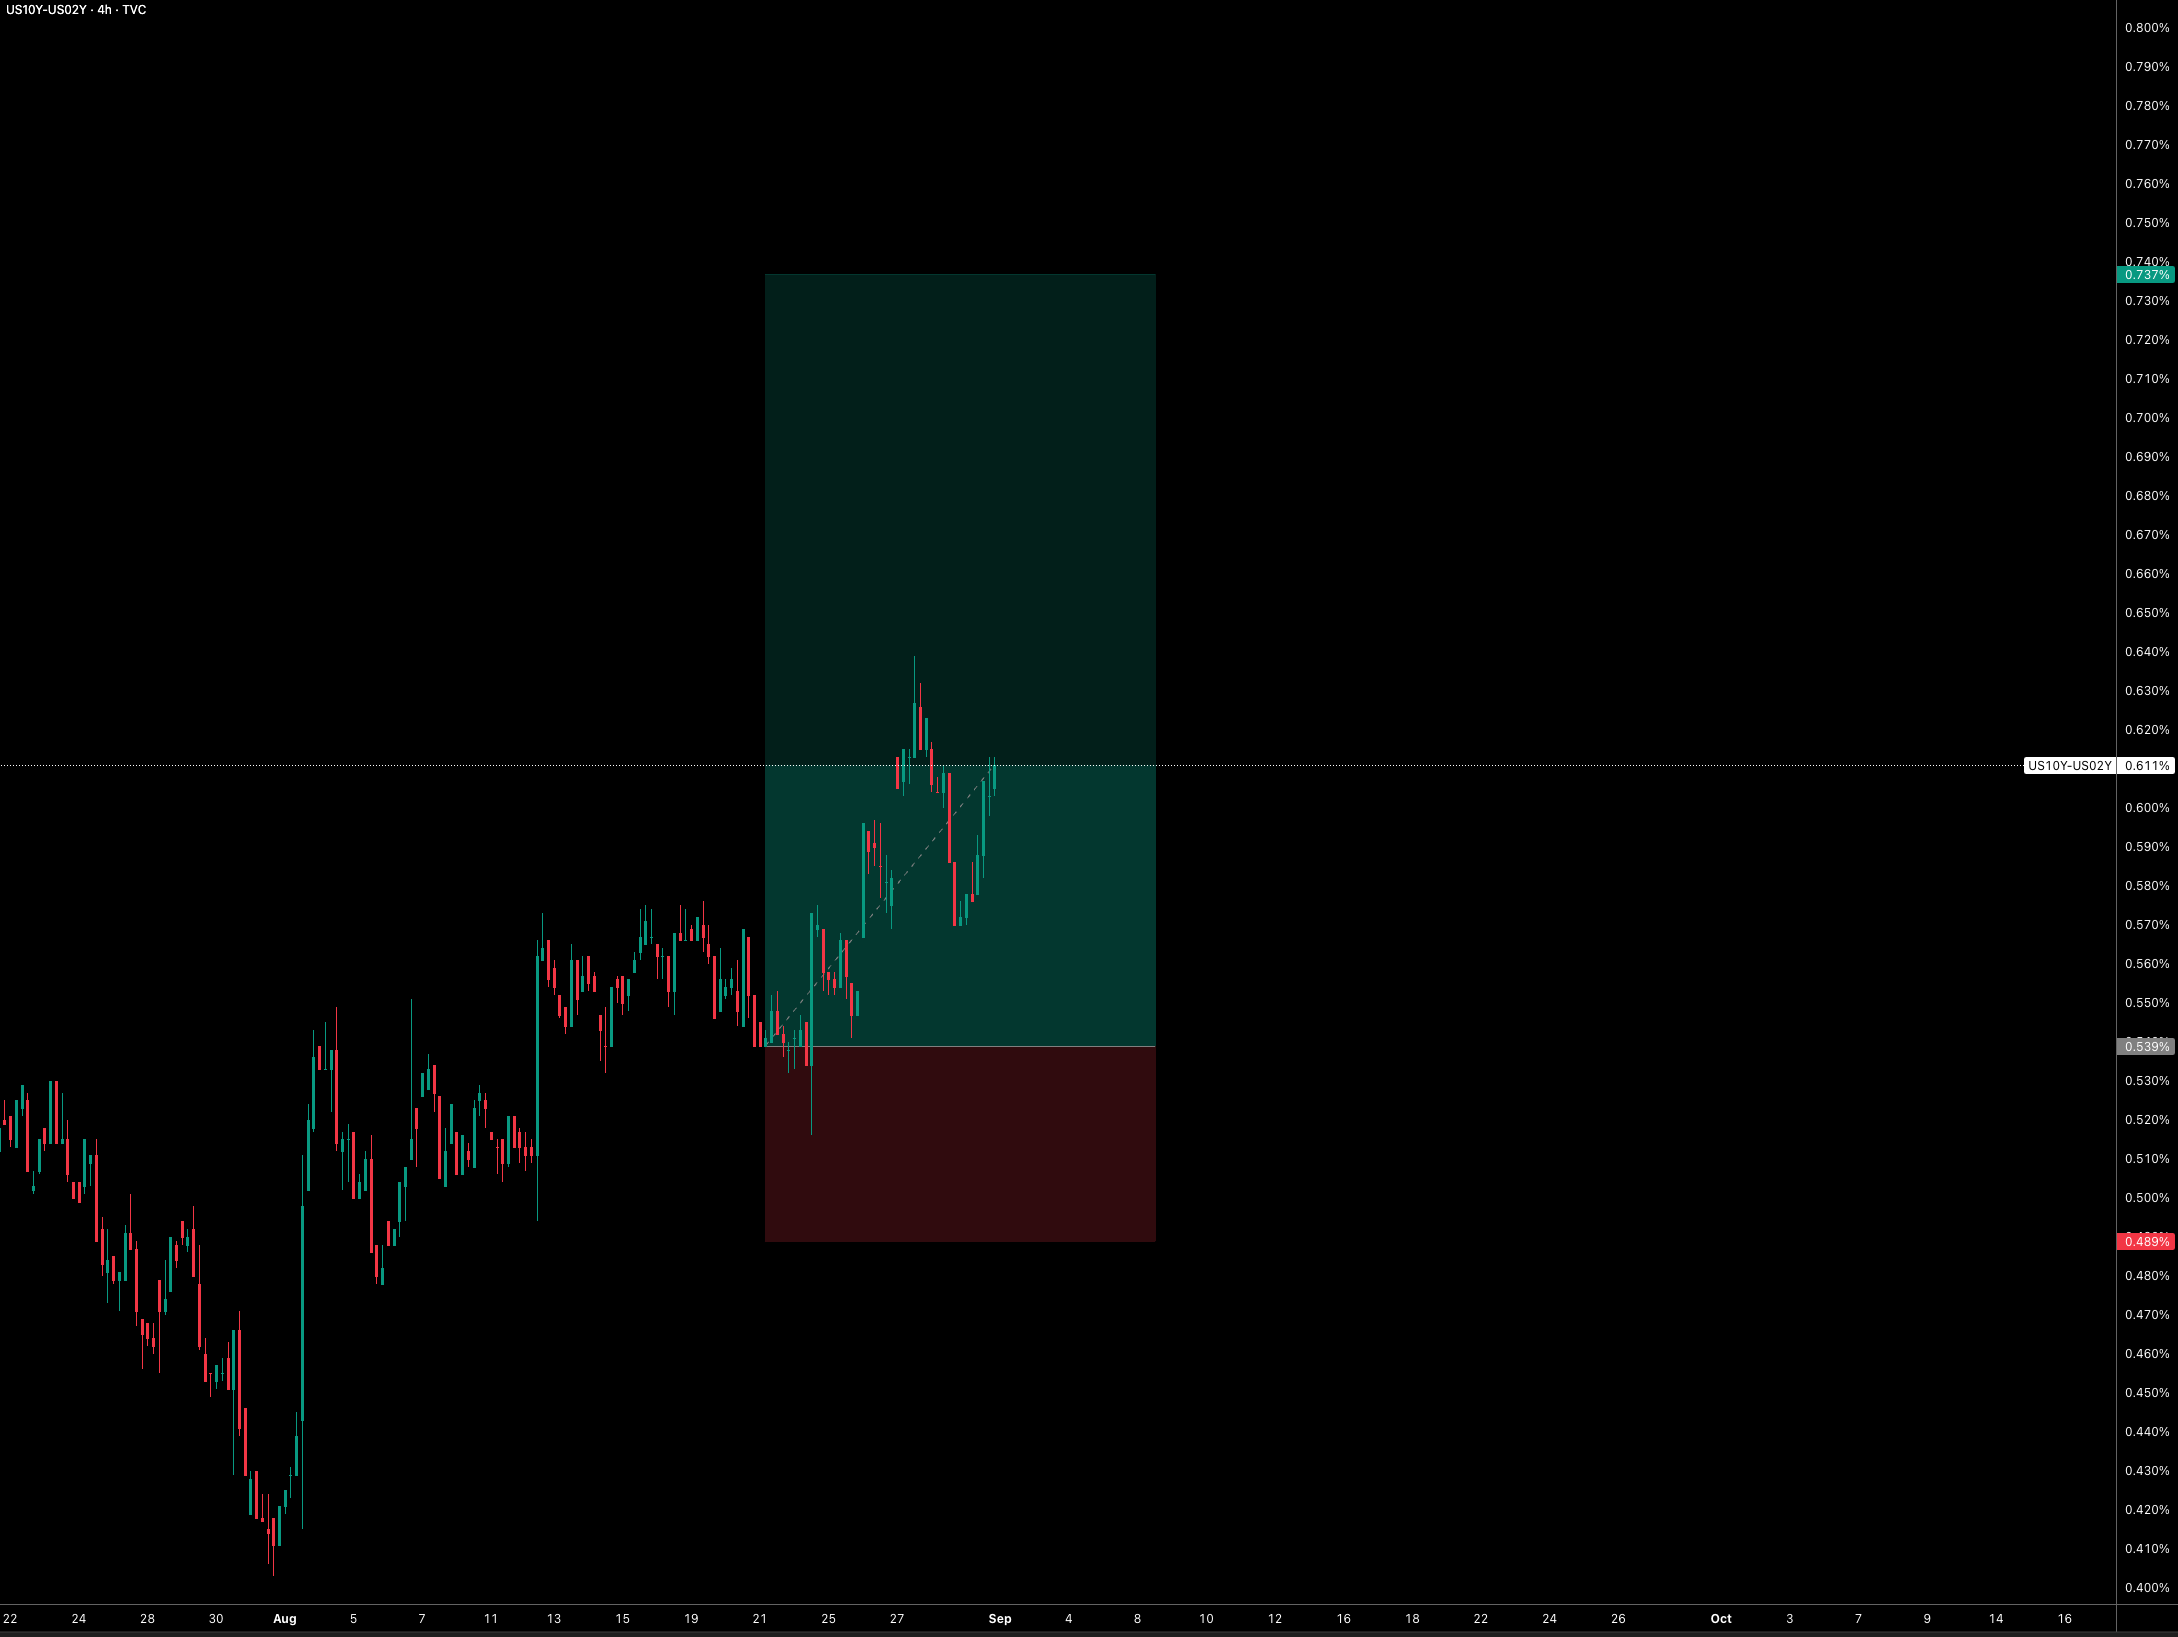
2s10s steepener:
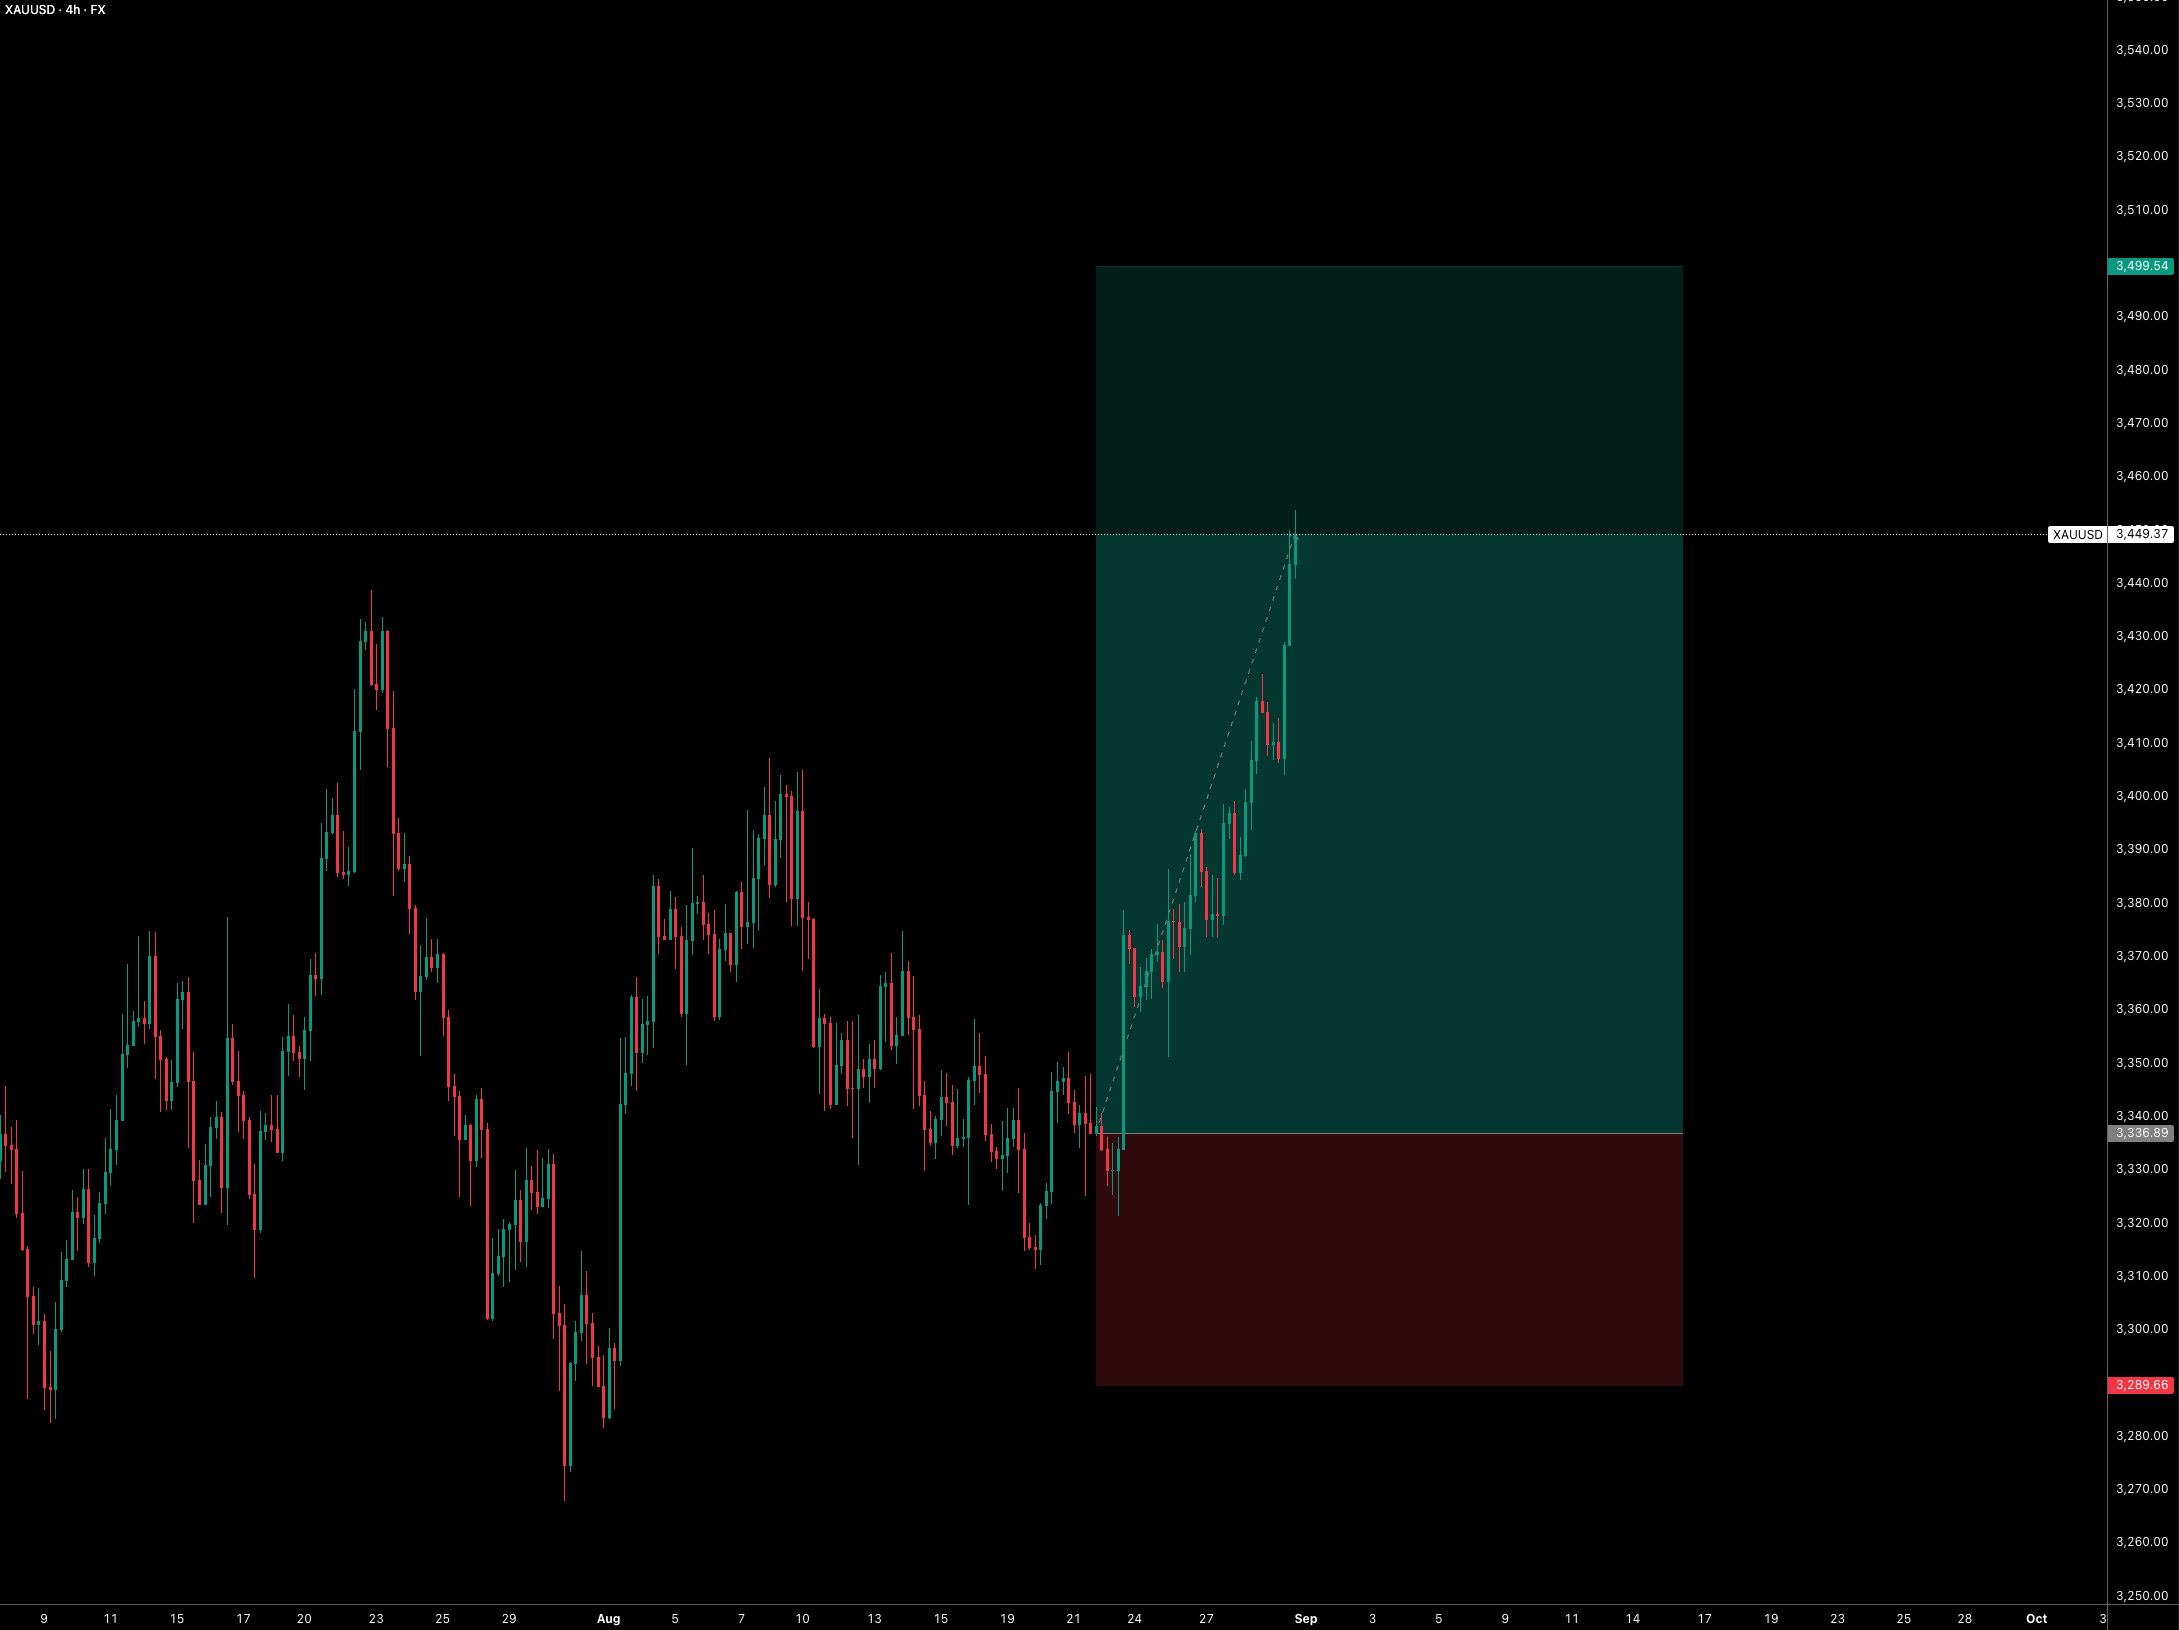
Gold:
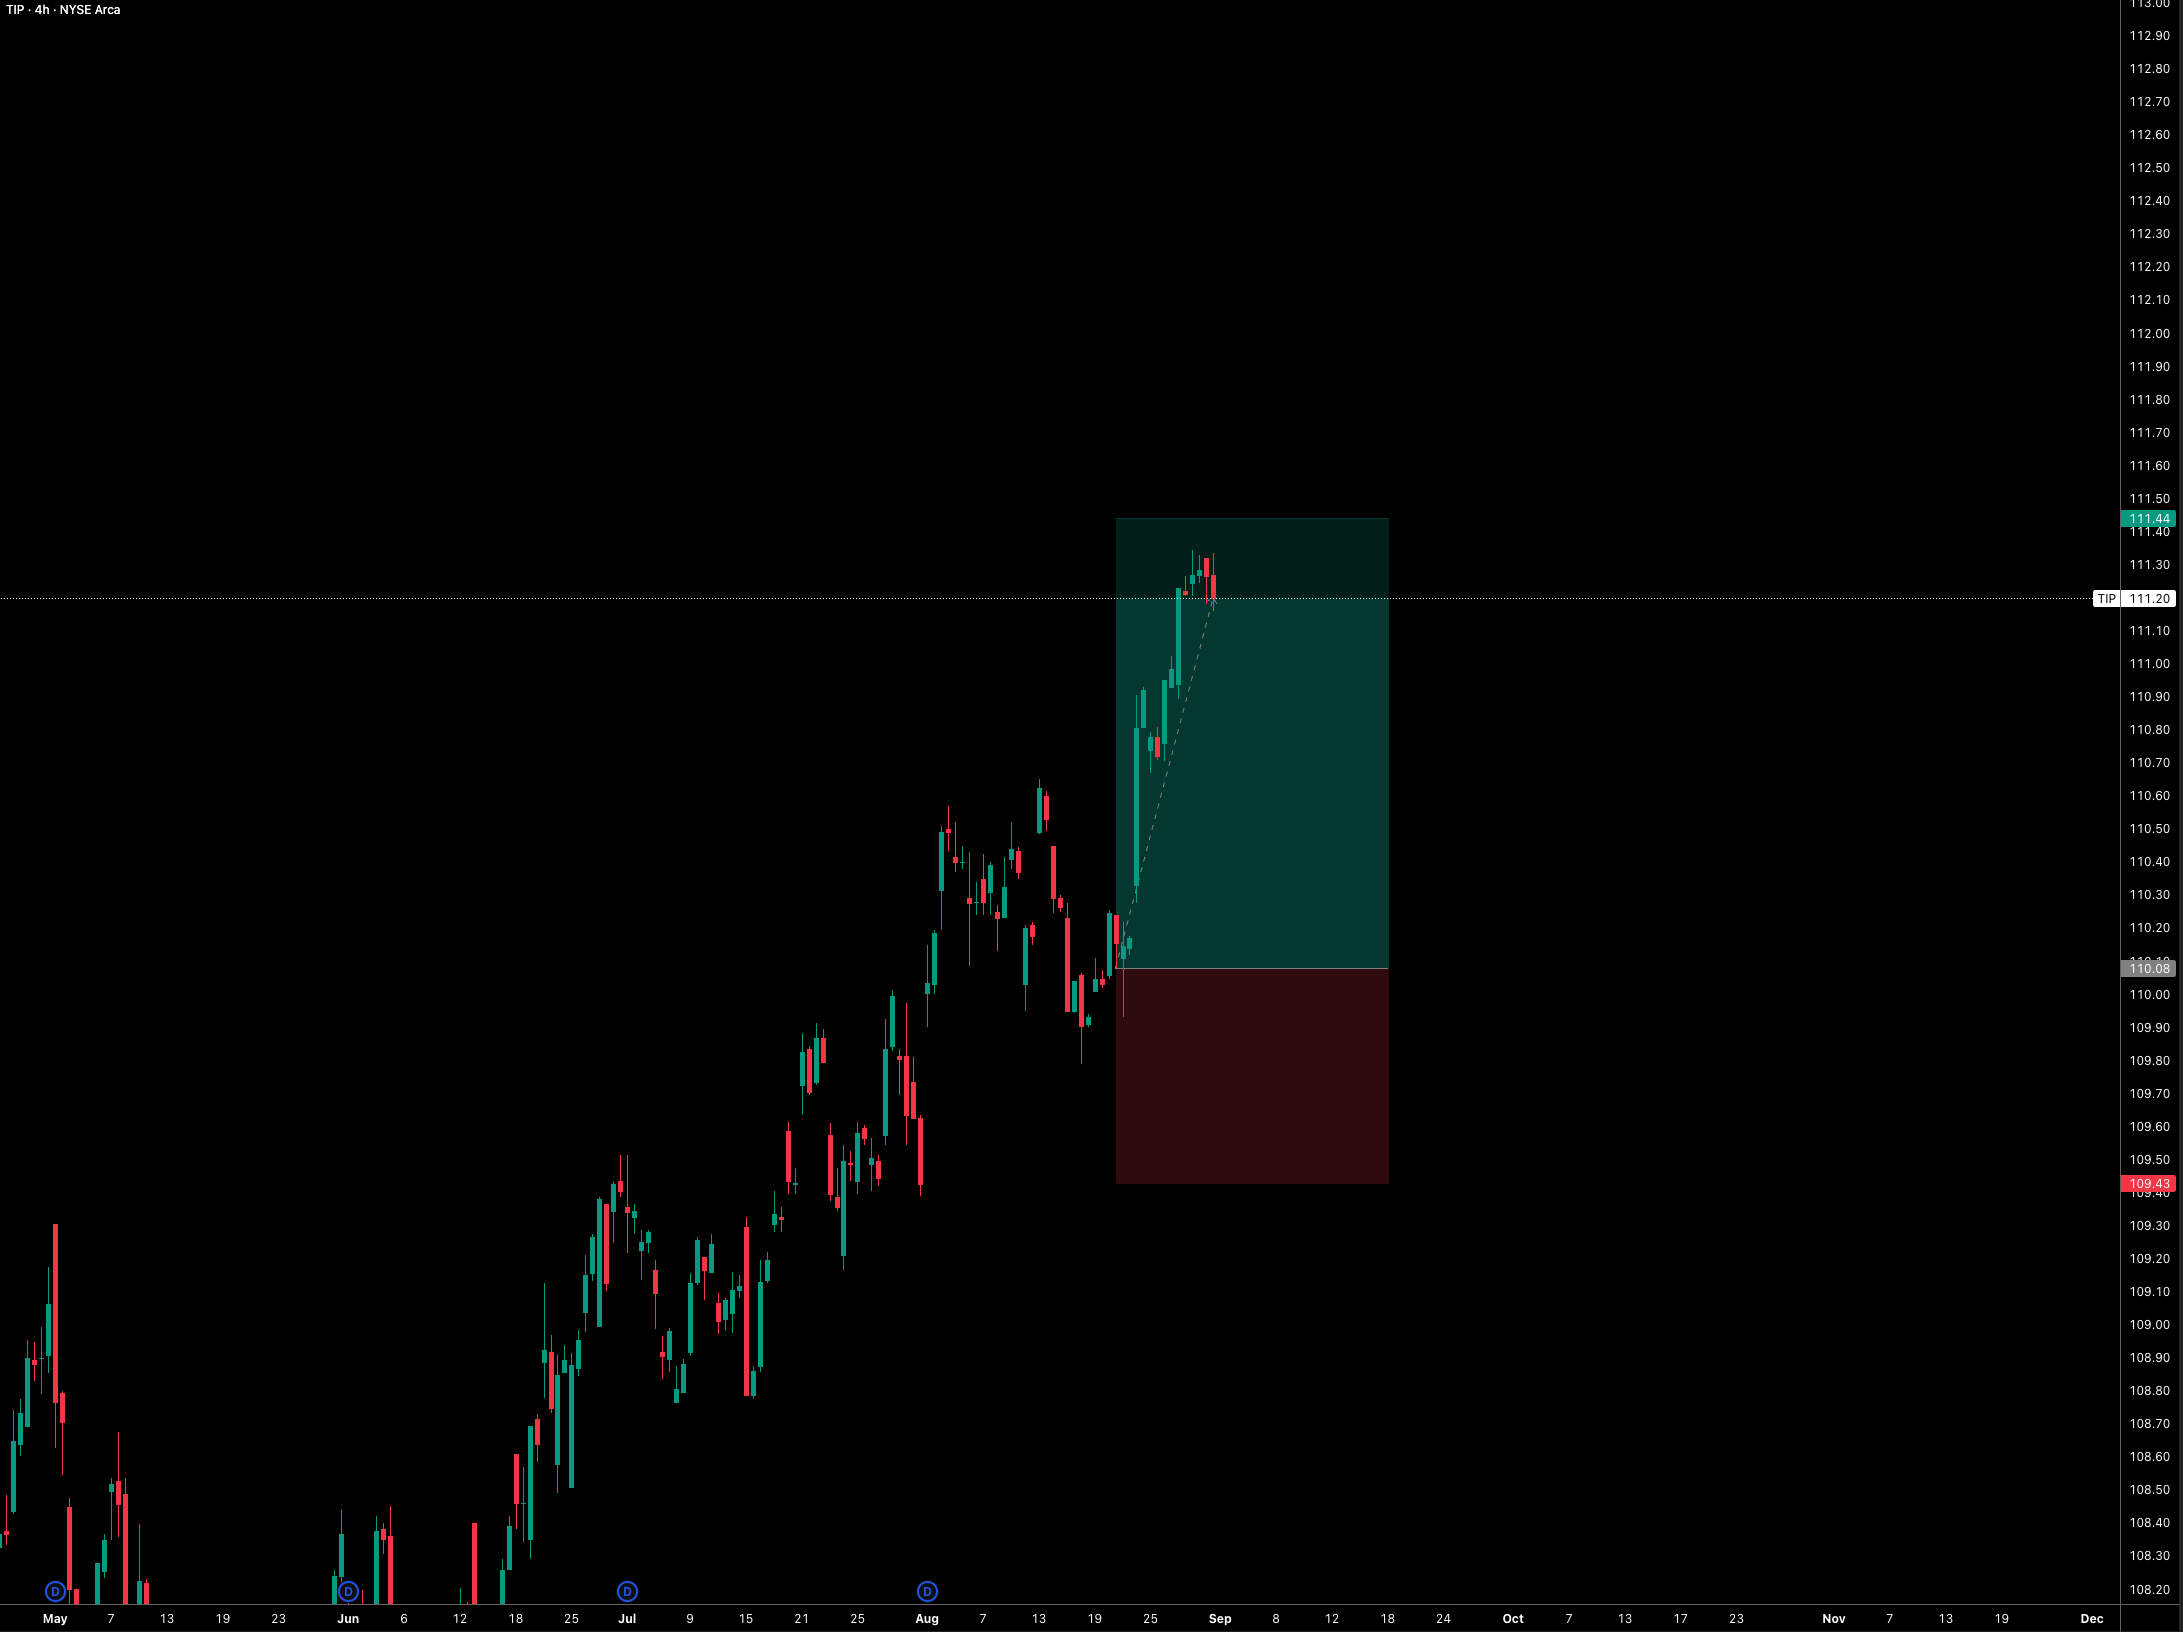
TIPS:
Report for reference:

The Case for an Inevitable Market Downturn
So I’ve laid out where we are in the regime right now, but at some point this regime must come to an end, so whats next?
Here’s the situation in quick summary before I lay out the scenario:
The Fed calibrates lower despite solid demand and sticky inflation (2.7-3.5% as a rough range). Financial conditions ease, risk appetite jumps, and inflation psychology hardens around ~3%. Cuts continue because of plumbing and risk-management justifications. Eventually, the inflation floor + asset-price froth force a late, larger tightening and the classic stop-go trap with a high risk of a market downturn after a melt up.
The Fed can cut into strength and keep cutting when plumbing worries and term-premium optics dominate but that same easing hardens a 3% inflation floor, supercharges risk assets, and sets up a late and larger tightening. First a melt-up, then the bill arrives.
Mechanism: how the mistake happens
1) Misdiagnosis of inflation mix.
The Fed interprets persistent inflation as mostly relative-price/supply (energy, tariffs, housing measurement lags) rather than demand. They look through while trimming rates to relieve funding strains (especially fiscal) and an elevated term premium. But easier front-end rates bleed into credit creation, housing, and asset prices which will re-stoke demand-pull components (services, wages) which are already sticky.
2) Path dependence + optics.
After the first cuts, the Fed is reluctant to reverse quickly. Then, employment remains healthy, bank stress quiets (not even visible atm), and the “cost of waiting” feels low. Markets celebrate through equities, credit, and housing re-accelerate (also not too slow right now), that then forces a quick policy U-turn politically and communicatively harder. Expectations stay firmly around 3% inflation as the new normal.
3) Financial-conditions channel dominates.
Even if long yields stay choppy, lower policy rates compress debt service, support risk assets, tighten credit spreads, and lift collateral values. The wealth effect and easier financing offsets whatever restraint remains from QT or term premium. Real rates drift down toward neutral or below, loosening stance in practice.
4) Wages + pricing power re-ignite.
A still-tight labor market + nominal GDP firm enable firms to maintain pricing power. Wage trackers stabilise or tick up and services inflation plateaus. Breakevens widen, and the inflation floor lifts. This would support current positioning laid out in the last report.
Timeline possibility
Q4 2025: 50bps of “insurance” cuts with communication stating calibration, plumbing and term premium offset. Markets loosen (cuts can act like a mini stimulus), spreads tighten, equities rip and housing perks up. All while core inflation stalls 3%.
Q1-Q2 2026: Another 50 bps as growth holds. Breakevens widen; real yields slip fast, cyclicals and commodities lead. Talk of “no landing” resurfaces and everyone realises how far behind the curve the Fed are.
Q3+ 2026: Inflation sticks (economy now realises how present it is), long end sells off gradually and the Fed’s credibility questioned. They’re then forced re-tighten (unlikely) or just give hawkish forward guidance and pause cuts, then risk in the system rises. That’s the danger window for a drawdown.
Historical echoes
I touched on osme previous scenarios last report, but for reference:
1967–69: Fed eased prematurely in 1967, then had to tighten aggressively as inflation climbed and growth held up for a while before recession, proto stop-go policy.
1971–74: Policy loosened with inflation still high (plus oil shock); inflation became embedded, forcing much tighter policy later, the cautionary case.
1980 (Volcker’s “go–stop–go”): Brief easing and credit controls, inflation stayed hot, swift reversal to severe tightening.
1998 (LTCM insurance cuts): Inflation was low (unlike our setup), but it shows how insurance easing can fuel a powerful risk rally that later ends badly when policy must normalise.
Market playbook: phases & positioning
Phase A: Melt-up (cuts begin):
Rates: Bull steepening continues (front-end rallies), then bear-steepening risk as breakevens widen.
Positioning ideas (similar/same as last report): Receive front-end (2y OIS/SR3) early; run curve steepeners (2s10s, 5s30s) via spreads & BEI wideners (TIPS vs nominals).
Equities: Multiple expansion & EPS tailwind leads to growth & cyclicals rally while small caps pop on easier financing and energy/materials ride reflation.
Factors: High beta, value-cyclical, commodities, financials (net interest margin relief) over mega-cap duration for a while.
Credit: HY outperforms IG at first, spreads grind tighter, issuance window reopens.
USD/FX: Dollar softens initially (policy differential), EM relief short-term.
Commodities: Crude, copper, and ags find bids, gold can rally on falling real rates & credibility doubts.
Phase B: The credibility wobble (inflation won’t fade):
Rates: Term premium rebuilds; belly sells off; breakevens stay wide. Curve chop increases.
Positioning shift: Rotate from receiving front-end to pay belly (3–7y), hold steepeners.
Equities: Leadership rotates to inflation beneficiaries (energy, miners, industrials). Mega cap duration starts to lag as long rates creep up. Dispersion rises.
Credit: HY starts to underperform as funding costs and refinancing wall loom, IG OK but duration pain if long rates back up.
USD/FX: The dollar “smile” risk if global inflation jitters & higher US term premium spark risk-off, USD re-strengthens, squeezing EM.
Commodities: Broad reflation persists, gold stays bid if policy credibility erodes (even with higher long yields).
Phase C — The reckoning (late tightening):
Rates: Hawkish pivot or QT tweak, real yields jump & curve bull-flattens into slowdown fears.
Equities: After a late-cycle melt-up, multiple compression & tighter financial conditions can trigger a drawdown (especially in leverage sensitive small caps and long duration tech).
Credit: Spread widening and fallen angel risk, loan market stress shows up first.
Cross-asset correlation flips: Stocks and bonds fall together on inflation shock later as growth buckles, the classic negative stock–bond correlation reappears.
Why this siutation is a possibility
This can happen because the Fed and the market are basically looking at the same painting under very different lighting. The market’s message is rising inflation swaps, tight credit spreads, solid growth showing that demand is alive and kicking, and the inflation floor is creeping higher. The Fed, though, is still telling itself a different story that inflation is “transitory-ish,” driven by tariffs, energy, and lagging shelter measures, and that underlying trends are easing. From their lens, cuts are just a calibration tool that is offsetting term-premium shocks and keeping the plumbing intact, not a green light for stimulus. But here’s the problem, even those “plumbing cuts” inevitably loosen financial conditions whether the Fed likes it or not. Check 2Y inflation swaps below:

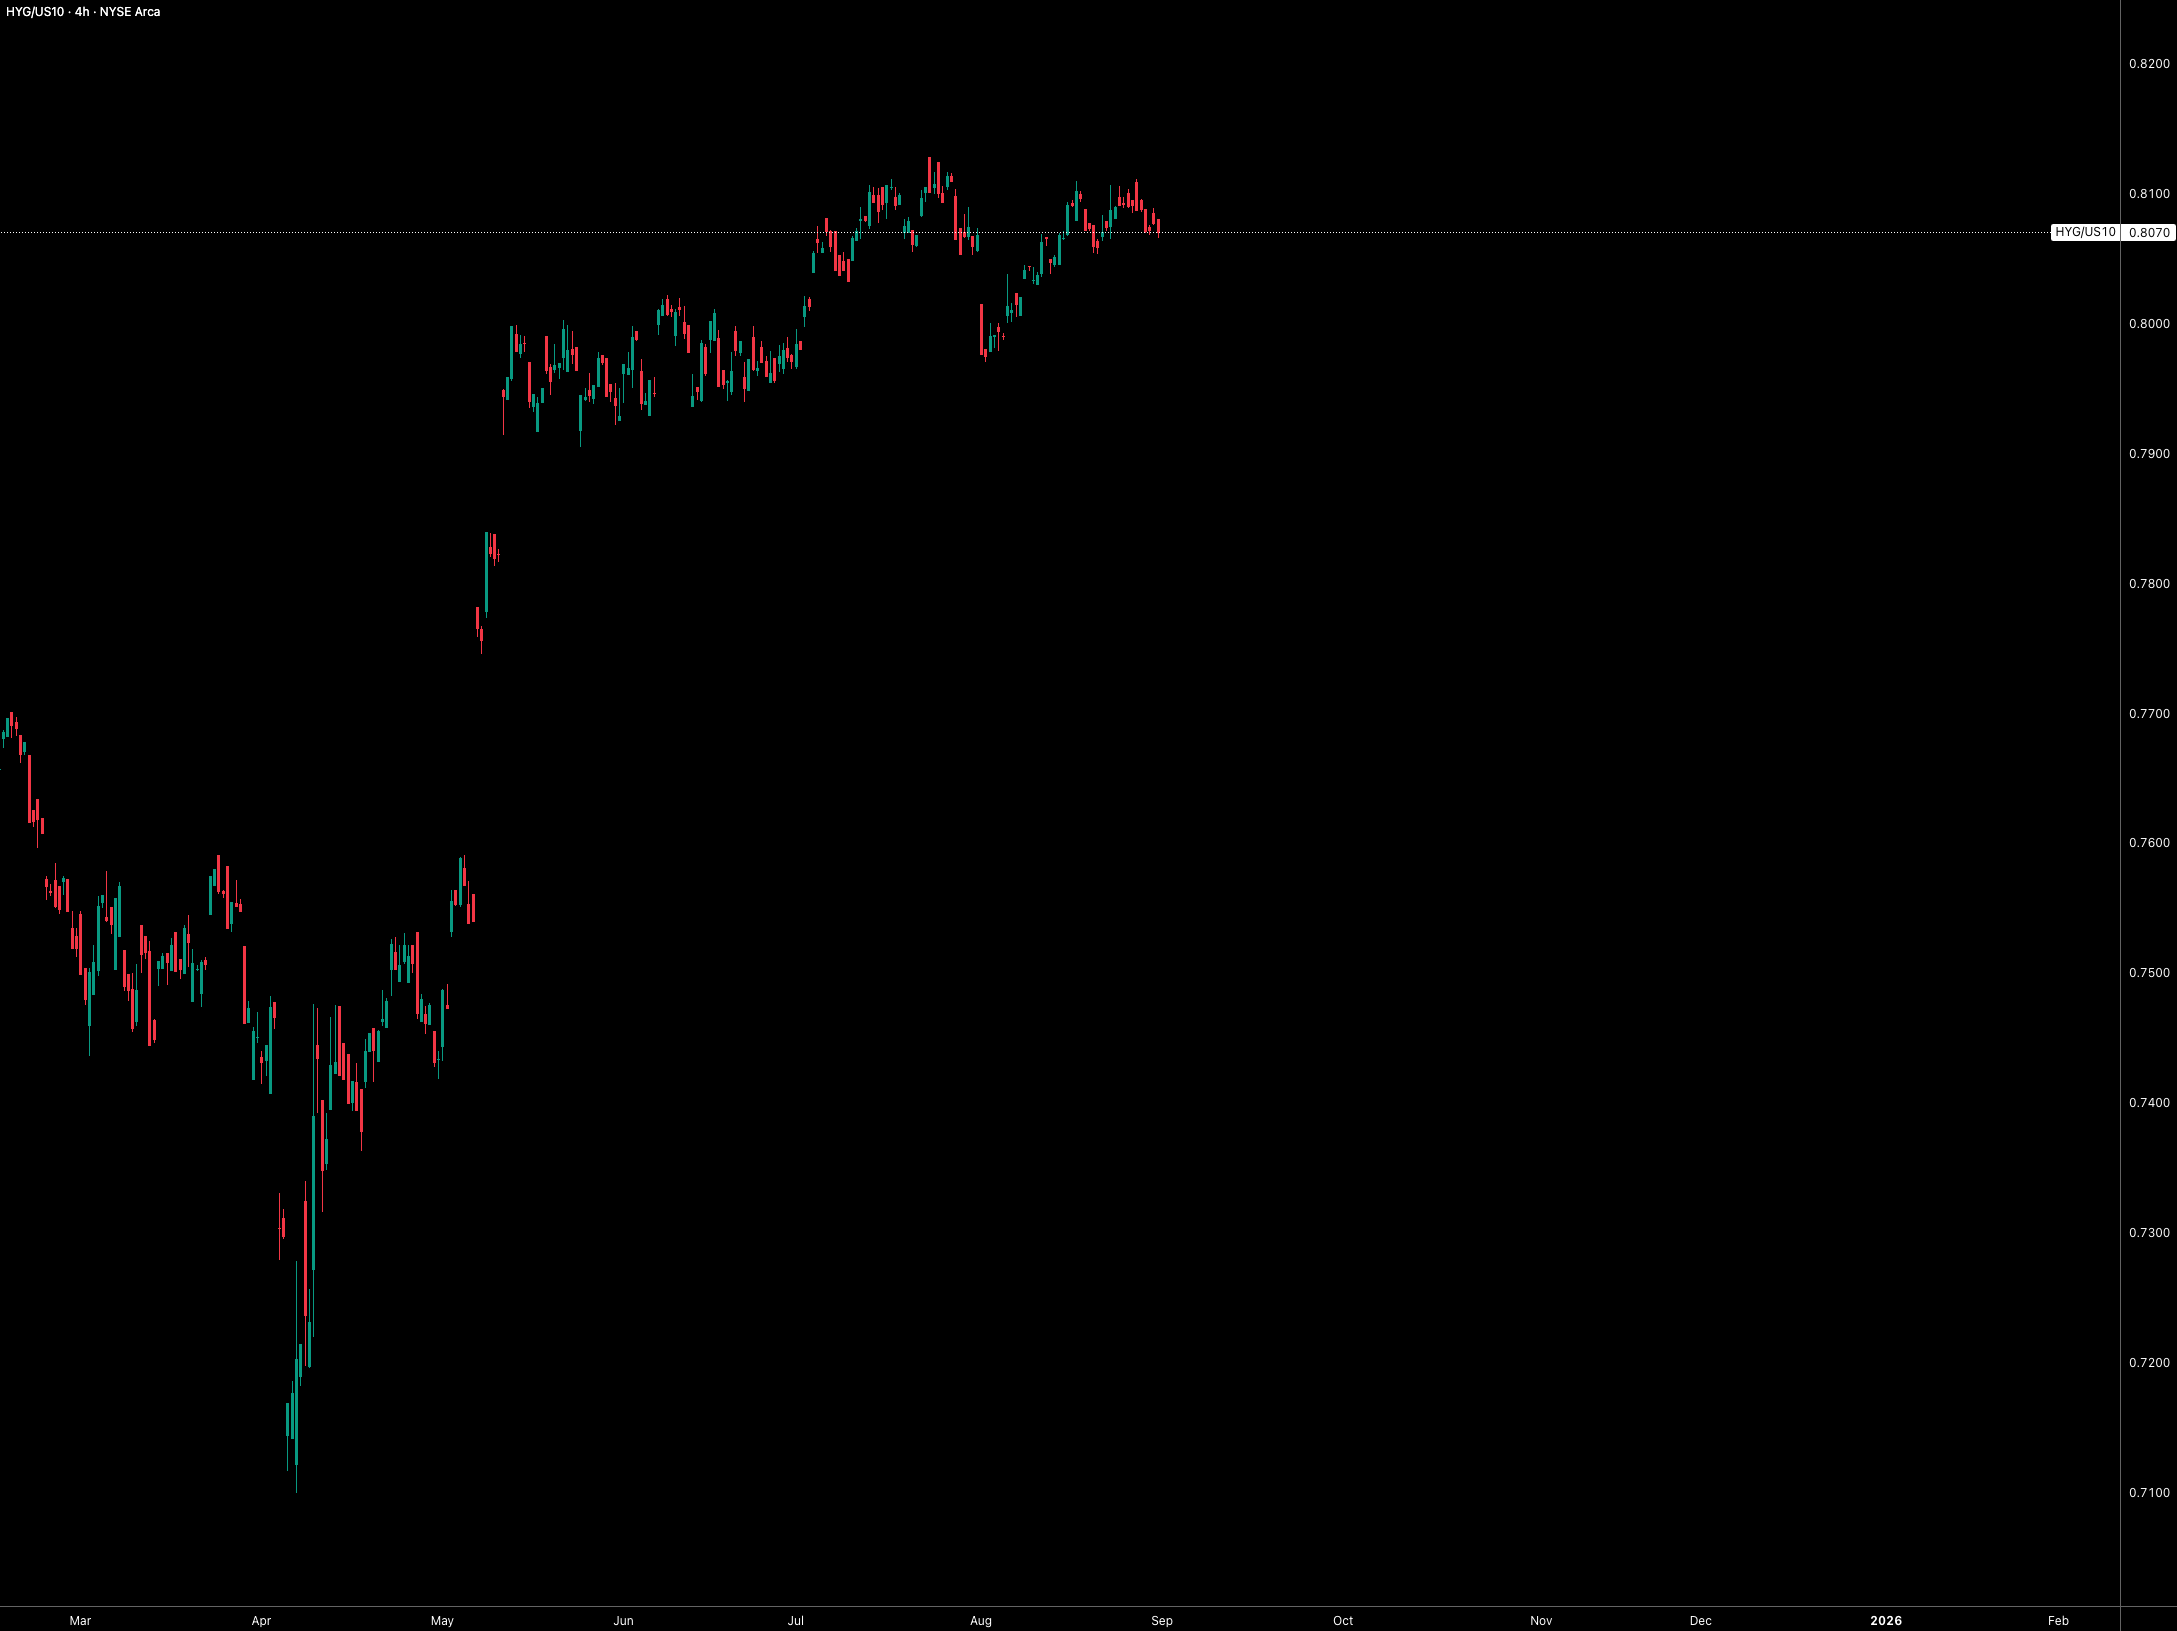
And you can see it in the market setup. Duration risk is where the stress lives now, not credit. The 10Y has to keep absorbing every ounce of inflation premium while high-yield trades like nothing’s wrong. Credit vs duration below, rallying as the duration risk rises fast vs credit risk:
That gap reinforces itself, tight spreads and buoyant equity collateral keep money cheap, support hiring, and push nominal demand higher, which keeps inflation sticky. On top of that, bond vol is collapsing to 2022 levels:

When rate vol falls, carry trades and risk-parity funds pile in, investors step out the curve, and suddenly financing conditions get easier. The Fed thinks it’s just “calibrating,” but what actually happens is a backdoor easing across credit, housing and equities.
Now, you and I both know how this script tends to play out. First, cuts justified as a tweak to “keep things balanced.” Then, risk appetite takes off, credit flows, housing and commodities catch a bid, and inflation expectations quietly start to drift higher. The Fed insists “underlying inflation is trending down,” because the official data (with its lags and trims) still looks tame. But markets price the reality faster. At some point, inflation swaps and breakevens say what everyone’s thinking: the floor is hardening around 3%.
And then, oh, that’s when the bill shows up. The Fed’s credibility gets questioned, real yields start to climb, curve trades flip, and spreads blow out from ultra-tight levels. All the vol-selling, carry trades, and easy liquidity bets unwind in a hurry. The early phase feels like a no-landing melt-up, stocks higher, credit spreads tighter, commodities strong but the second phase is the reckoning where multiples compress, credit reprices, and the cycle resets the hard way. It works… until it works too well.
As always, re-read and take notes. Positioning has played out wonderfully so far.
Yes great addition ,great write up
Just a question the US2yr US10 yr and the 5s 30yr charts you use ,I can’t find on TradingView ,I can only see individually
is it an upgraded package ,
also the steepener flattener indicator is great but I can’t find it .
Many thanks