
Positioning: A Macro Deep Dive
Liquidity, Growth, Inflation: The Playbook for Positioning

Hey everyone,
Funny how clarity often comes when you zoom out, both in life and in markets.
The noise fades, the bigger picture sharpens, and you realise discipline is really just protecting yourself from distraction.
It’s in that space where the best decisions get made.
Let’s get into it.
Liquidity, Growth, and Inflation: A Macro Deep Dive
This note is going to be a macro deep dive into the main moving parts of the US economy (liquidity, growth, and inflation) and how to be positioned effectively. These three factors drive markets, and right now, all three are abundant.
Liquidity
Let’s start with liquidity, because it’s the clearest driver of what we’re seeing in markets today. Fiscal liquidity drivers dominate price action: net reserves/TGA/RRP + fiscal deficits + buybacks > QT/issuance drag as well as private liqudity (the more obvious) . Growth is plentiful across the financial system, and that’s showing up most visibly in the Russell 2000 outperforming the Dow Jones since early April. Liquidity always flows down the quality ladder, and since spring we’ve seen that shift into high-beta equities. In other words: money is chasing risk.
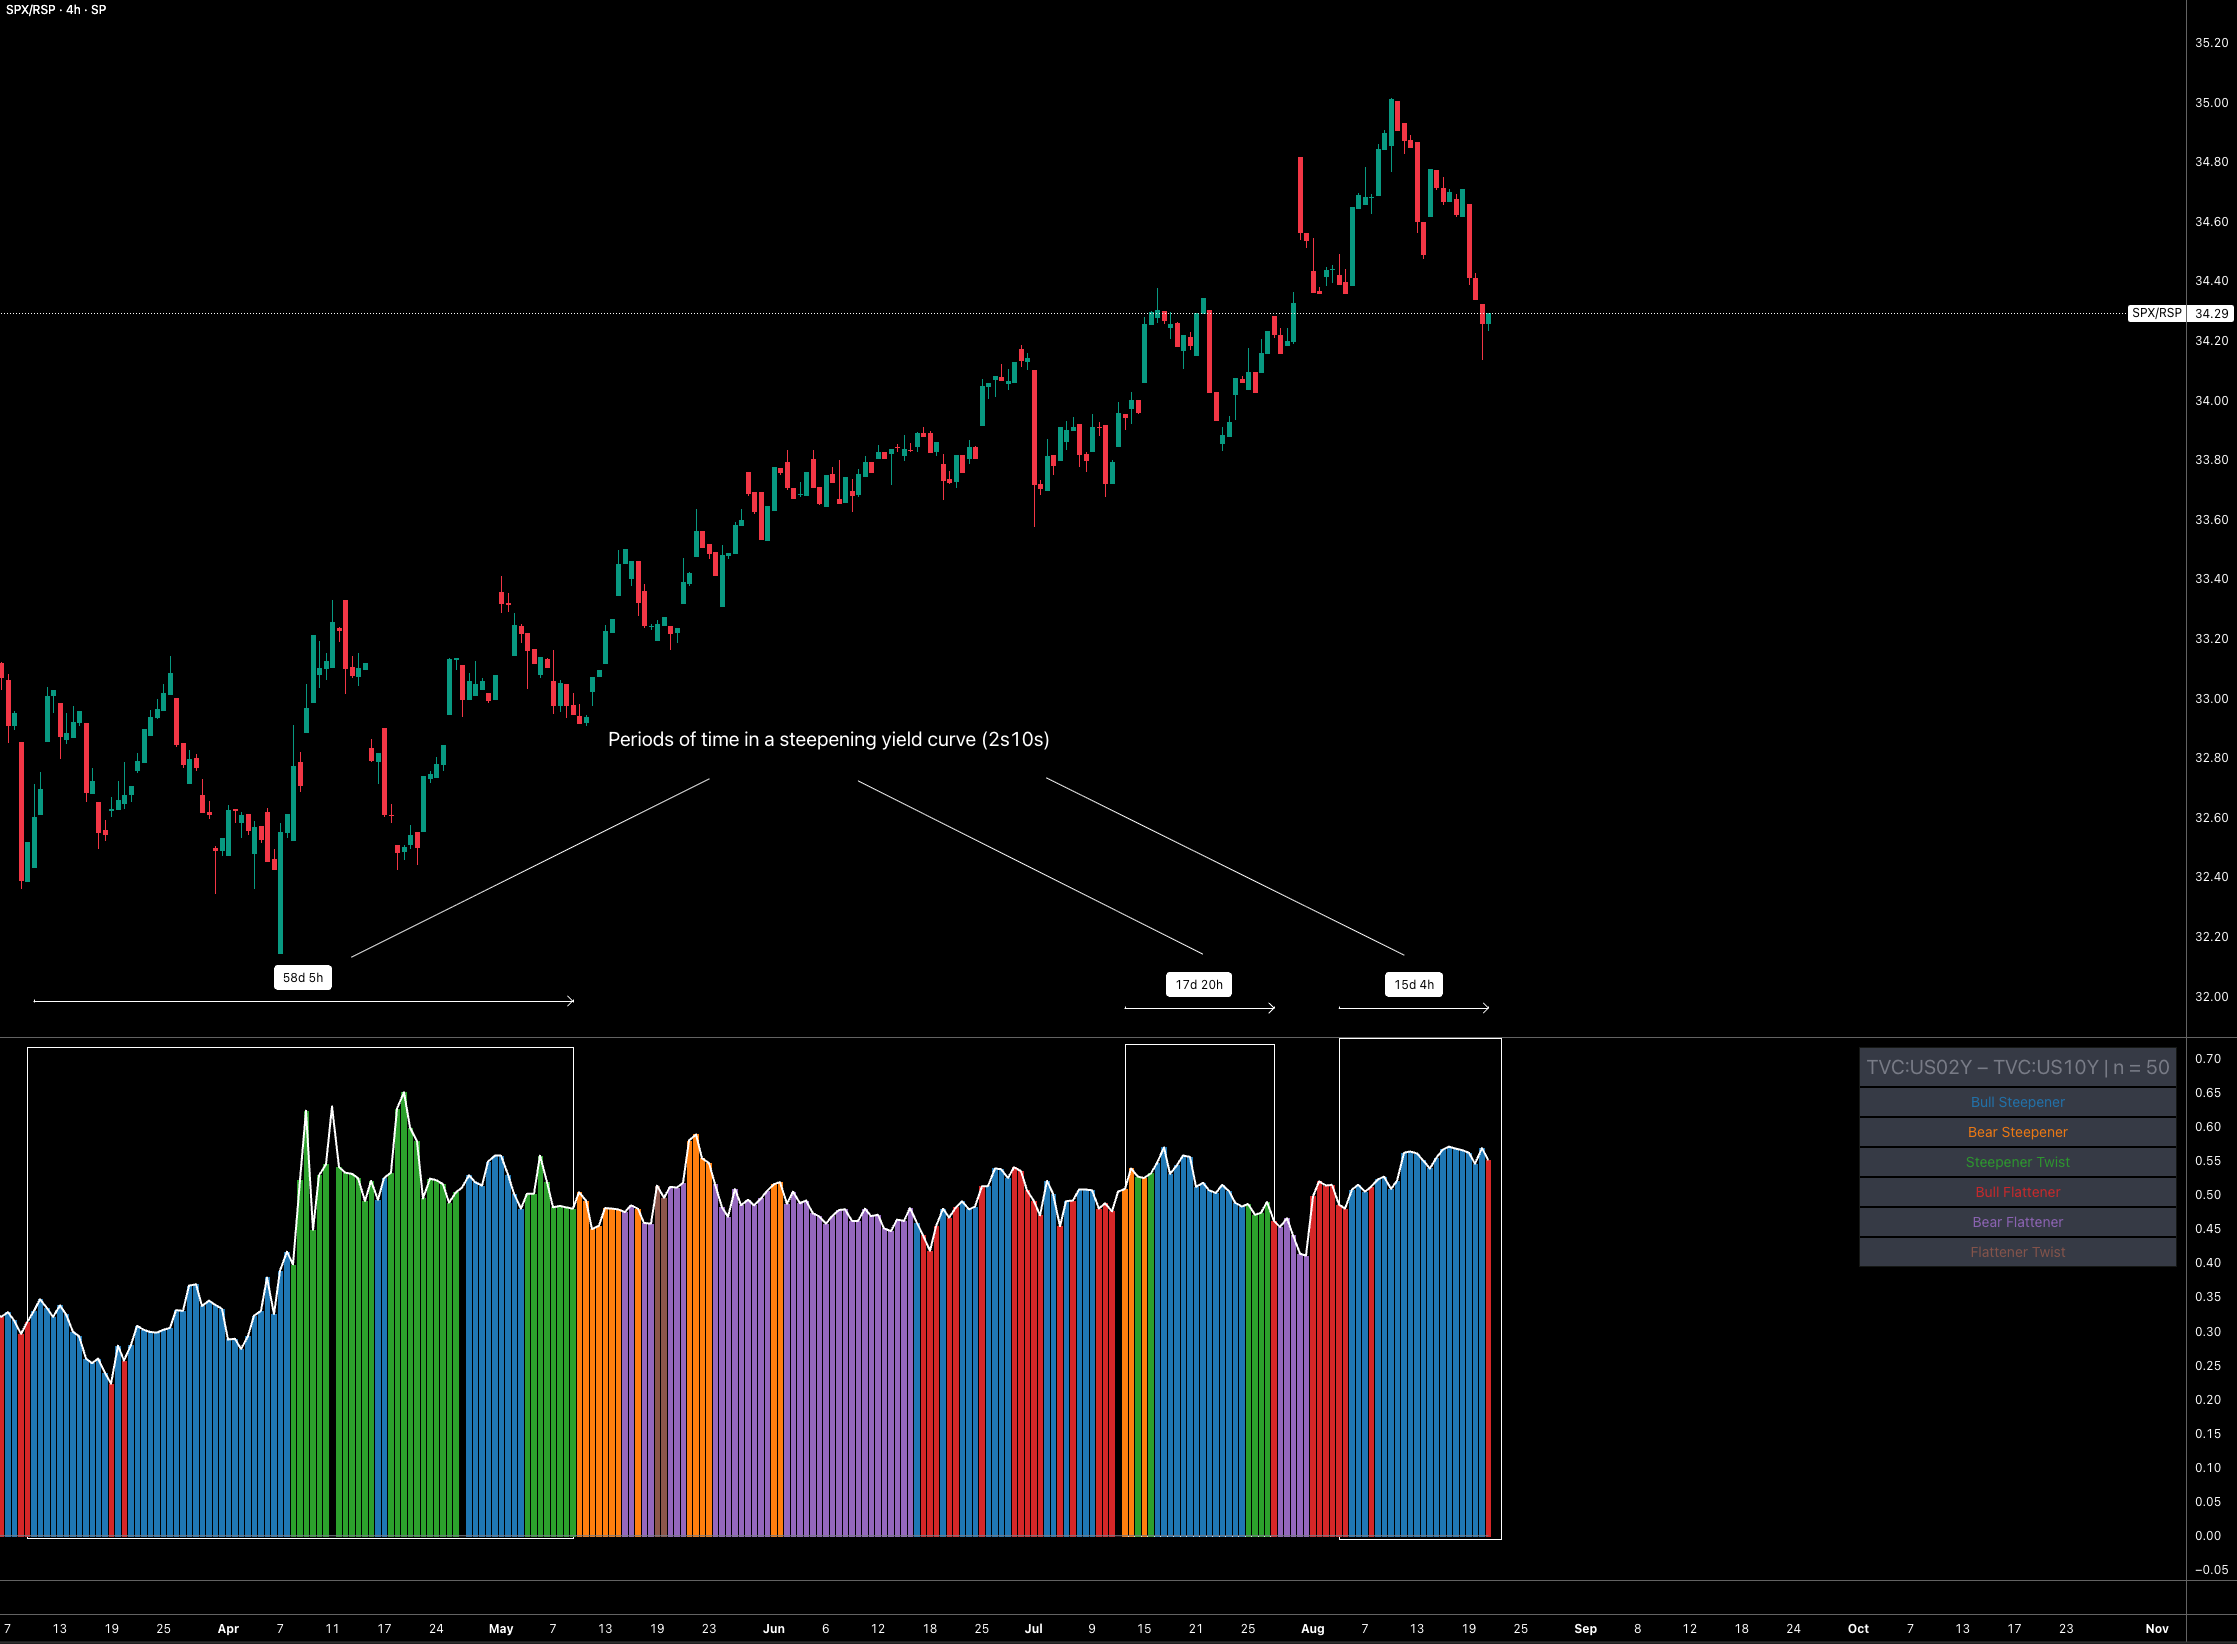
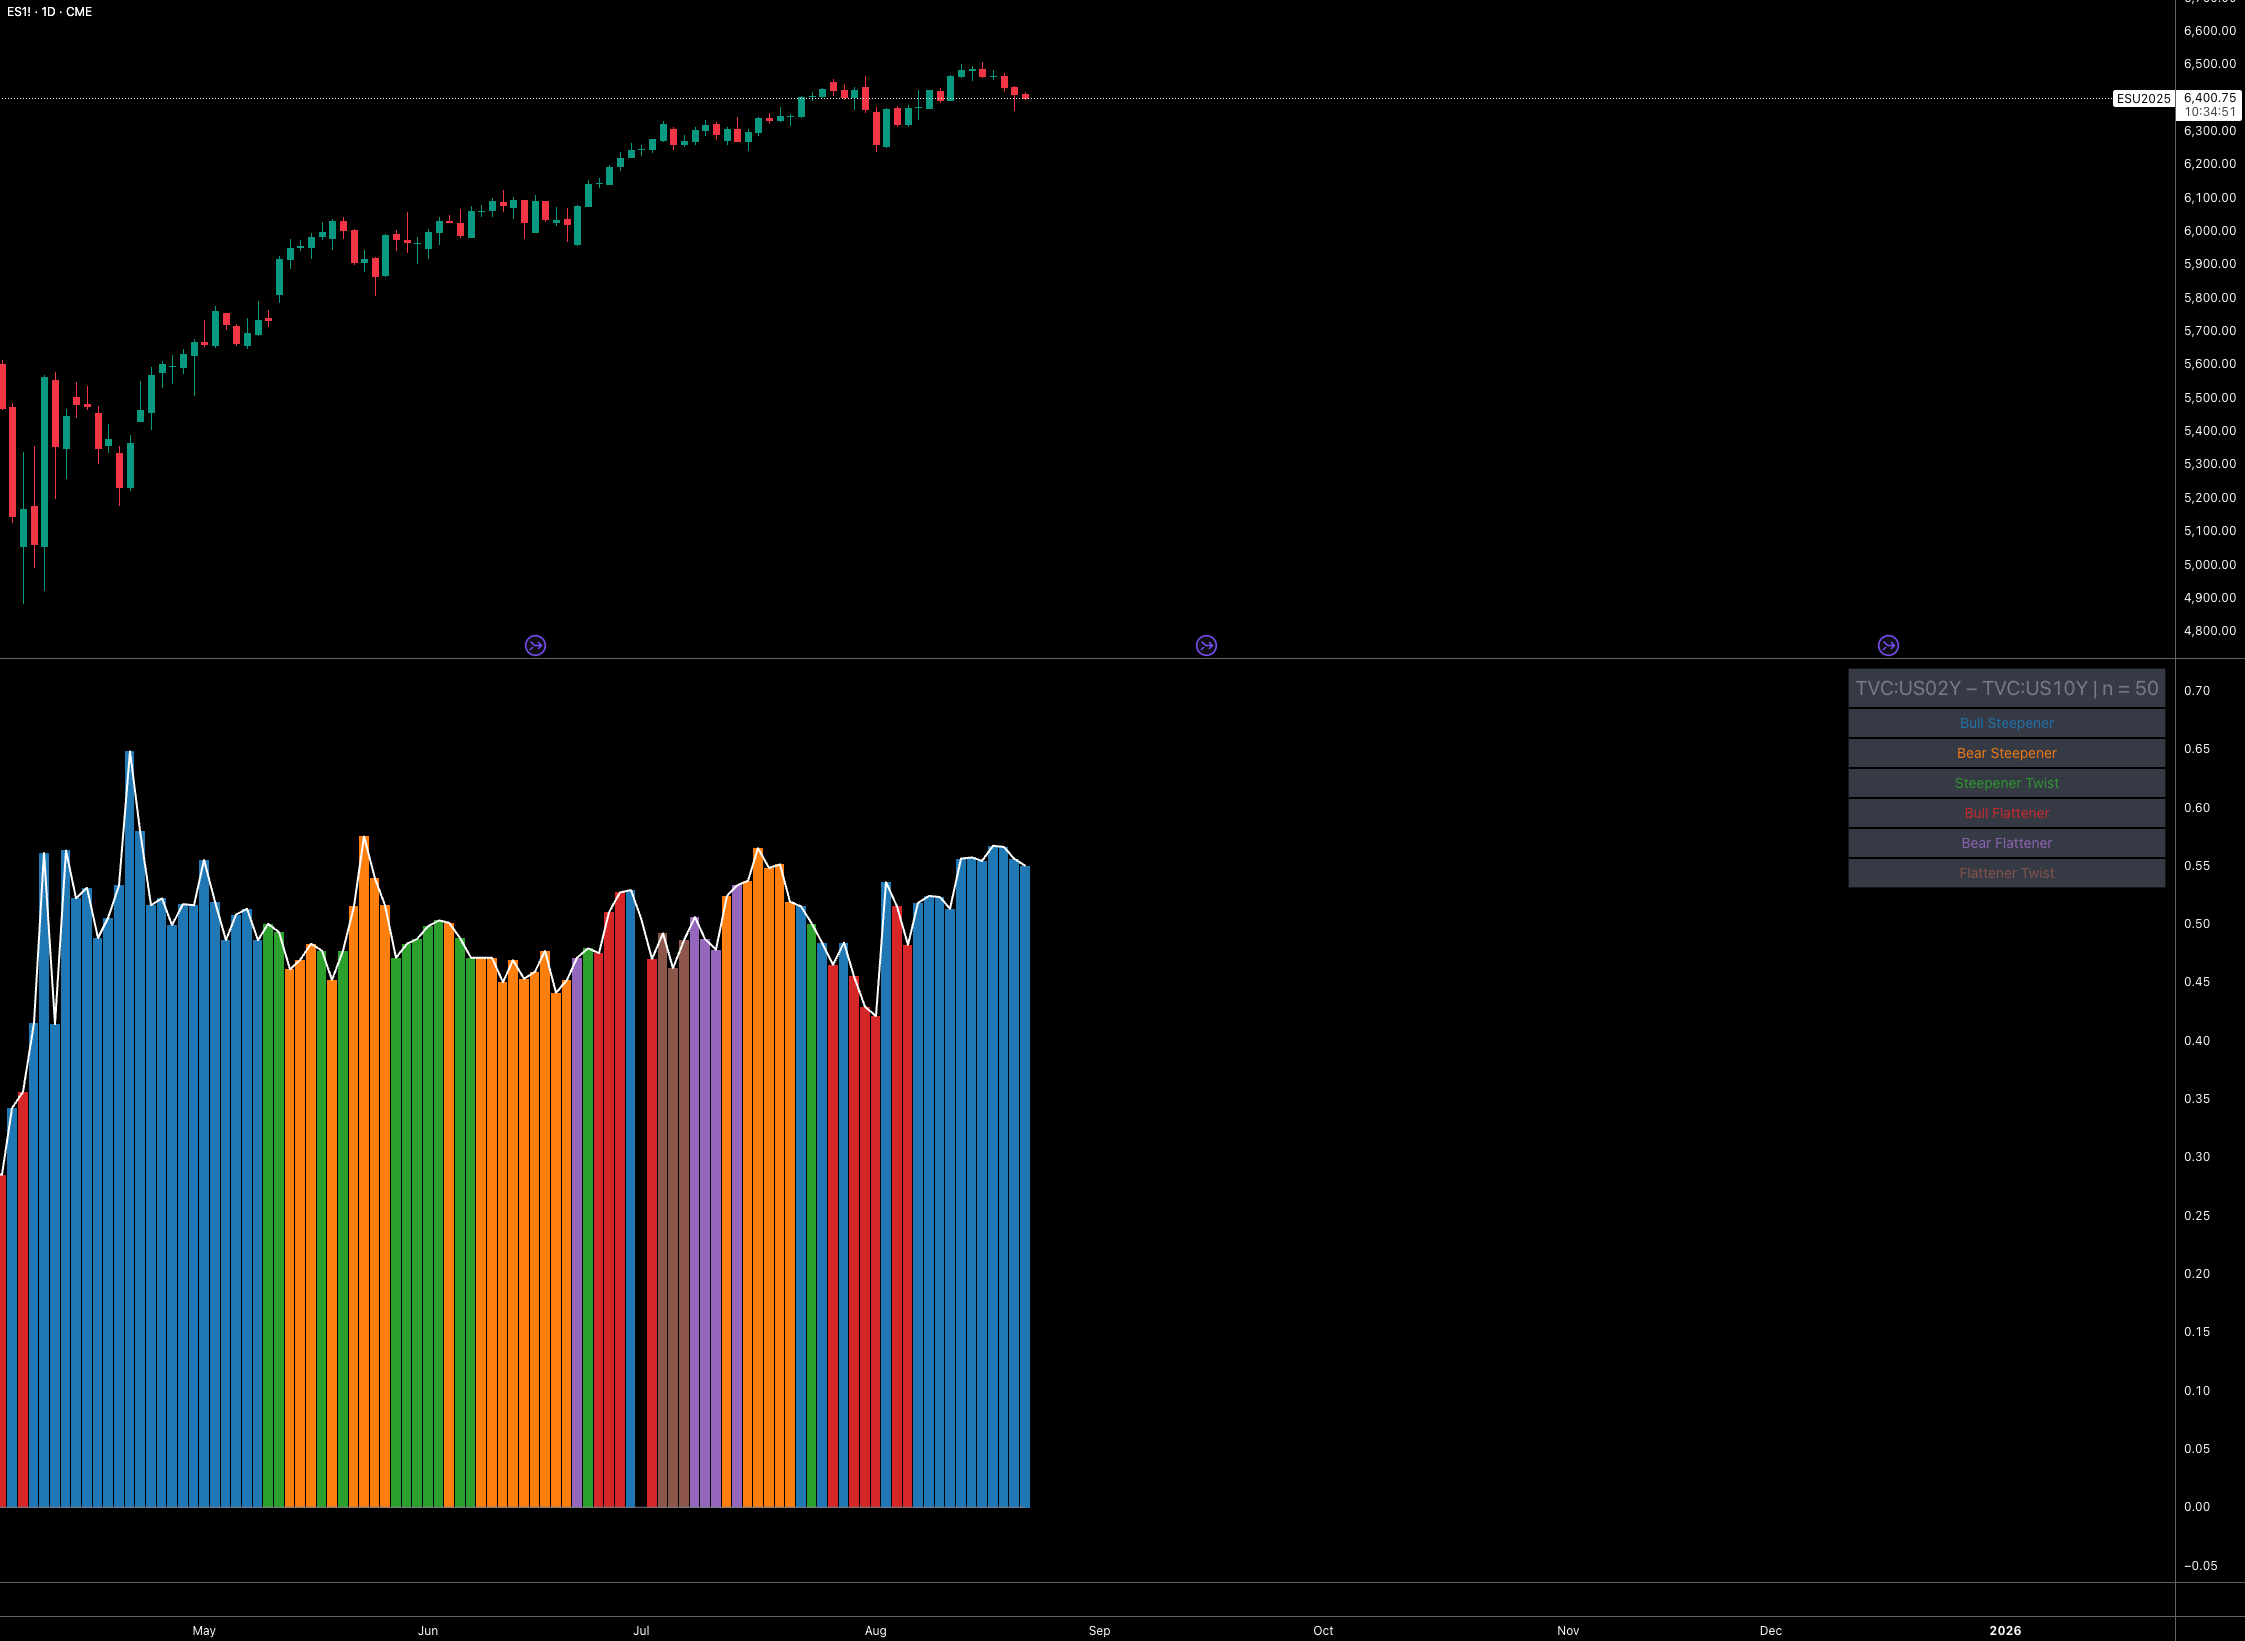
The 2s10s curve has also been steepening, largely on expectations of stronger growth in the underlying economy. That steepening is fueled by liquidity.
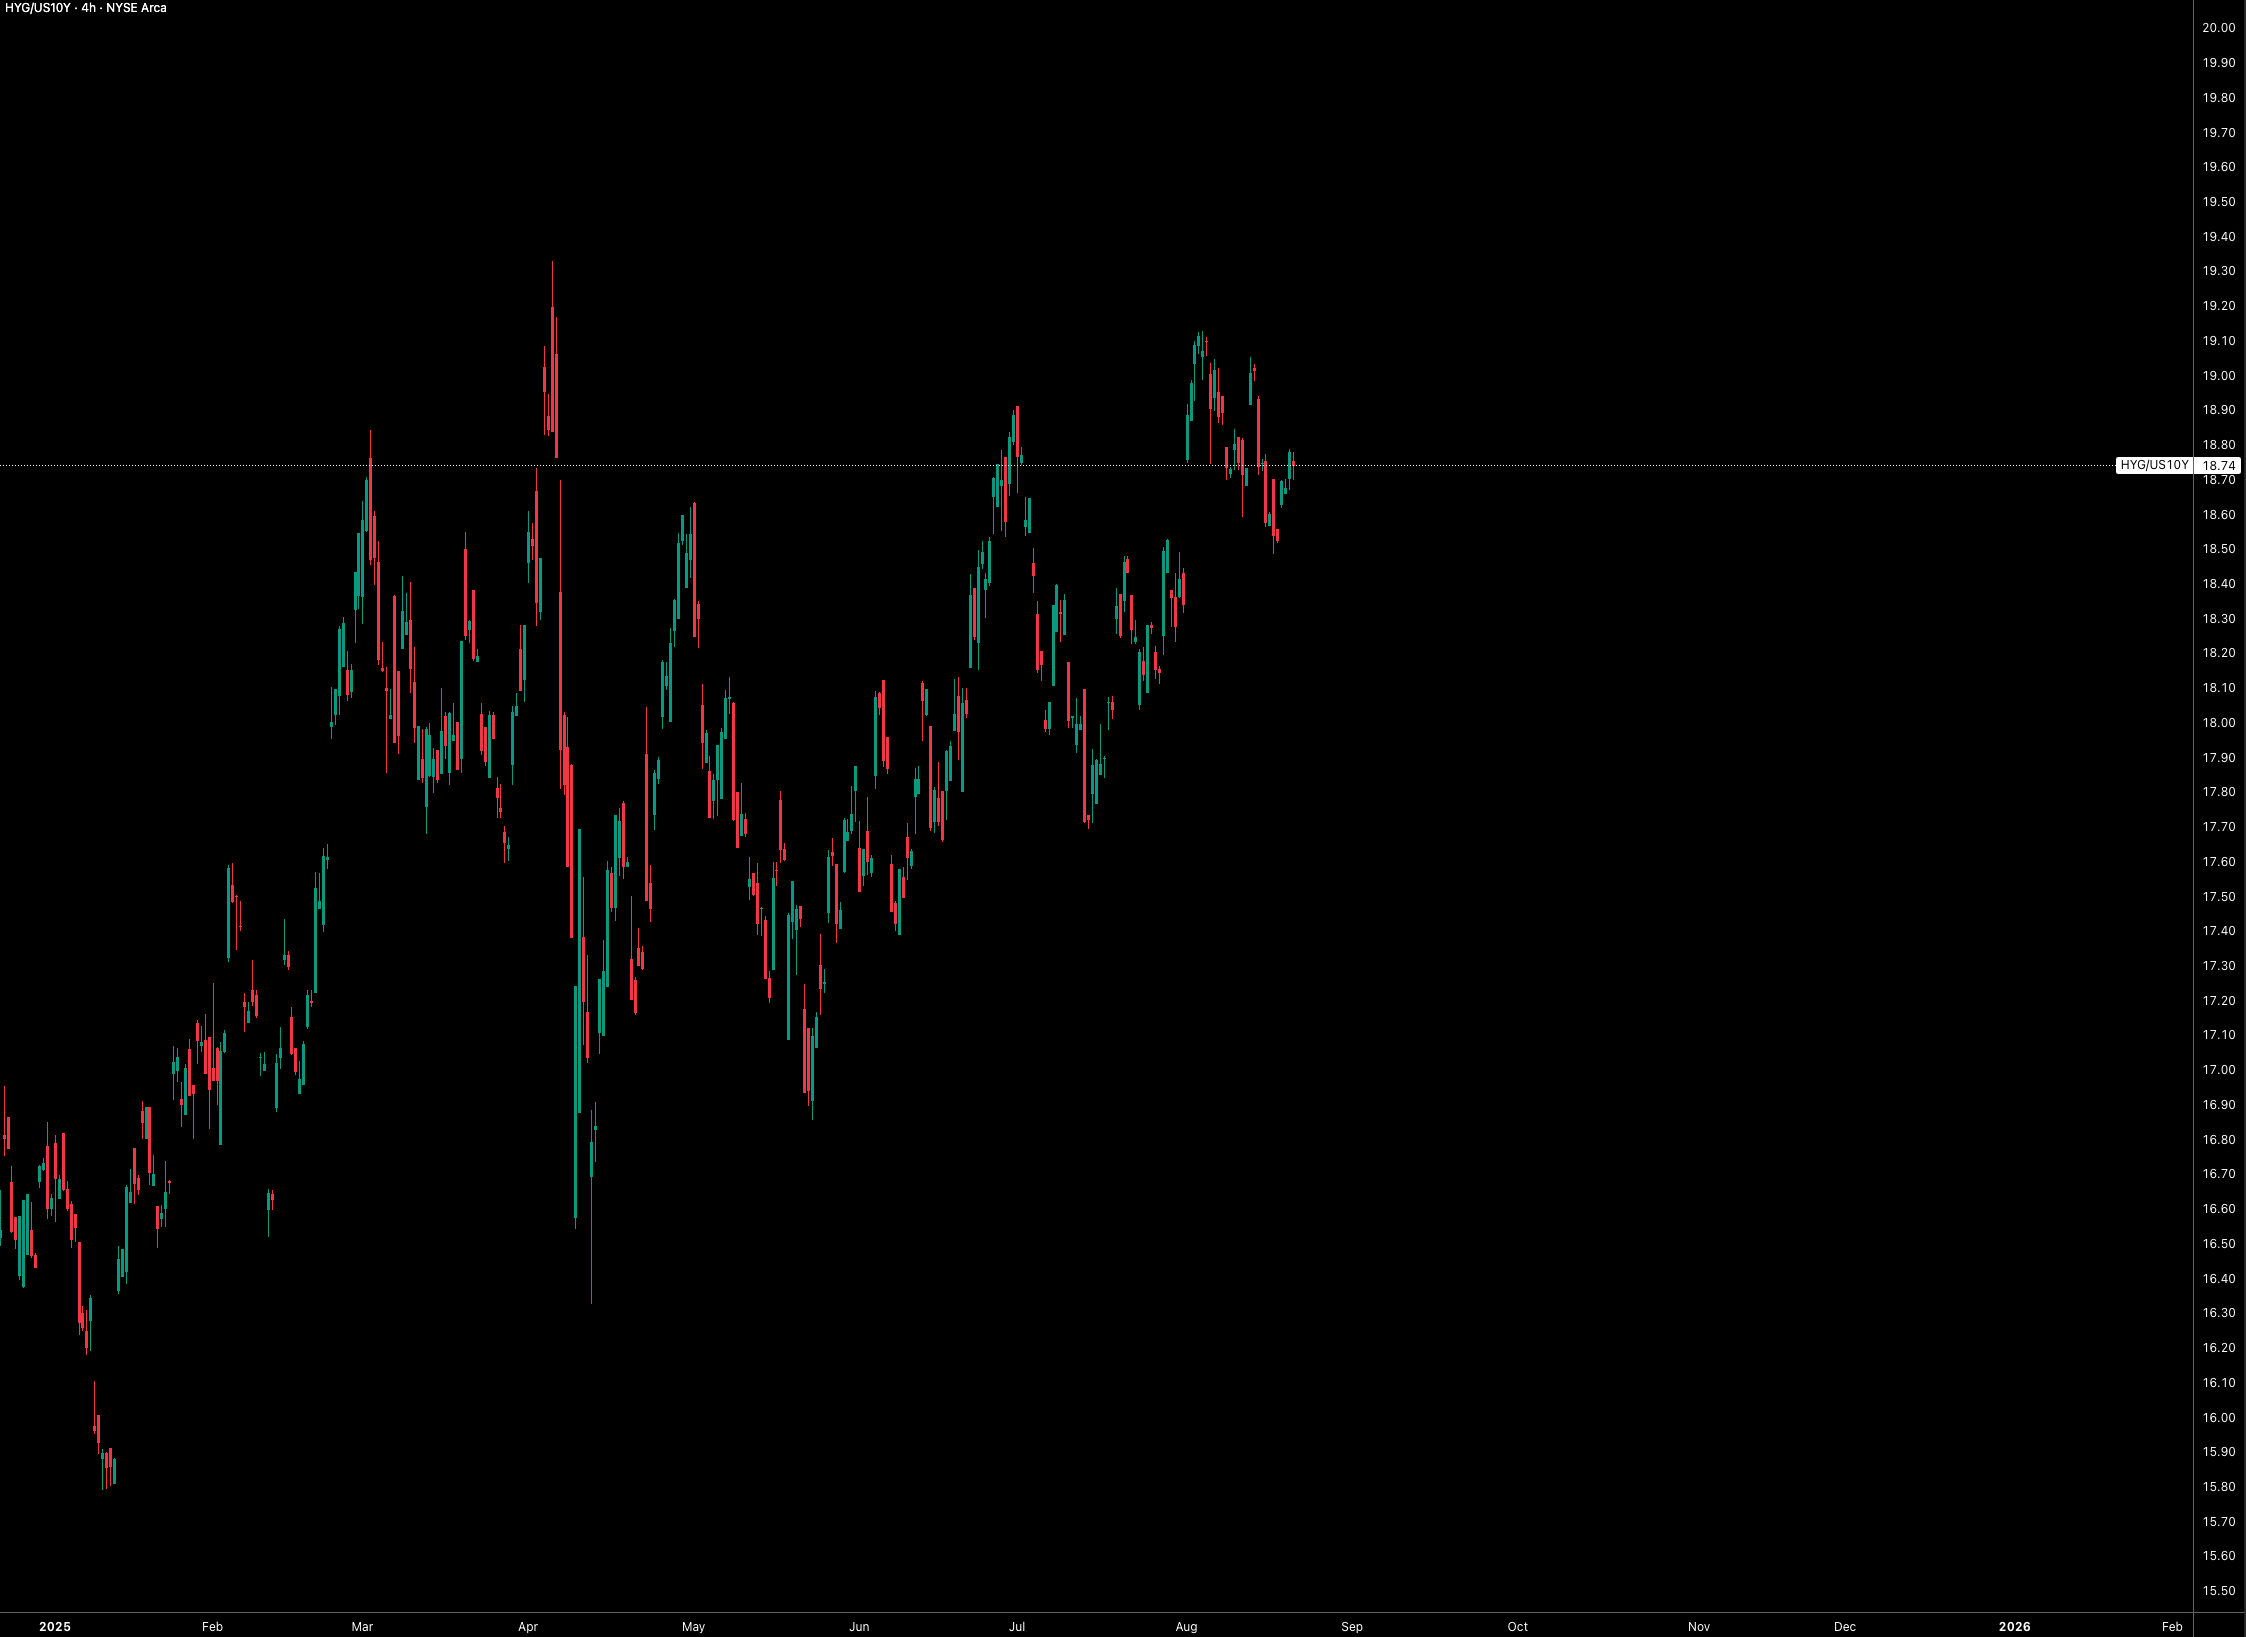
Stress gauges are predictive, SOFR‑OIS, HY/CDX IG, MOVE will flag trouble early enough to de‑risk. One way this liquidity shows up is in capital rotation into high-beta. But the more telling sign is how calm “stress gauges” have been. Credit spreads remain tight, and the SOFR-OIS spread (which is the earliest warning sign of interbank funding stress) shows no tail-risk at all. In short: the system is swimming in cash. I do understand that SOFR‑OIS misses non‑bank stress (private credit & insurers) but I’m focused on interbank in this section. Chart from Capital Flows:
Now, could this change with a shock? Absolutely. Spreads are calm until they’re not. If credit spreads suddenly widen due to a geopolitical shock or a sharp Fed pushback, equity vol will spike, positions will unwind, and the liquidity story could flip quickly. But until then, sitting on cash just means missing upside. If the interbank market isn’t flashing stress, how can we claim liquidity is an issue in the open market? We can’t, not yet. A risk to liquidity is credit‑led slowdown (private credit/CRE) become the shock; credit risk becomes bigger than duration risk, then equities underperform even with stable breakevens.
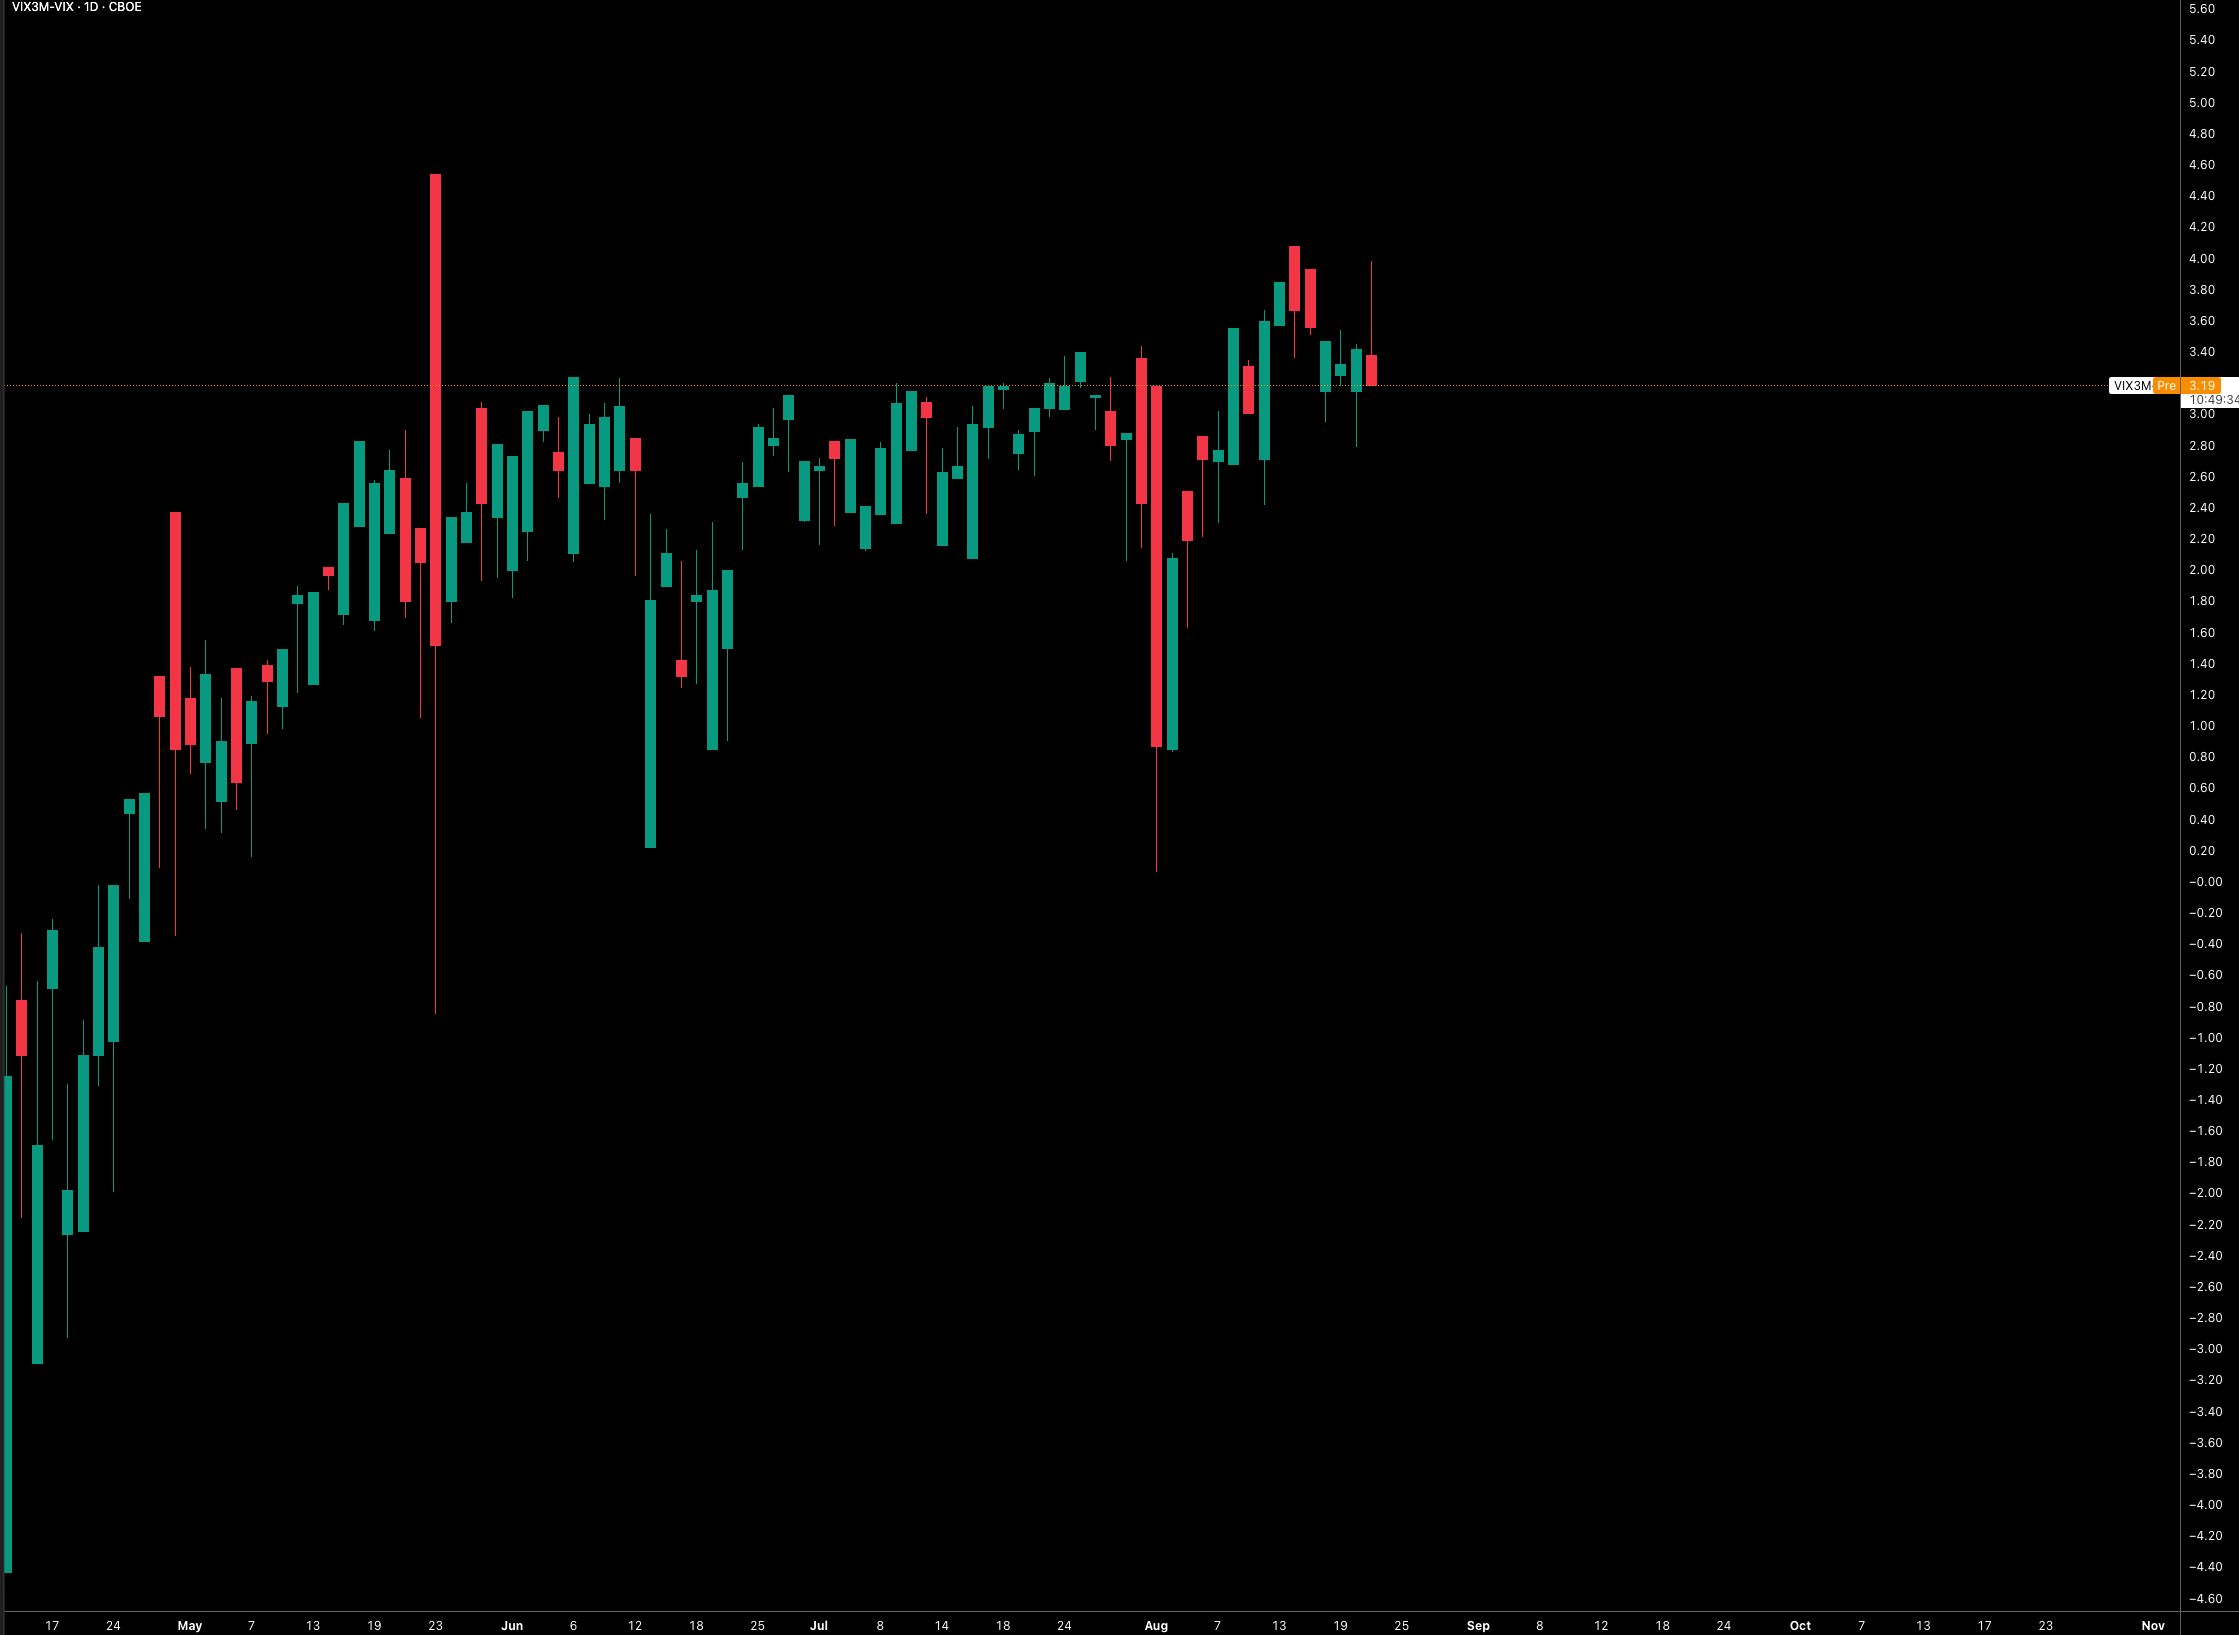
Liquidity also intersects with volatility. In practice, volatility only truly matters when it breaks liquidity. Right now, three-month implied vol shows very little stress, while front-end (one-month) vol is a bit more elevated. But crucially, it isn’t feeding through to equities. Liquidity is abundant enough to absorb short-term volatility spikes. If it weren’t, we’d see bond vol blowing out, duration trading at a premium, and equities cracking hard. None of that is happening.
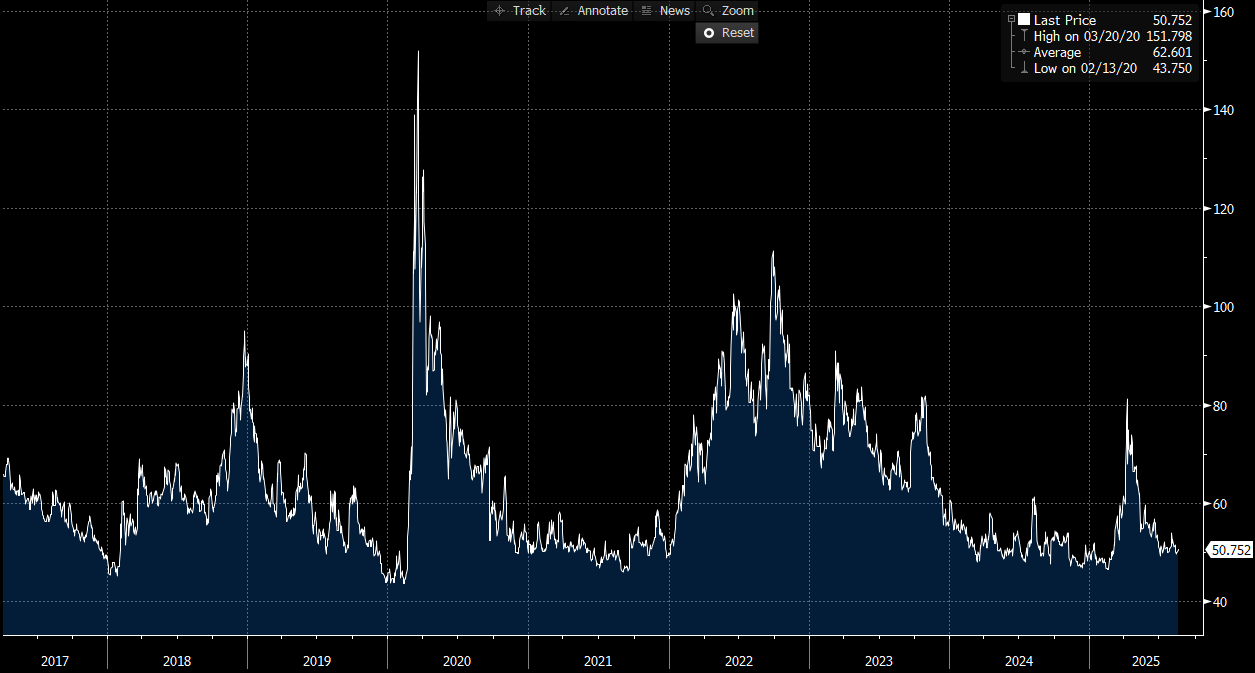
And as long as MOVE (Treasury volatility) behaves, liquidity is intact.
It’s always worth asking: what is the market actually pricing? Right now, it’s clear: markets care more about duration risk than credit risk. Why? Because growth is strong and inflation is sticky. Term premium is bigger than credit premium in this regime; credit is calm. That keeps fiscal issuance elevated and yields climbing, even as credit spreads remain calm. Think of past examples:
2017 reflation trade: Credit spreads stayed tight, but yields rose on synchronized growth and inflation.
2021–2022 reopening: High-yield spreads stayed contained, even as yields climbed on inflation fears.
The same dynamic is at play today.
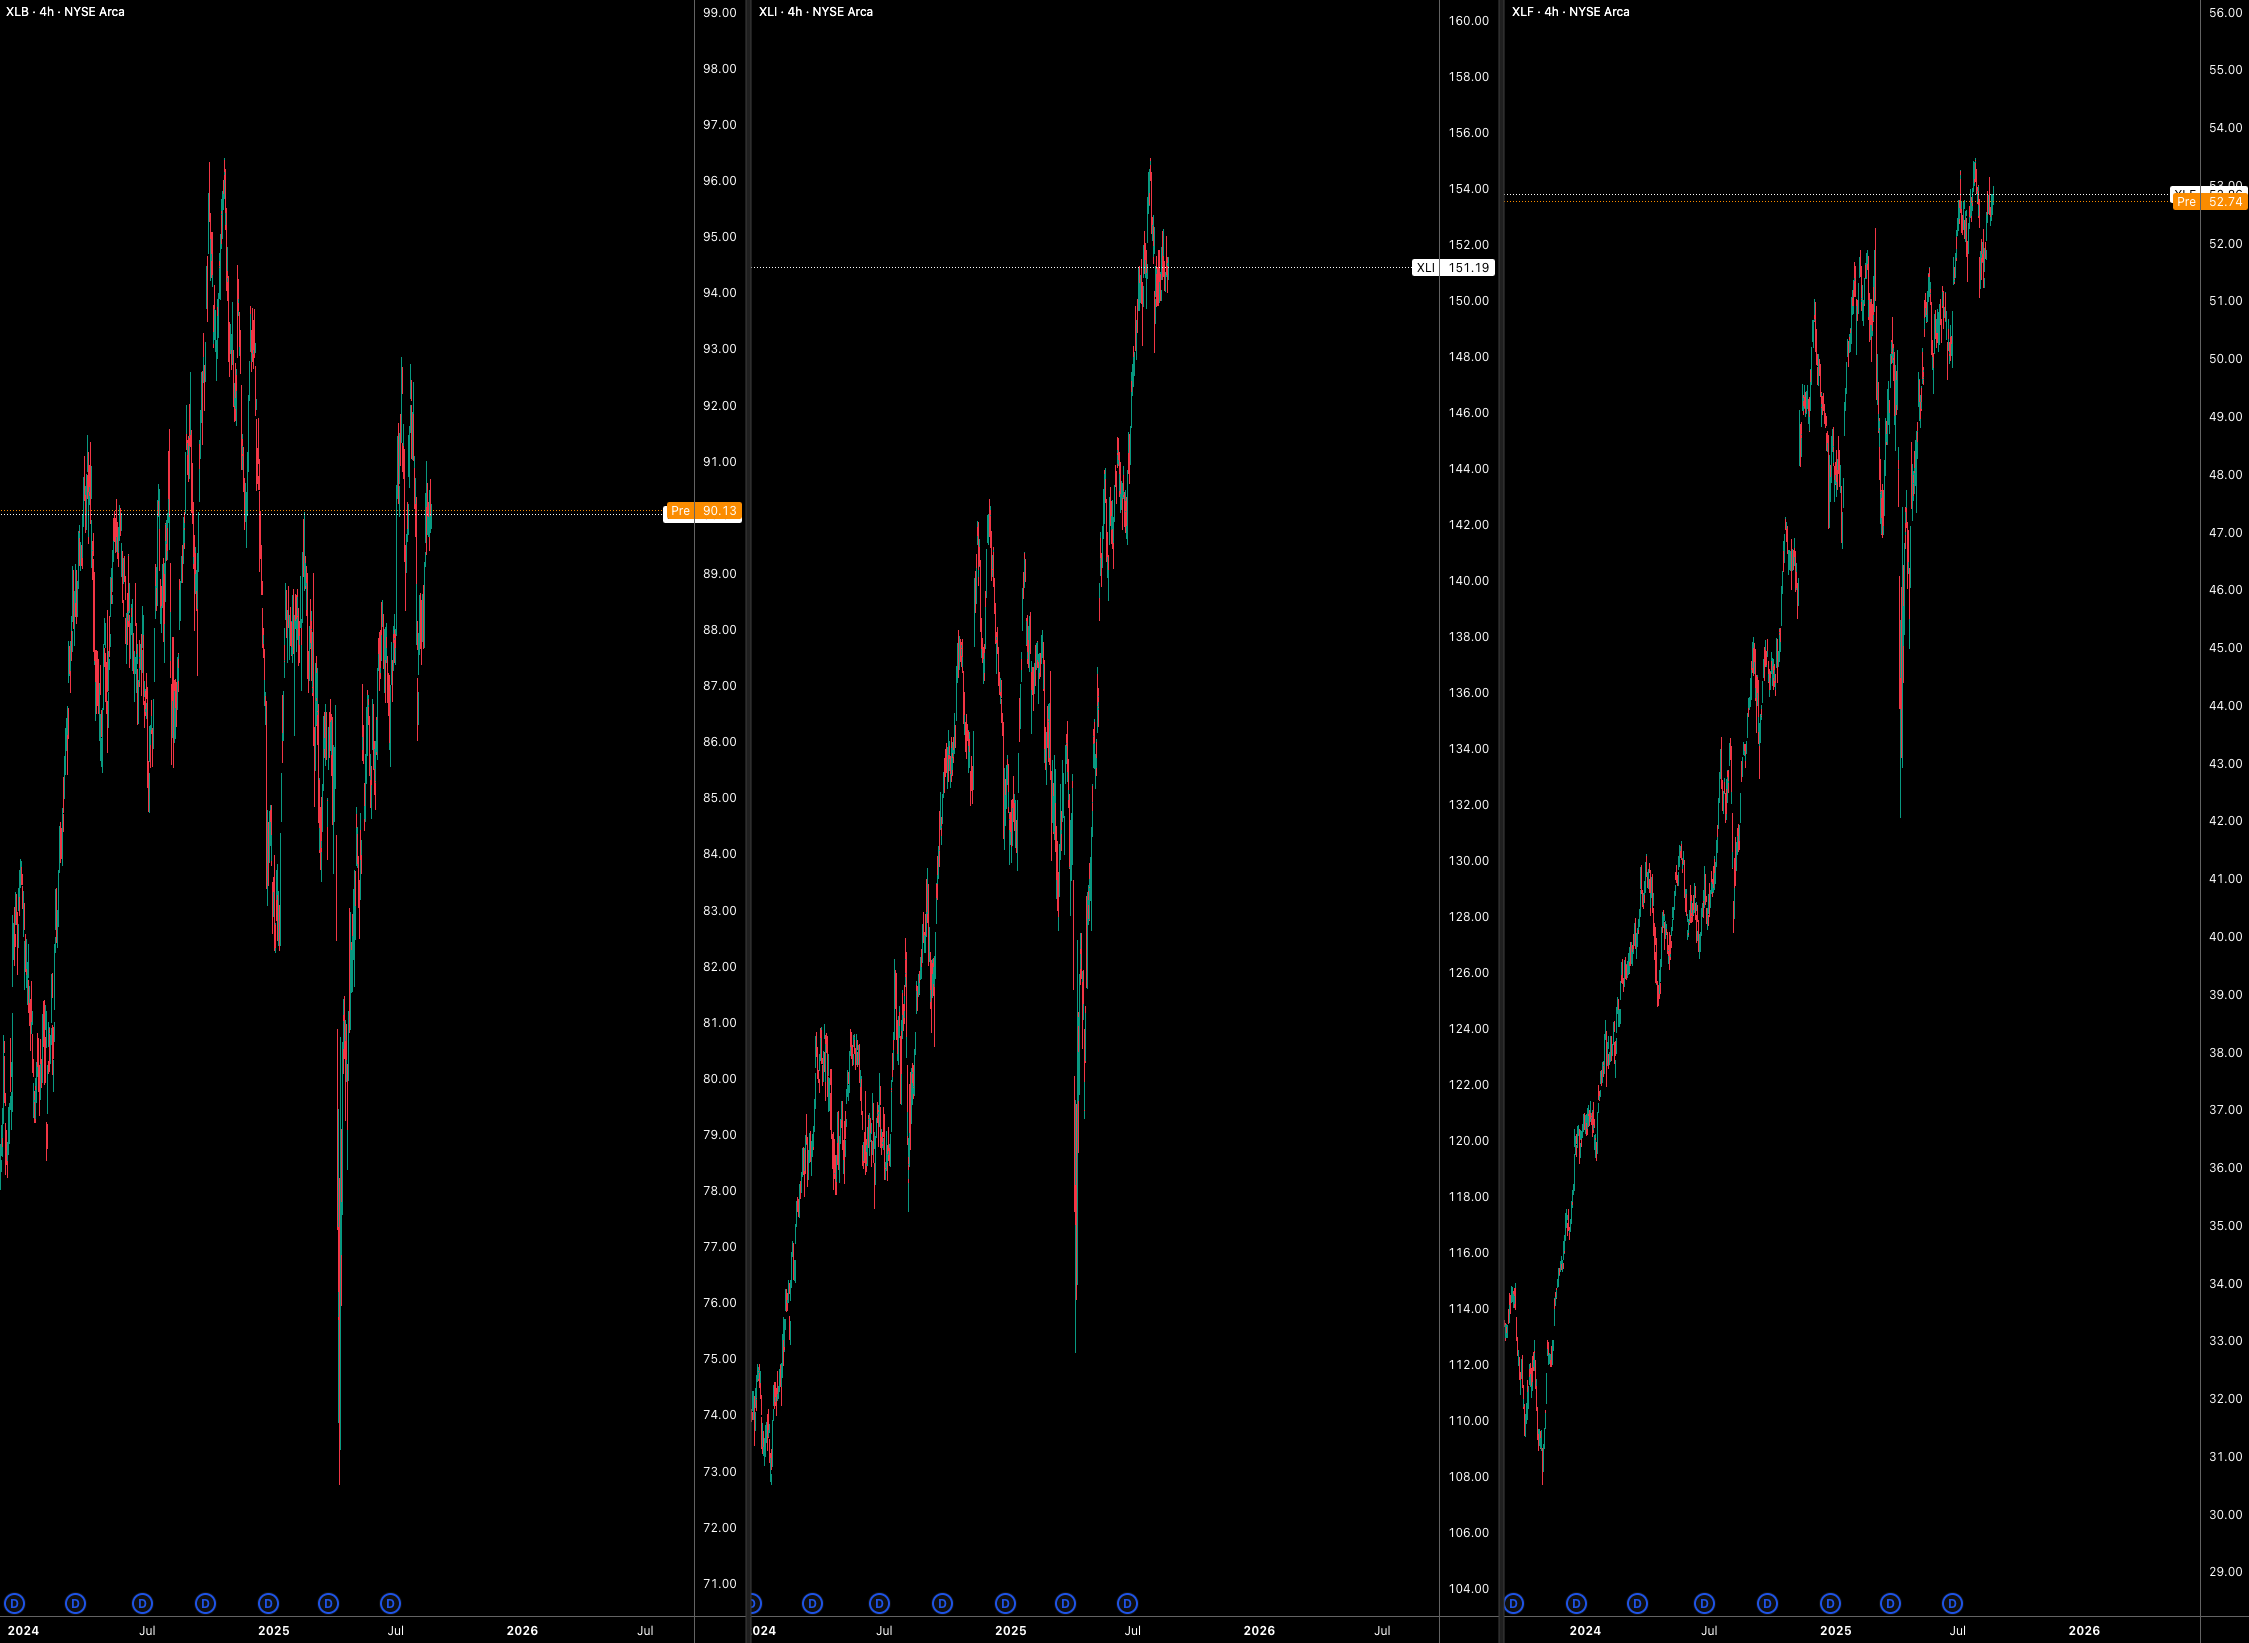
For further evidence of liquidity, just look at sector performance relative to the broader market. Cyclicals like materials and industrials are pushing higher, and financials are holding up just fine, hardly the picture of interbank stress. On top of that, tech (via XLK/SPY) has been outperforming, which is especially notable since tech is ultra-sensitive to rates and liquidity. High-beta capital flows are alive and well. Crowding is a risk, long cyclicals + short duration is consensus and can unwind risk if data softens.
Growth
Now, onto growth. Growth is being undermined by the Fed, or more accurately, by their perception of it. Put simply, the gap between inflation and the Fed Funds rate reflects how strongly they think growth is holding up.
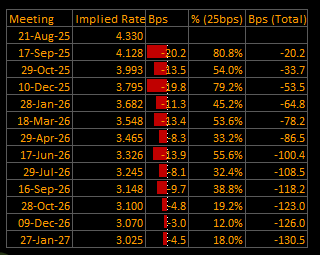
As it stands, the Fed is expected to cut 50bp by year-end (September + December). That would put terminal rates around 3.03%, about 150bp lower than today. It’s a plausible path, but not necessarily the right one given the macro backdrop. There’s 50bps cuts expected by year‑end, if there is more than 50bps eventually priced (low probability), then upside from “more cuts” is limited. But if less than 50bp is priced, the “policy‑insurance” surprise has room. Chart from Capital Flows:
Think about it: cyclical sectors are at or near all-time highs, yet the Fed is planning to cut into this. In a supposedly “restrictive” economy, they’re preparing to add fuel, which risks creating a bubble. The truth is, the economy is functioning fine at current rates. Labor cracked once, but inflation and growth metrics remain resilient.
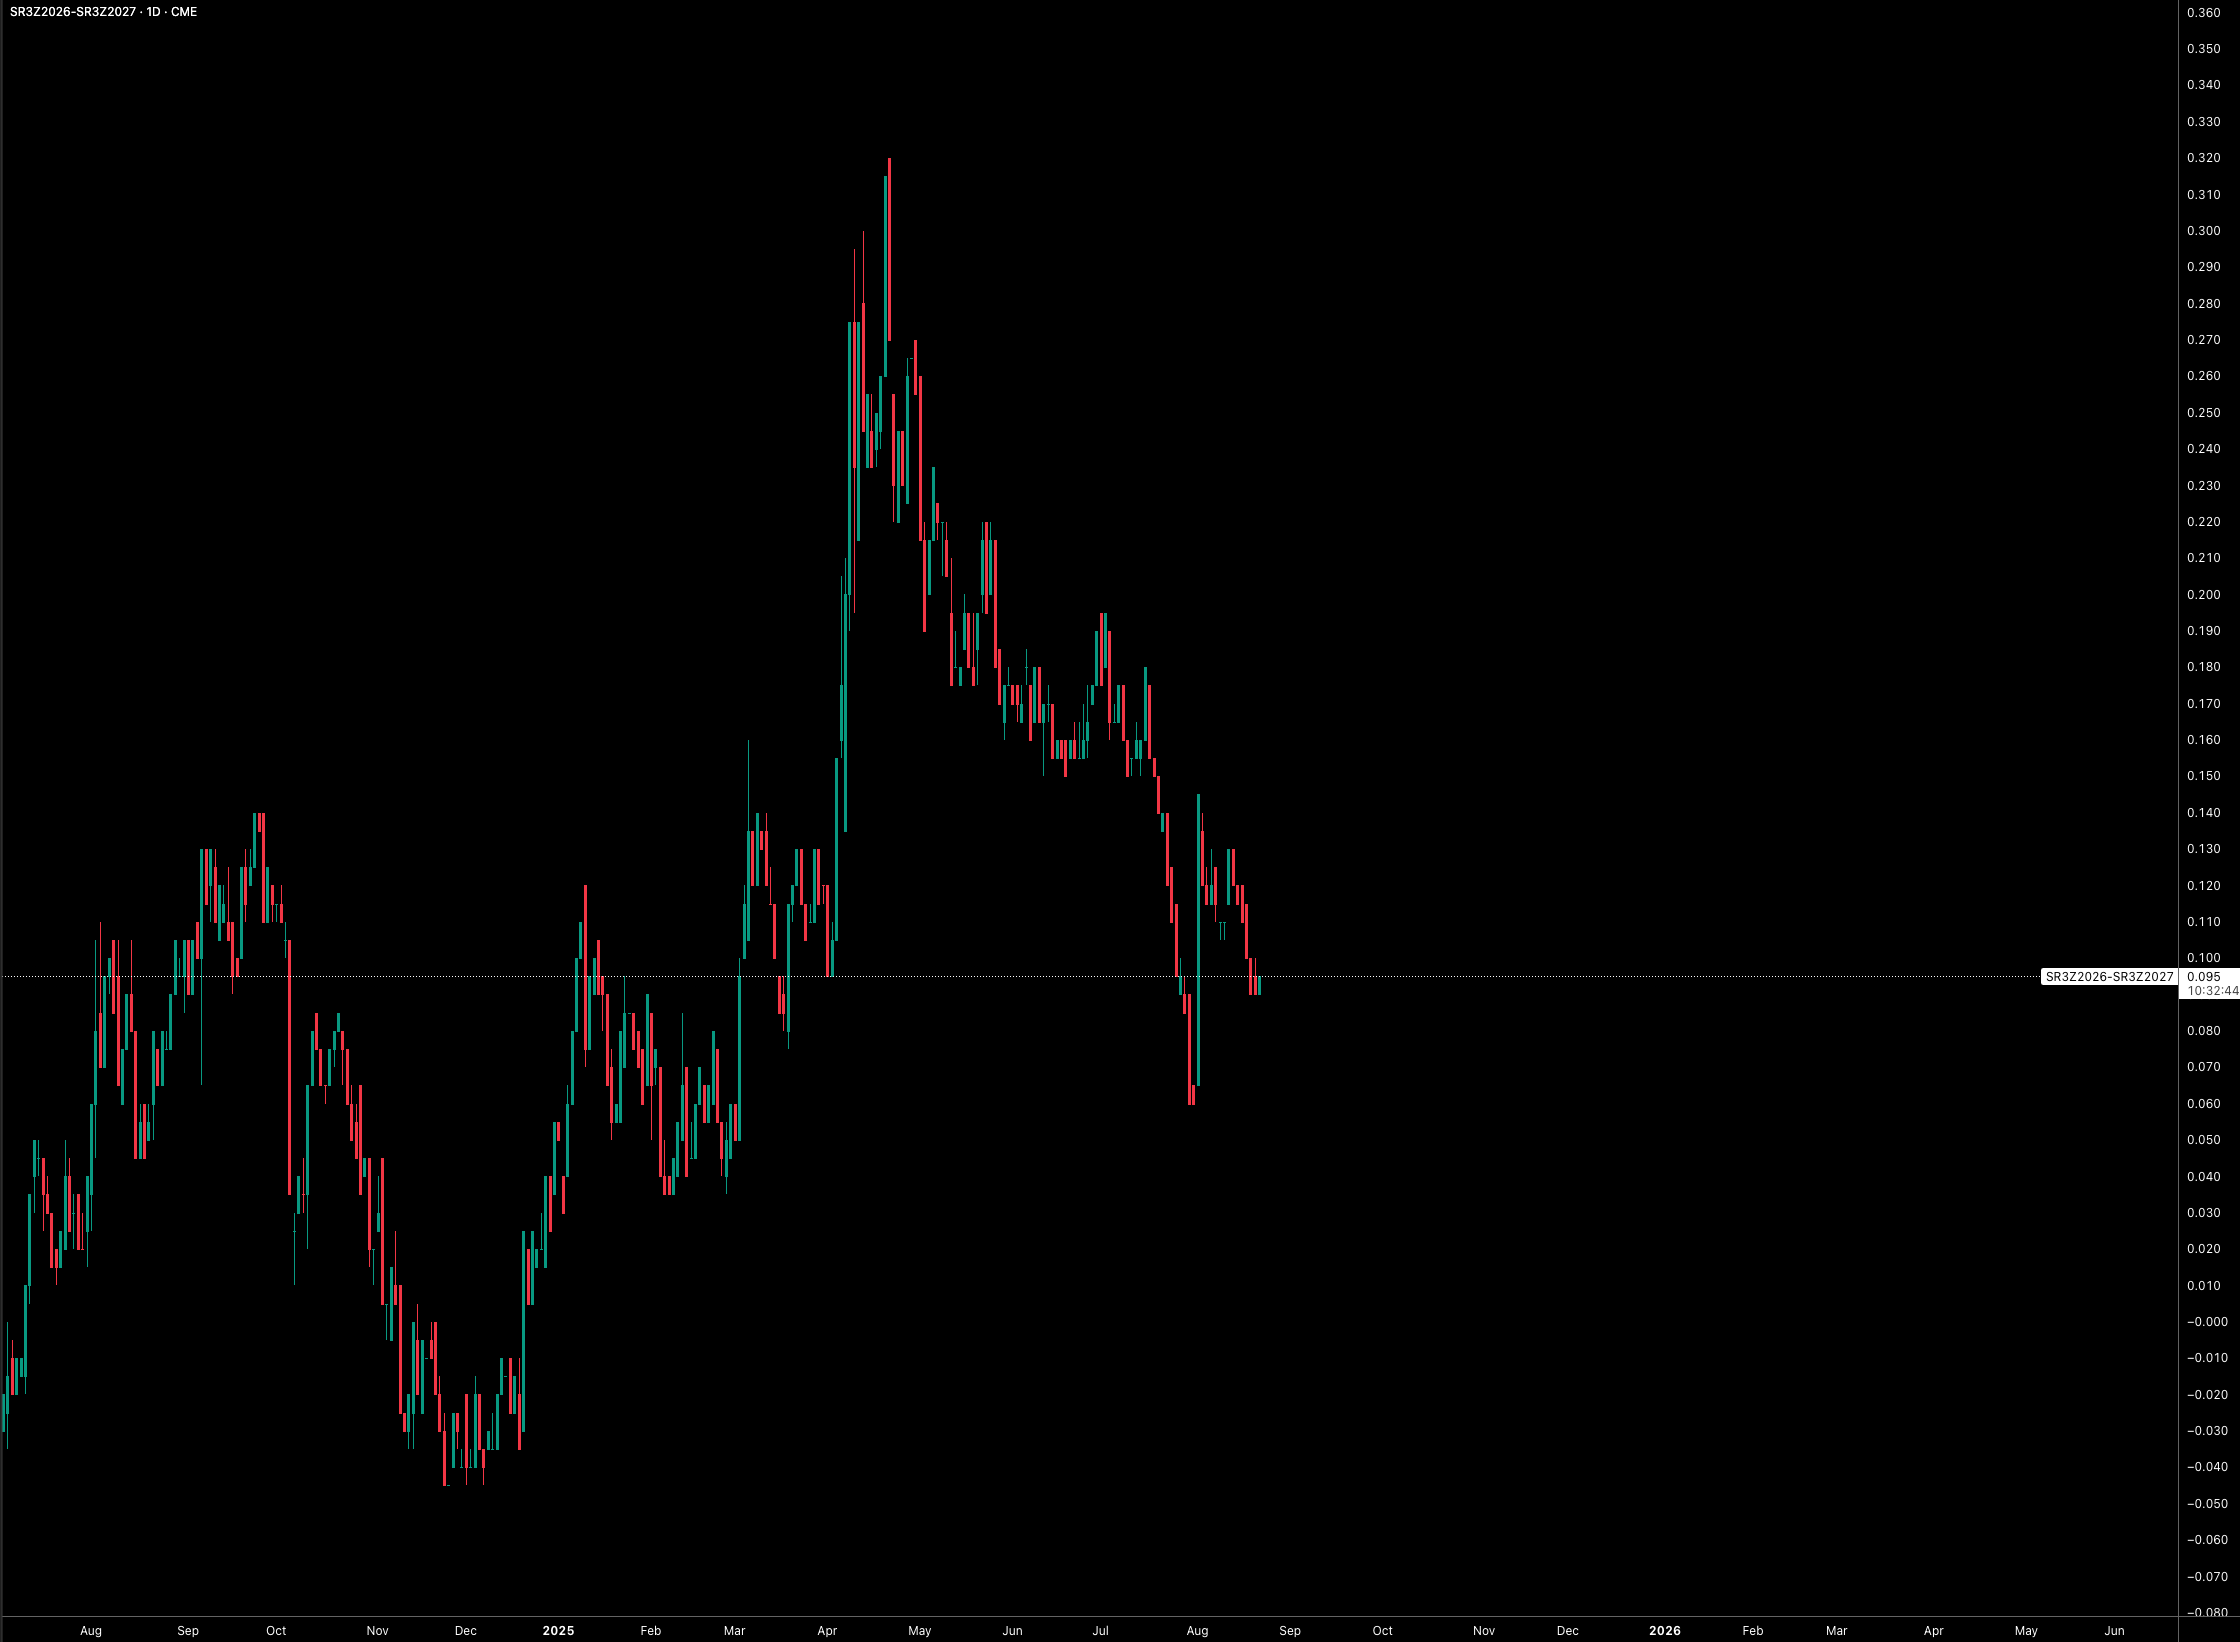
The issue is that the Fed is increasingly leaning fiscal rather than purely monetary. A risk to this regime is Fiscal fade where the deficit impulse slows, Tsy buybacks/smoother issuance compress term premium, leading to bull flattening, then duration outperforms risky assets. FOMC minutes show members acknowledging that inflation risk is larger than labor market risk, yet their projected path still contradicts that. Some even suggested rates may be near neutral, which risks repeating the “September 50bp mistake” from last year. The SR3Z2026–SR3Z2027 spread is a chart to watch: if it ticks higher, it signals cuts getting pushed further out (2026 into 2027) as the Fed wakes up to the regime’s strength.
Fiscally, the US needs lower rates to manage debt, since interest expense is eating too much of national income. Under a Trump administration, we could see an even more dovish Fed board (likely), which would support fiscal expansion but undermine monetary independence. That could inflate asset prices in the short run but destabilise longer-term.
The real risk for growth and liquidity is if Powell digs in against aggressive cuts. That would drain liquidity gradually, hitting labor and equities, and allowing rate cuts later without reigniting inflation. If that shift comes, it’s a tail-risk for equities and a time to start bidding duration (ZN/UB). But we’re not there yet. A steepening 2s10s alongside an equity rally is a sign of growth, not weakness.
One more note, markets don’t only fall in recessions. Valuations matter. Right now, US equities trade at stretched multiples with the S&P 500 forward P/E around 22.1. That’s historically elevated. But valuations are regime-dependent. In the current backdrop of growth + liquidity, they’re sustainable… until they’re not. Earnings are not driving this rally, multiples are. That means if the regime shifts, valuations can correct hard even without a recession.
Inflation
And then there’s inflation, the wildcard that ties growth and liquidity together.
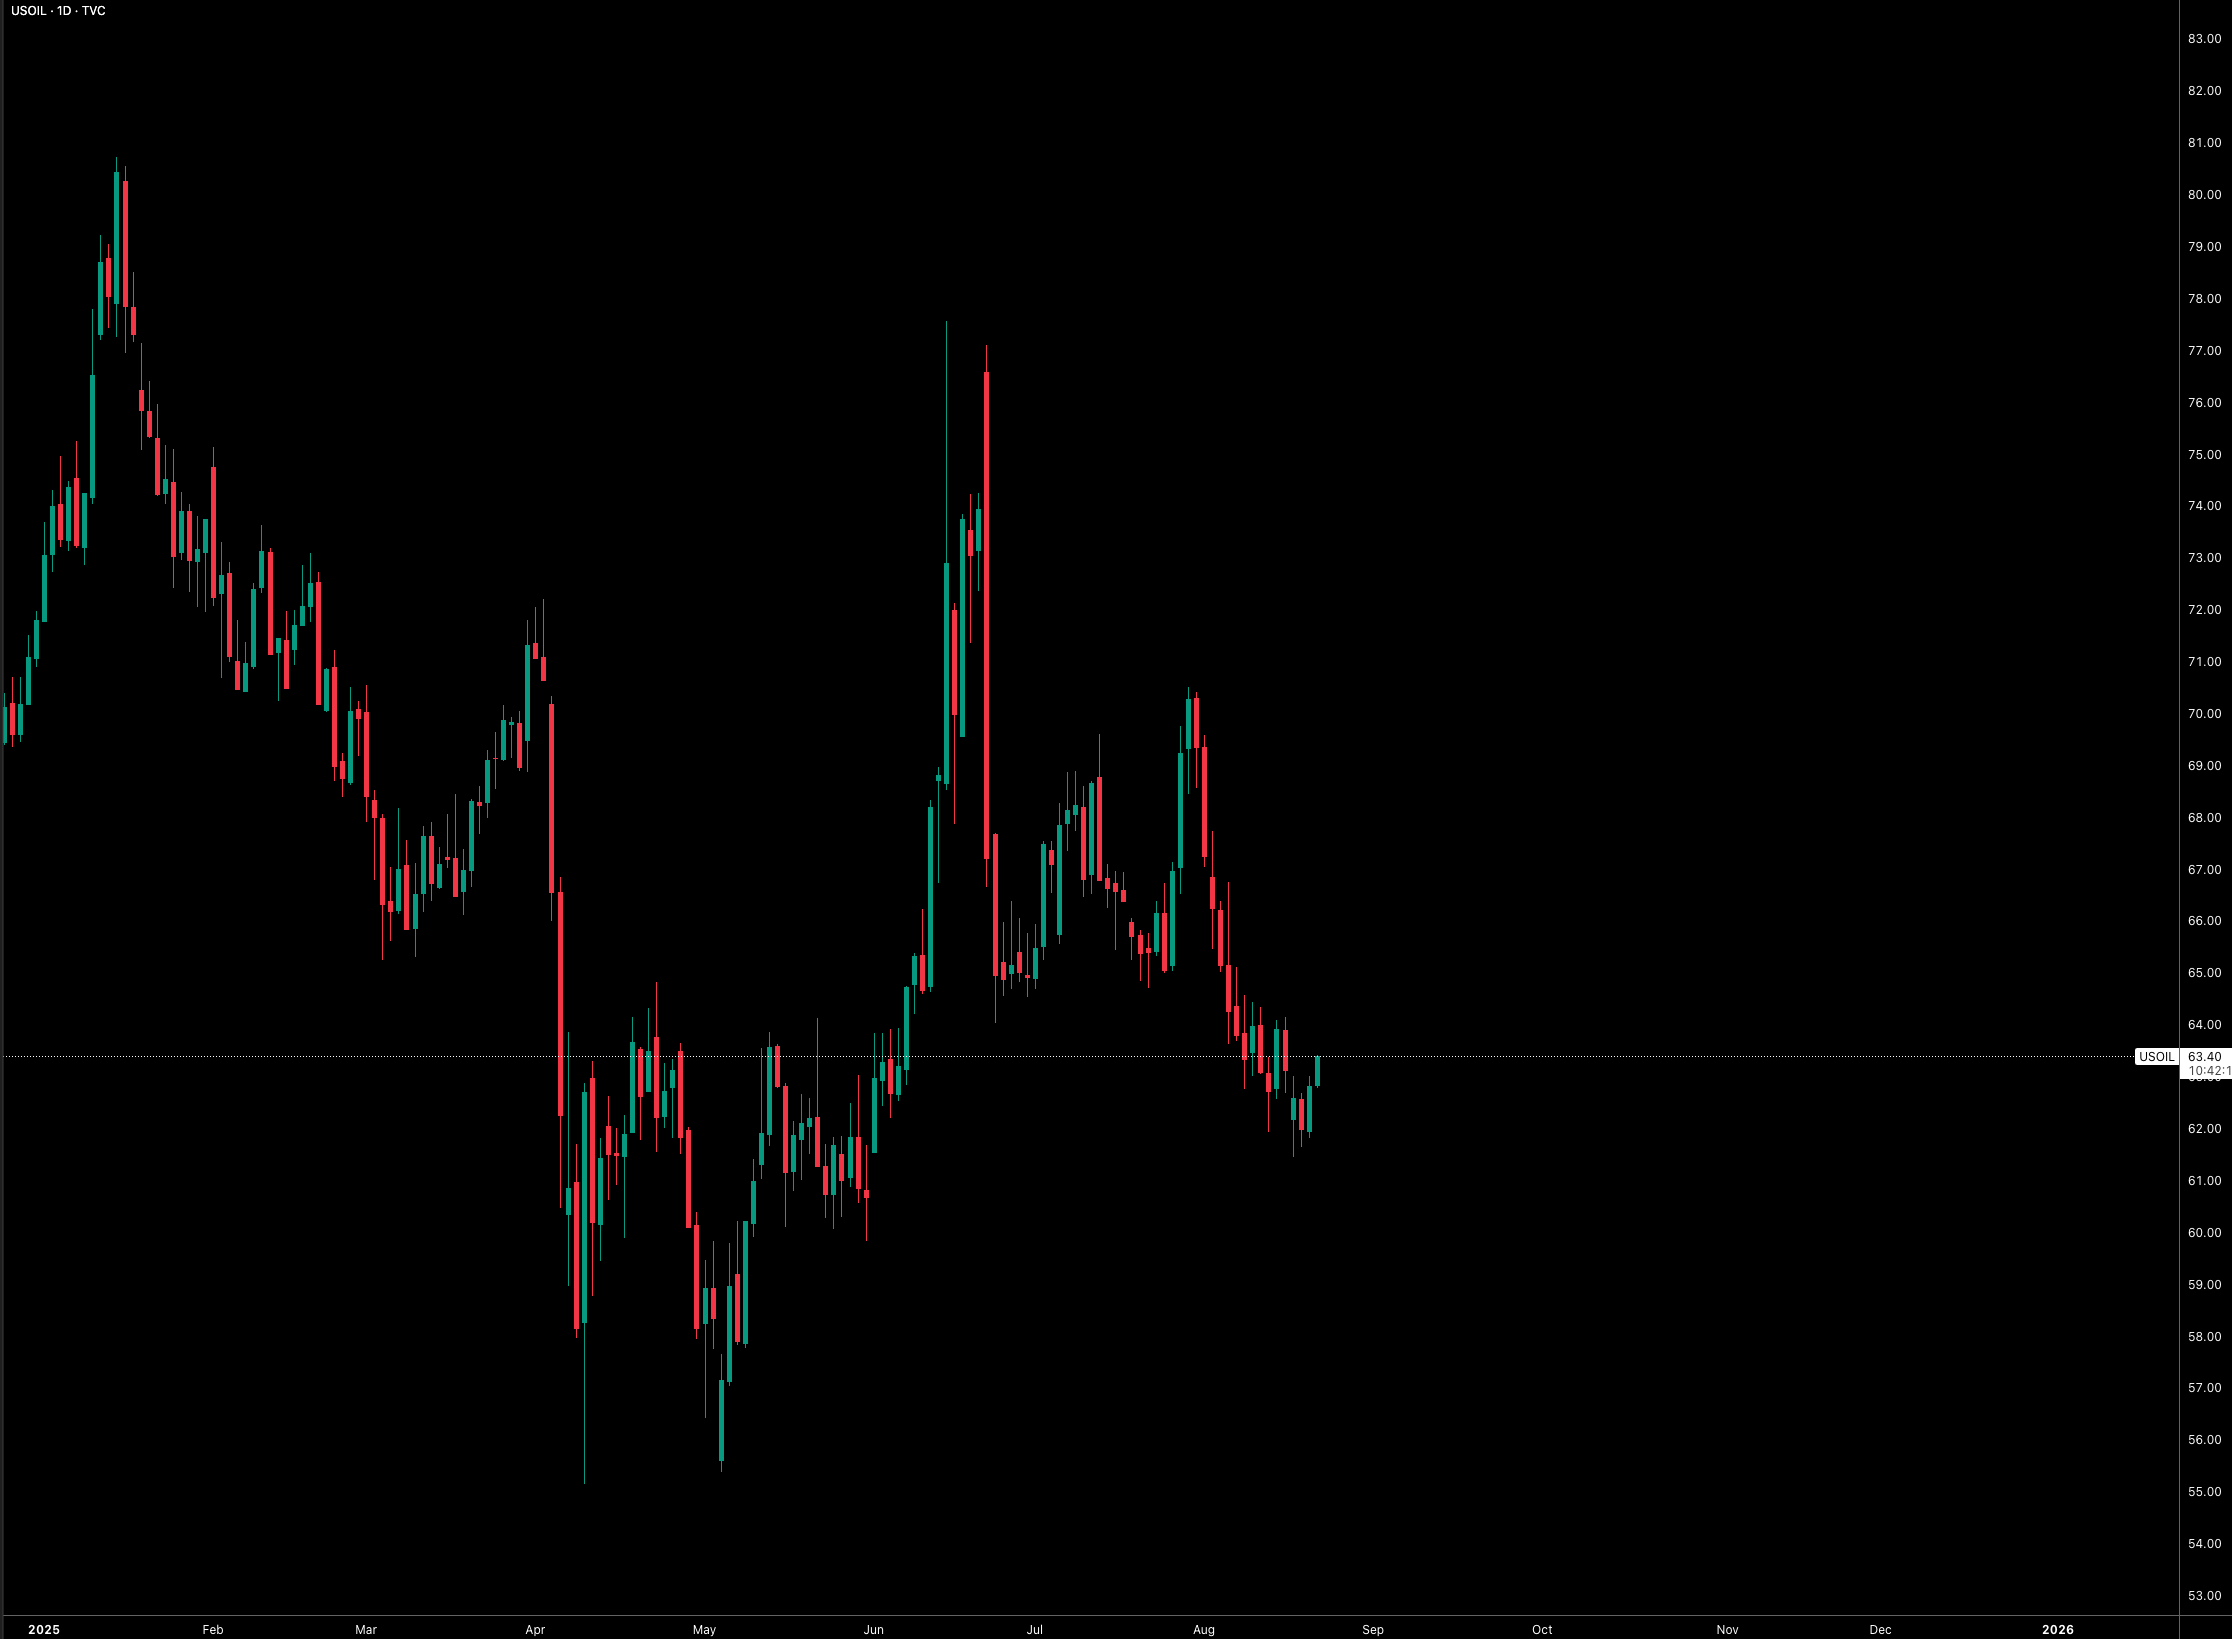
Start with oil. The Fed’s biggest risk in cutting too soon is stoking energy demand. Rate cuts can act like a stimulus check, feeding directly into oil and pushing headline inflation higher. The last thing Powell needs is oil sticking above $65/bbl for a prolonged stretch. We’re already heading there, a 50bp cut by year-end could push oil north of $70.
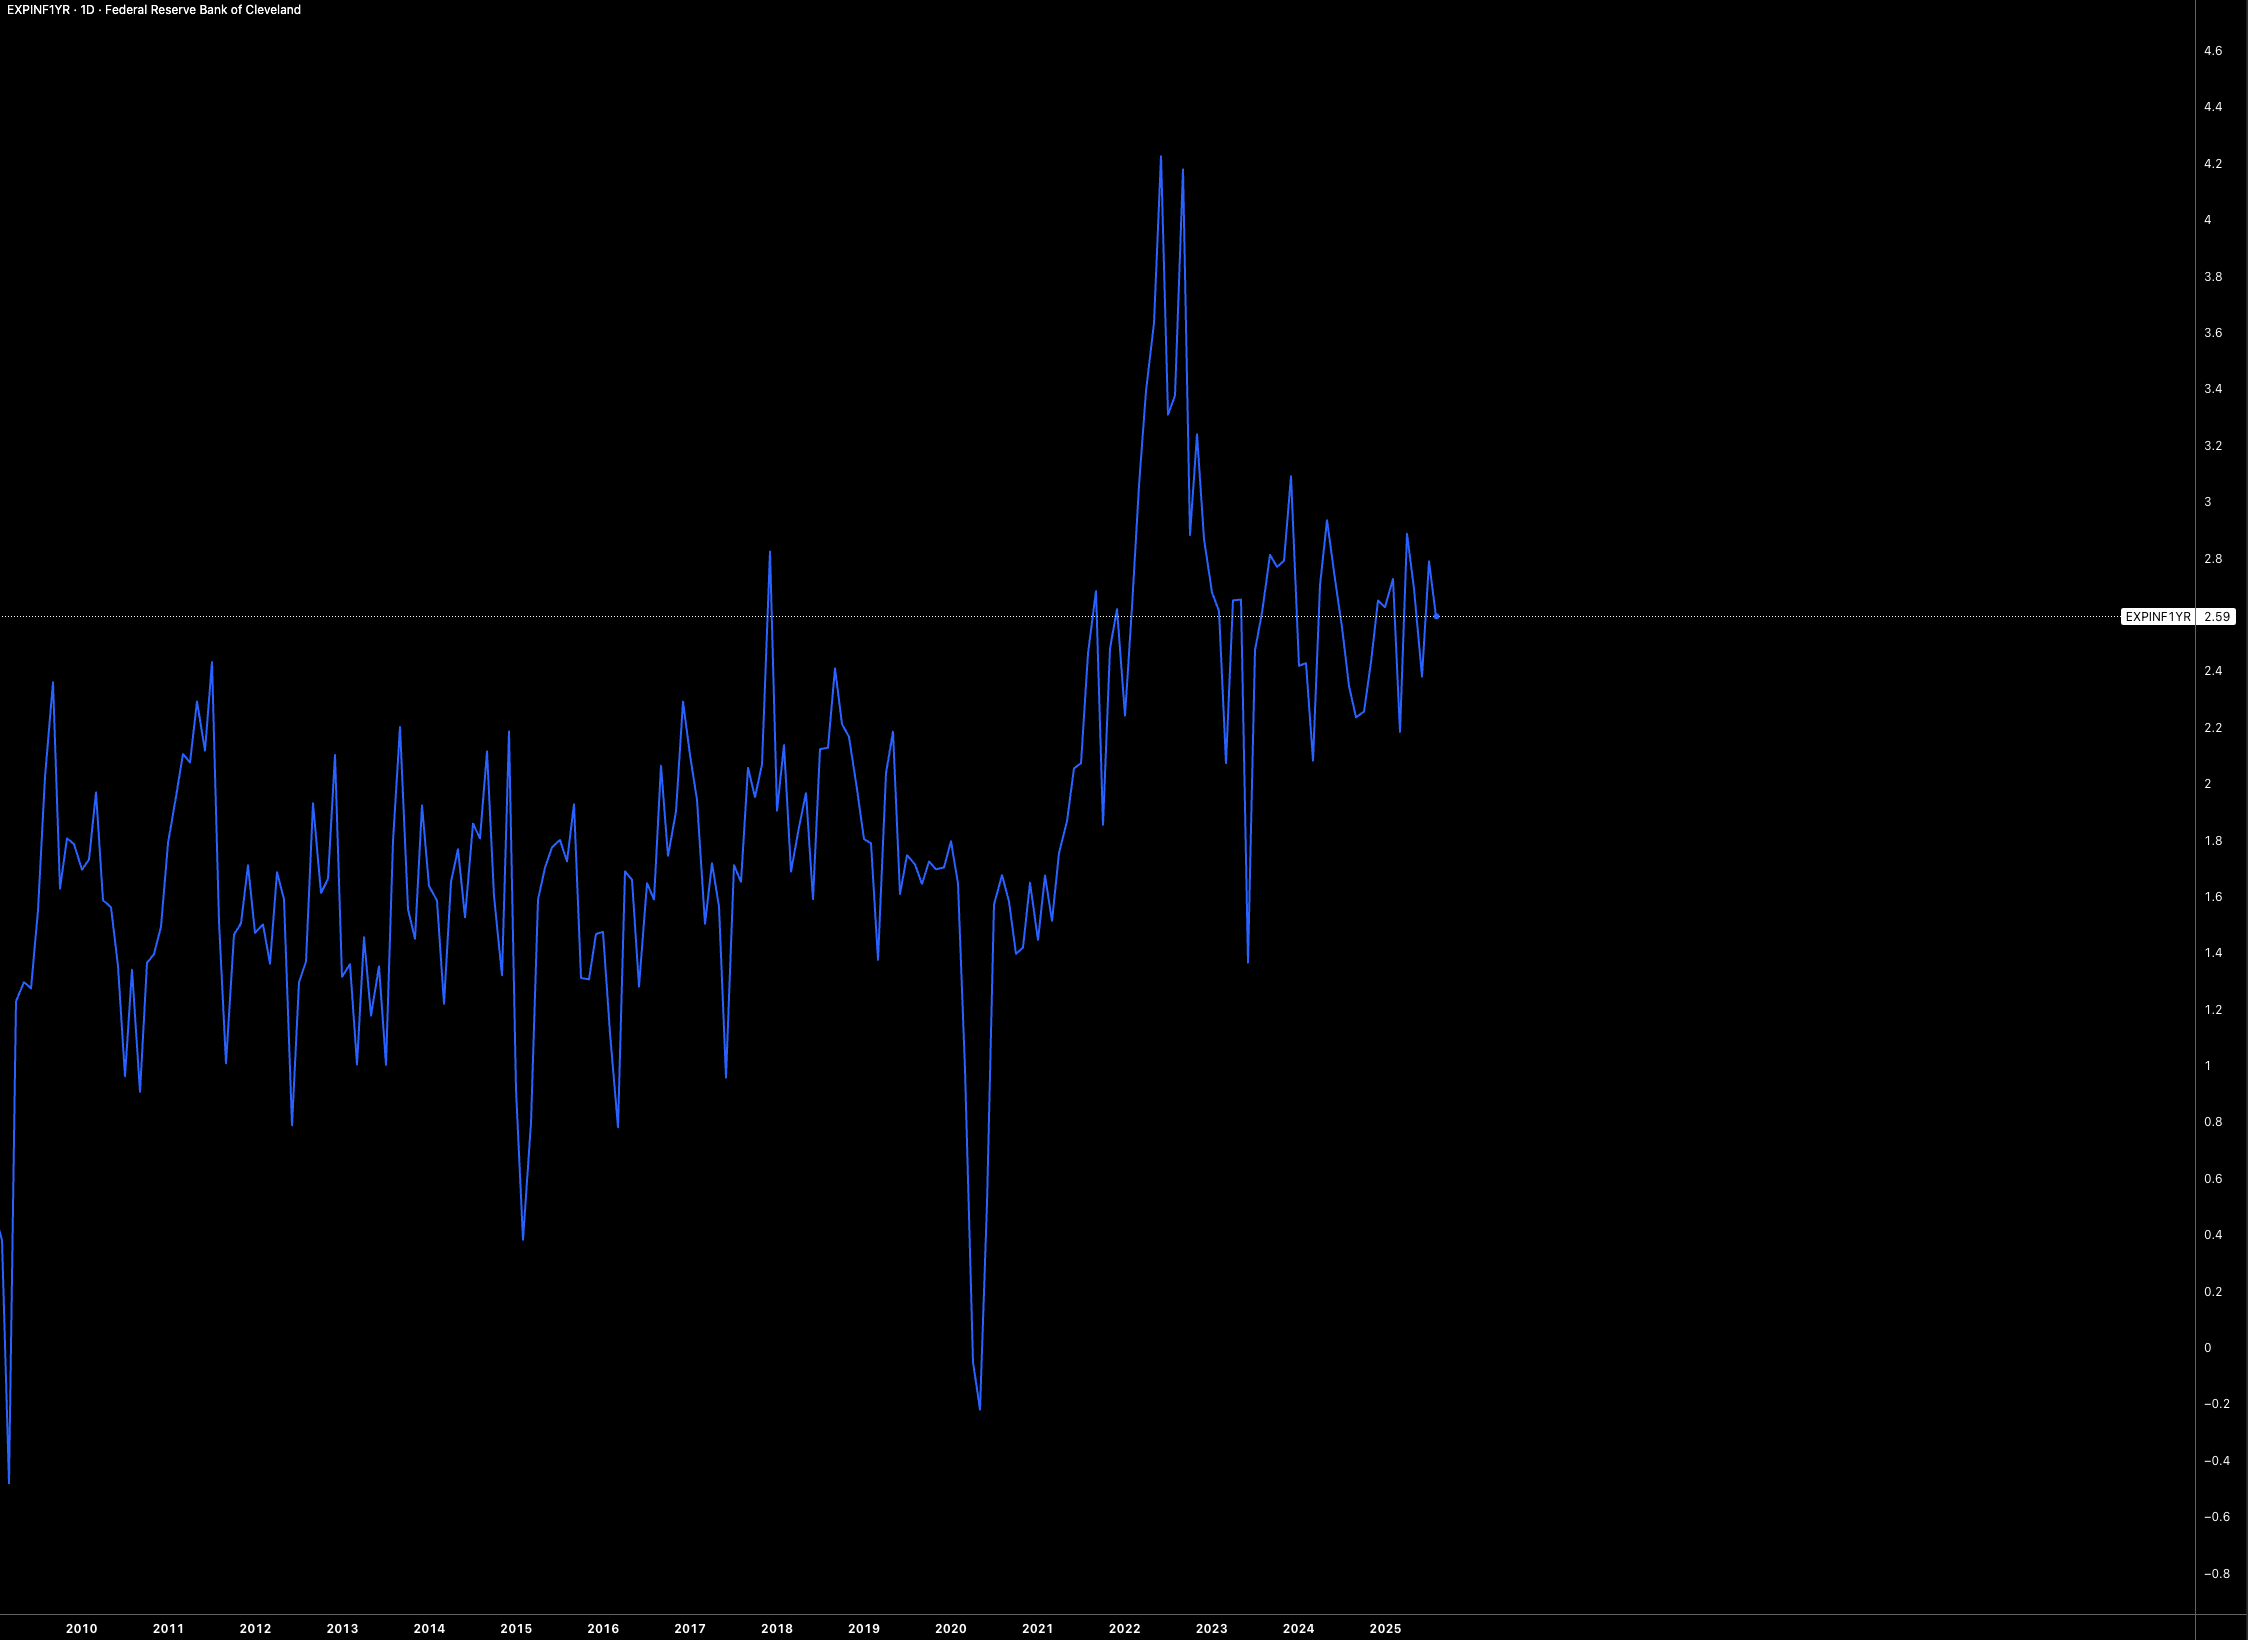
I won’t rehash the obvious, CPI, PCE, and PPI are all running hot. The more interesting point is expectations. Market pricing implies one-year inflation at 2.6%. Given resilient growth, abundant liquidity, and a Fed on the verge of cutting, that feels too low. Something closer to 3% seems realistic.
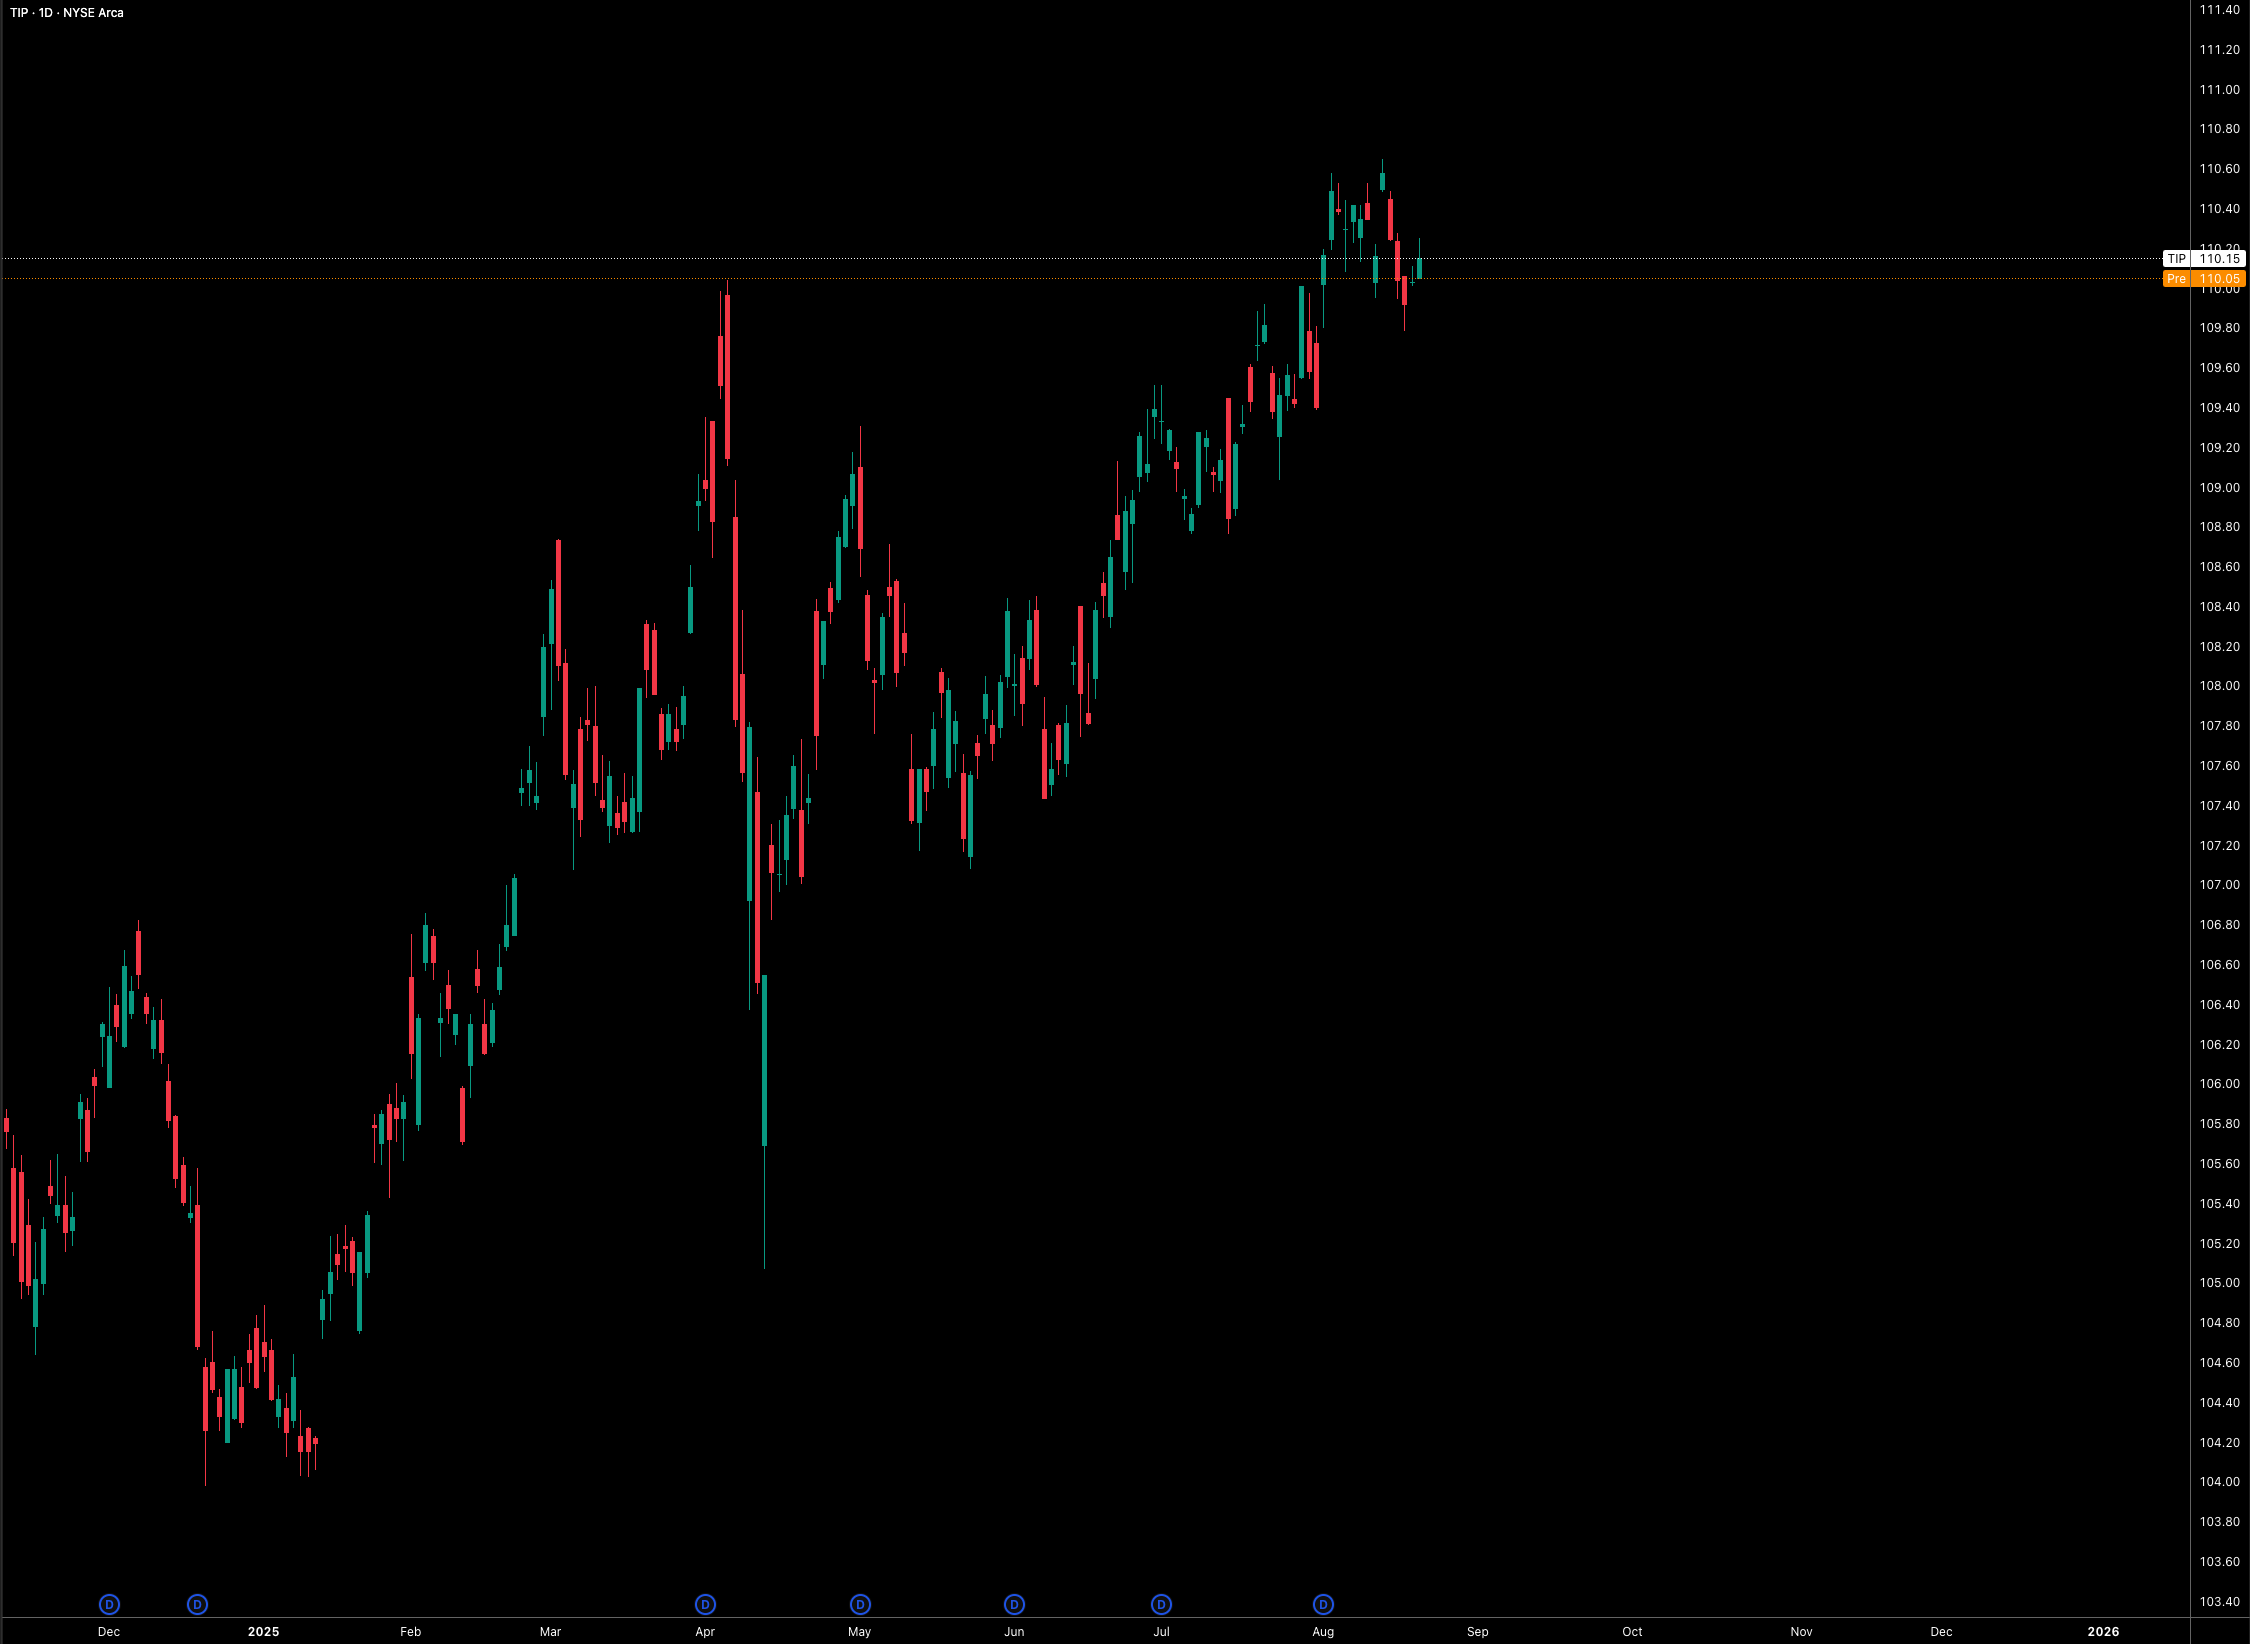
Market-based measures tell a clearer story. TIPS breakevens have been rallying since October 2023, with an even sharper move since April. That’s a sign of liquidity premiums and inflation risk getting priced in. TIPS also capture risk premium dynamics better than survey forecasts, making them the cleaner read. They’re highly sensitive to liquidity, demand, and Fed policy, which is exactly why they’ve been bid.
At the end of the day, the Fed reacts to the data, usually late. The underlying economy is strong, liquidity is ample, and inflation isn’t going away quietly.
Where this thesis could right
Steepening in the curve, breakevens move higher, MOVE/VIX remain shallow, IG/HYG flat‑tight and cyclicals/financials outperform defensives.
Policy error (dovish): Fed cuts fast, steepening the curve, equities rally on higher liquidity. Then labor remains strong fuelling growth and inflation (while cuts stimulate liquidity).
Where this thesis could wrong
Issuance/term‑premium shock (no growth): Treasury supply + weak investor demand leading to long‑end selloff, equities down, bonds down (bad 60/40, if it wasn’t already trash, 2022 is an example!). Then, credit cracks outside banks: private credit (not seen in SOFR-OIS)
Policy (hawkish): Fed skips/cuts slower, pushes real rates higher into slowing profits, flattening curve, equities de‑rate. THen, labor cools and growth cracks show.
Positioning
Rates: 2s10s bear steepener via futures (receive 2y/pay 10y). Target +20–40 bps.
If you’re looking to position with the correct DV01: P&L math (per $100mm notionals): 2y DV01 = $0.19/bp/ $1mm, 10y ≈ $0.85/bp/ $1mm → net ≈ $66k per 10 bps on $100mm (pay 10y, receive 2y). Or, just ask ChatGPT to DV01 you correctly!
Inflation: Long TIPs vs USTs. You can also add WTI call spreads as breakeven convexity kicker.
Equities: Long financials & industrials vs utilities/staples. You could also add energy OW.
Gold OW as policy‑error hedge.
That was a deep dive, go back over it again if need be!
Brilliant Alfie as always
I really enjoy your weekly analysis and write ups and I’m learning a lot
Keep up the great work