



TL;DR
Long the hike story: November at 72% is the first half-priced move and no cut sits on the strip.
Oil is the driver, WTI +1.8% on the Hormuz rejection is repricing the whole front-end higher.
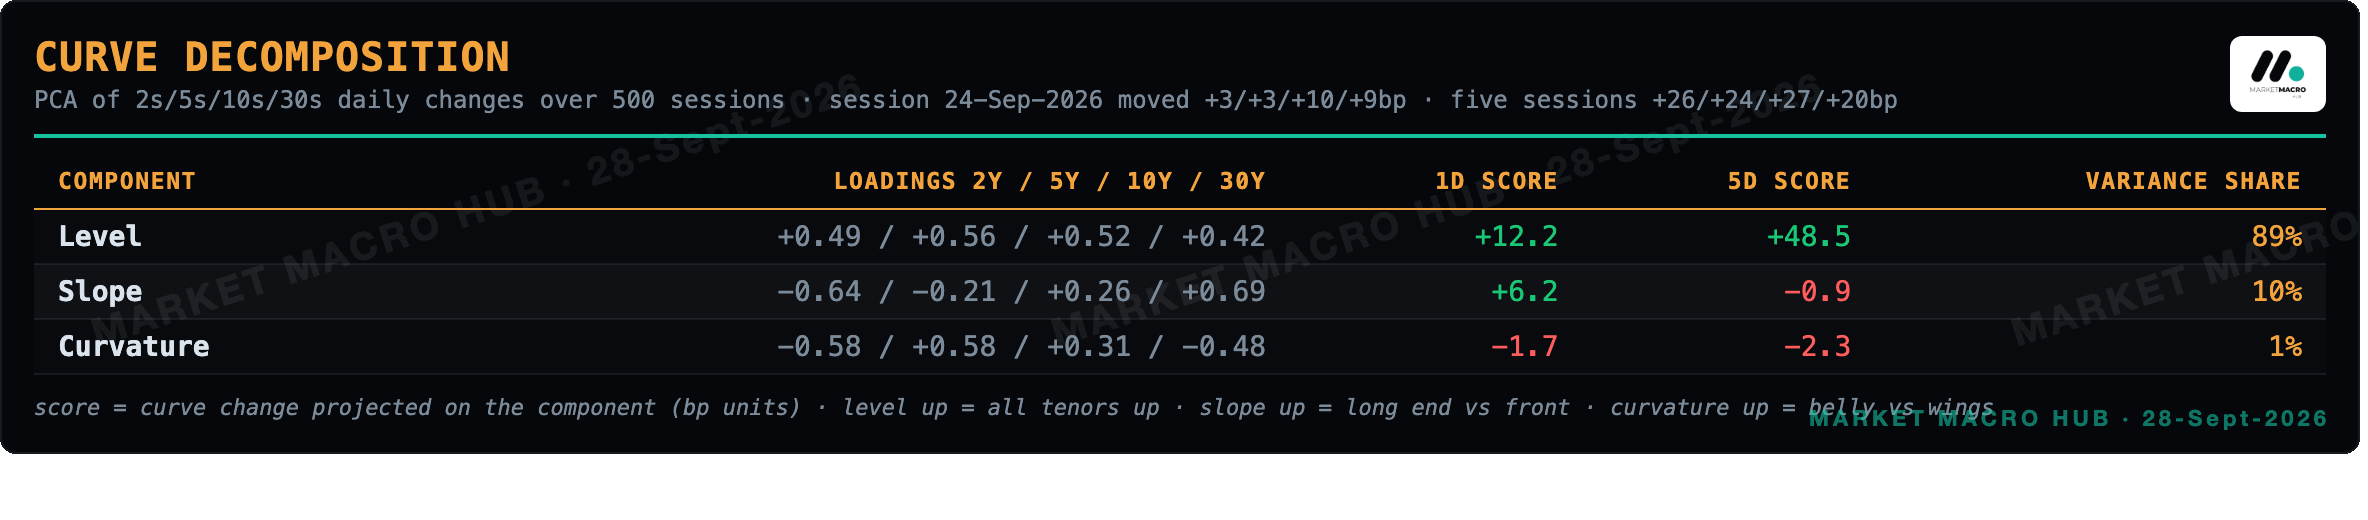
Three hikes still look stretched, my tell is 2s10s at 31bp steepening another +5bp.
Rate vol tail stays live, MOVE at 104.6 hasn't leaked into a VIX at 15.6 yet.
Credit is my anchor, IG at 79bp signals no stress and invalidation stays 90bp.
Where We Stand
Yesterday I said I'm long the hike story, three hikes fully priced with November the first half-priced move and no cut anywhere on the strip. This morning's tape reaffirms every leg of that. My oldest running view, opened four days ago, that the Fed hikes further, stays intact with November at 72% and the strip peak now up at 4.85%. My three-hikes thesis I keep alive on the tell I named yesterday: 2s10s at 31bp steepened another +5bp overnight, so the strip still looks stretched relative to the realisable path. The MOVE flag is still live at 104.6 and hasn't bled into a VIX sitting at 15.6. I'm not changing my read on anything, and I'm not adding into a strip that already prices what I want.
Today's Tear Sheets
The full daily pack is attached below · six PDFs generated from the same computed data set as this note:
Macro Regime · regime classifier, growth x inflation quadrant, curve regimes, cross-asset drivers, crisis phase, model state card, breadth, credit, vol term structure, liquidity, stock-bond correlation, housing
Fixed Income · UST complex, term premia, rate risk, auctions, global curves, Fed/ECB/BoE/BoJ implied policy paths, global 2Y and 10Y panels
Equities · index pages, daily attribution, relatives, vol suite, vol cone, gamma, global relatives, Mag7+ quant sheet, options surfaces
FX · majors dashboards, carry, correlations, COT positioning, crosses
Commodities · energy, metals, agriculture, COT crowding, term structure
Crypto · BTC ladders, ETH, macro correlations, ETF flow proxy

Machine-readable pack (CSV + JSON): https://drive.google.com/drive/folders/1iyfaHIdp-H3R2viTi71S1TPSAGVwUth9
What Changed
What the Tape Is Arguing About
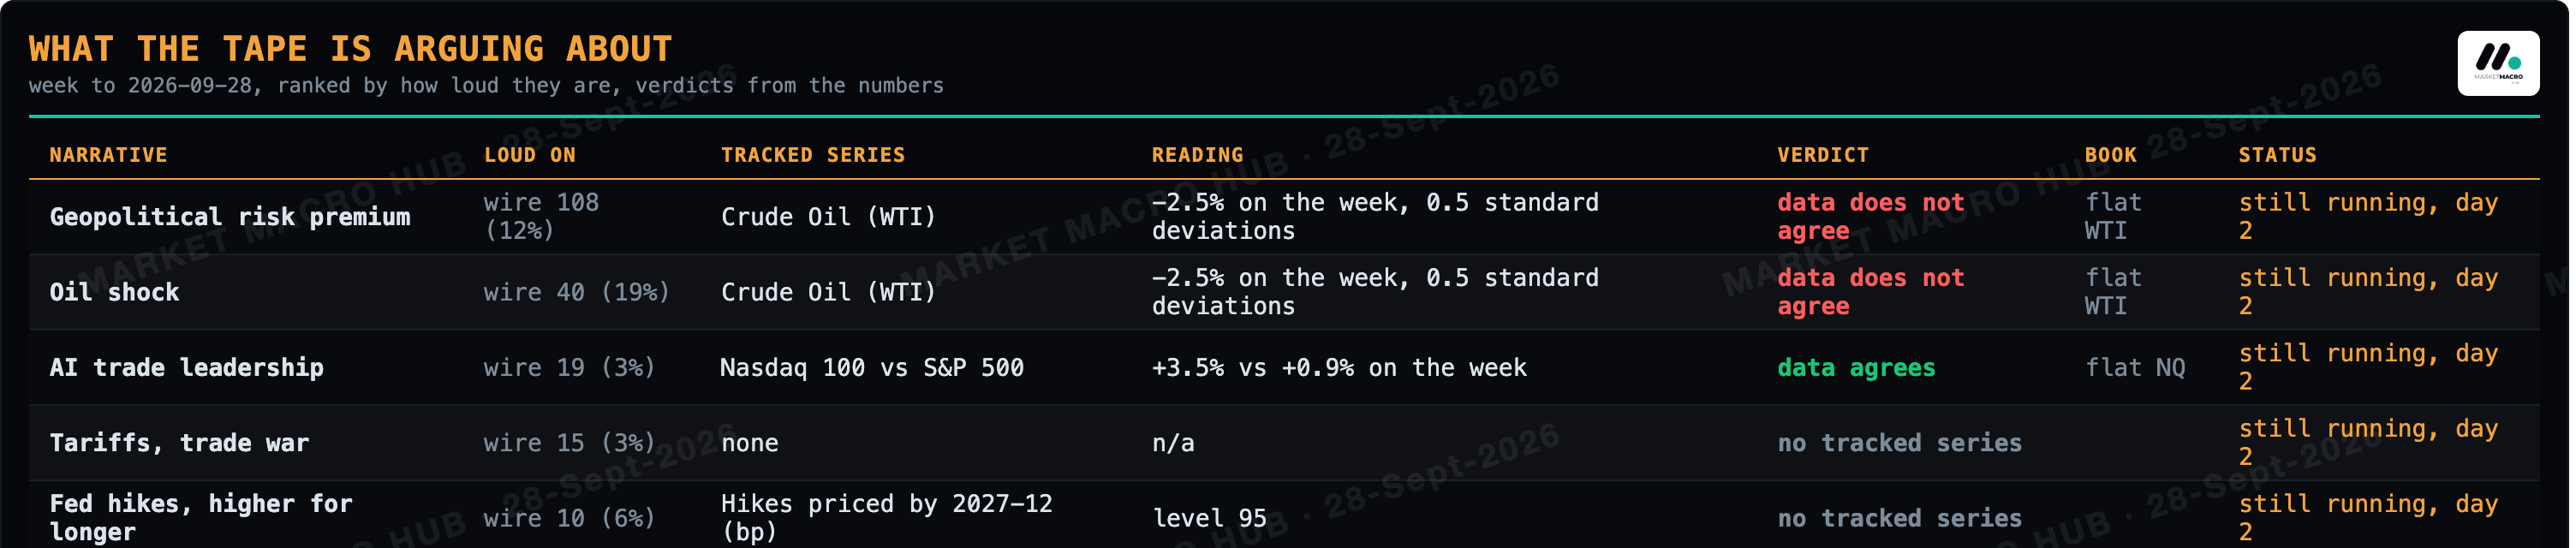
Geopolitical risk premium: data does not agree (Crude Oil (WTI) -2.5% on the week, 0.5 standard deviations).
Oil shock: data does not agree (Crude Oil (WTI) -2.5% on the week, 0.5 standard deviations).
AI trade leadership: data agrees (Nasdaq 100 +2.6% relative on the week).
Tariffs, trade war: no tracked series.
Fed hikes, higher for longer: no tracked series.
Asset Market Pricing
Sector Attribution
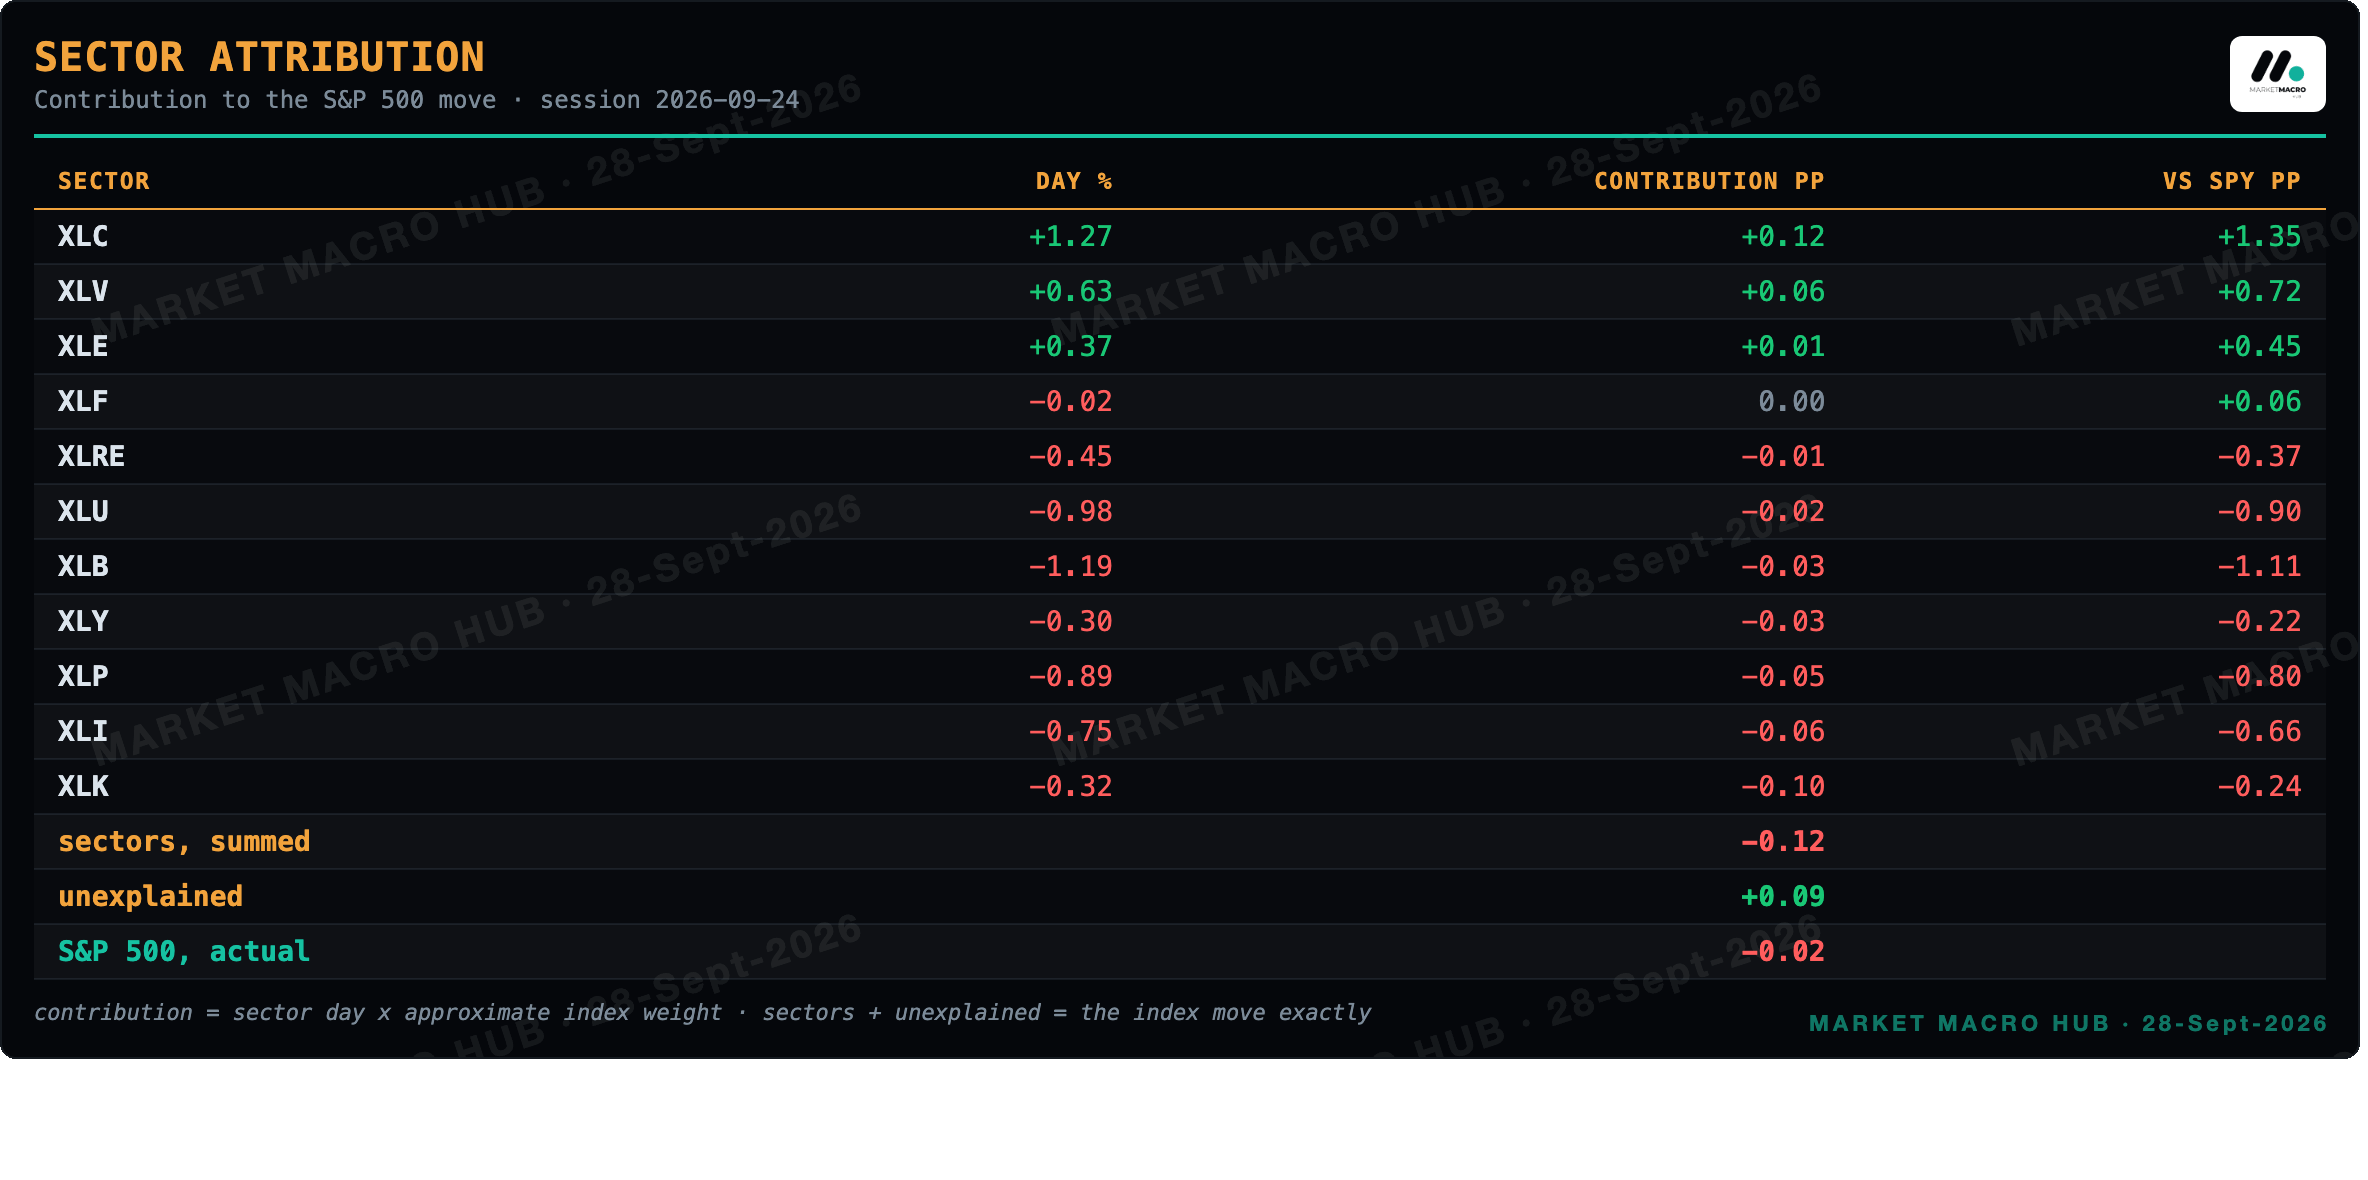
Session 2026-09-24. Sectors plus the unexplained remainder sum to the index move.
Attribution
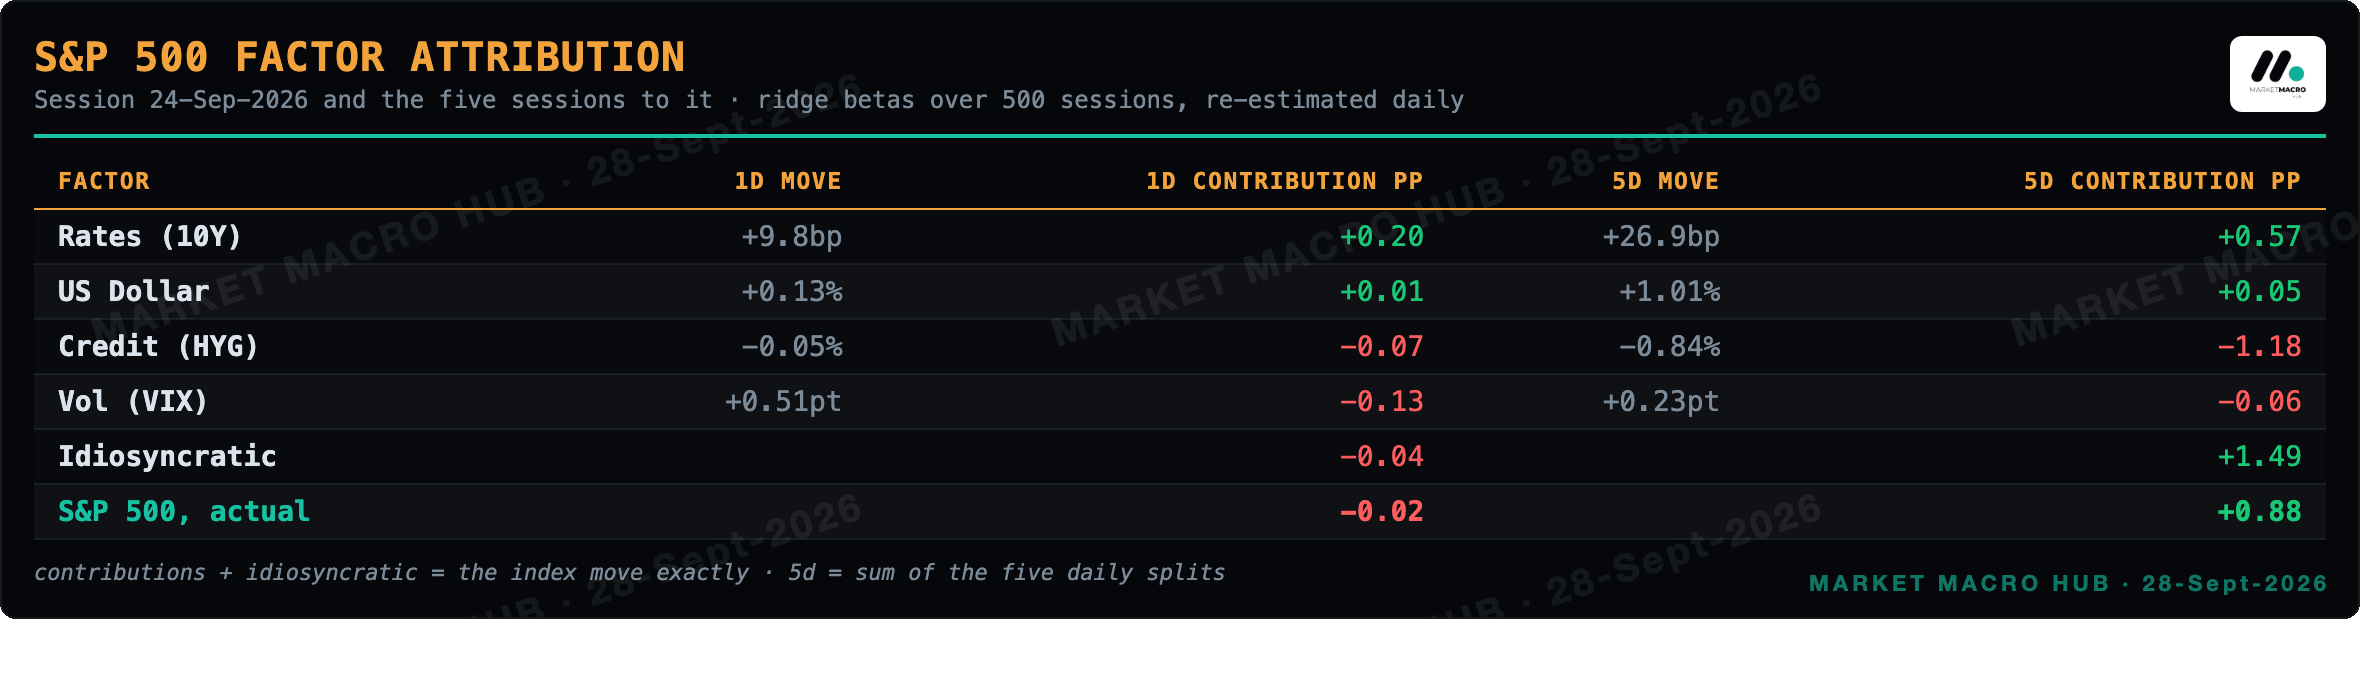
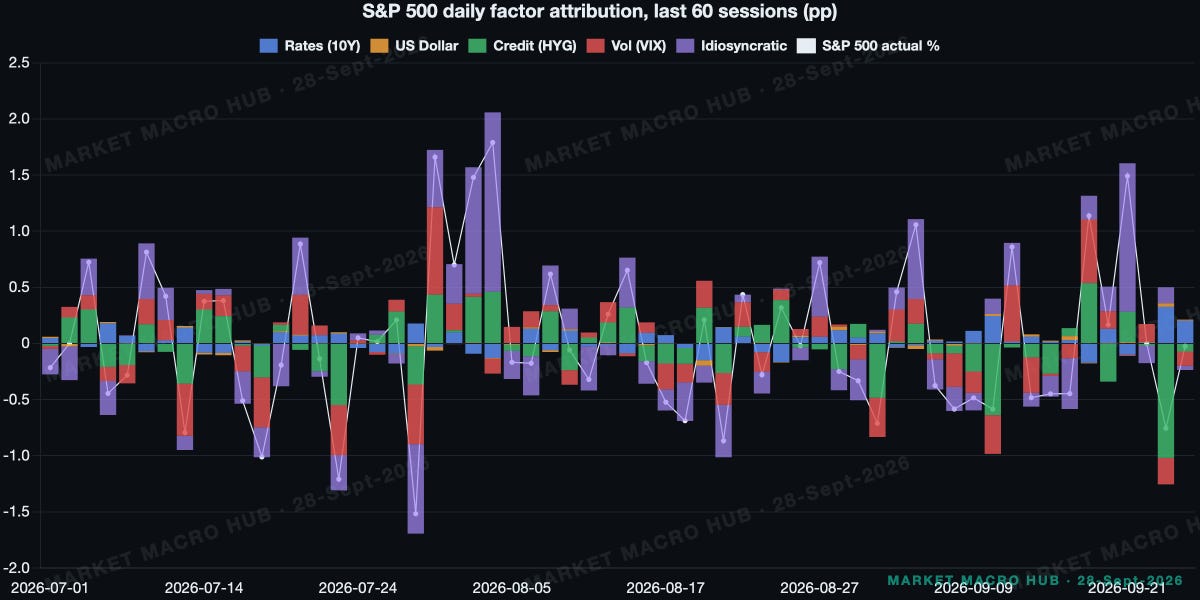
The S&P 500 closed -0.02% on 24-Sep-2026 and the largest driver was rates (10Y) at +0.20pp; over the five sessions to that close the index summed to +0.88% with the idiosyncratic remainder the largest driver at +1.49pp.
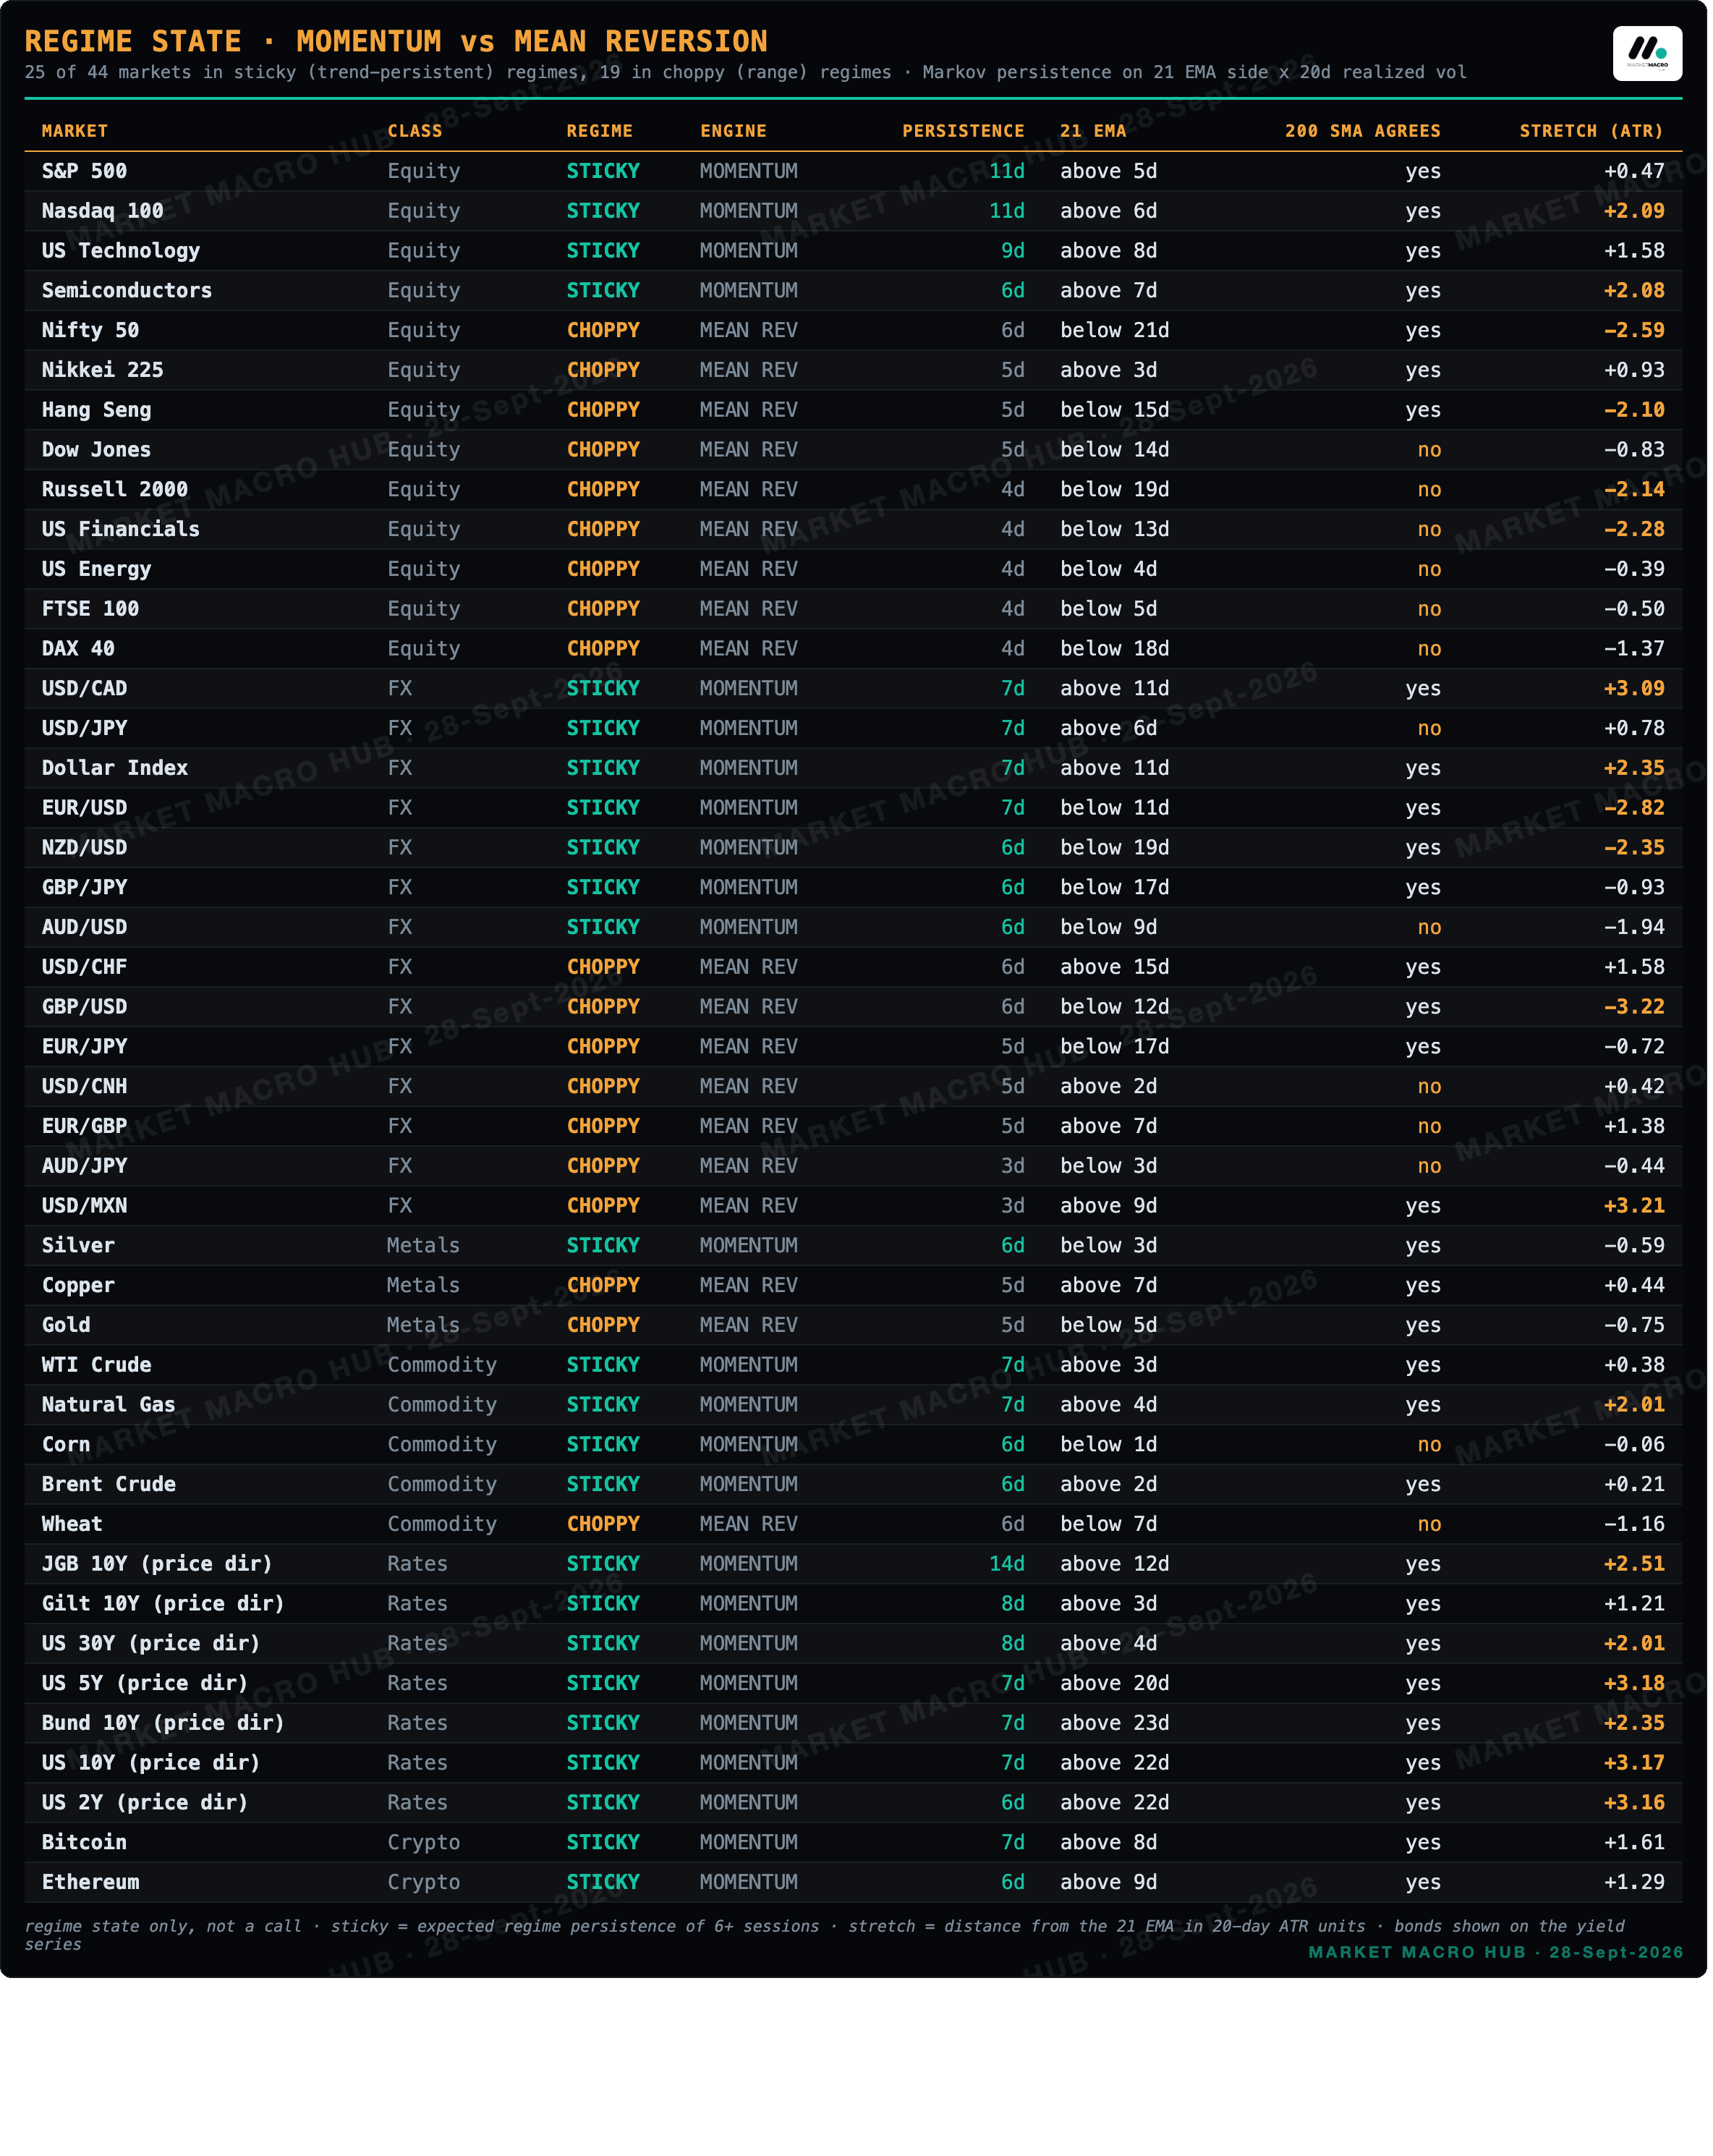
Regime State · Momentum vs Mean Reversion
Model State
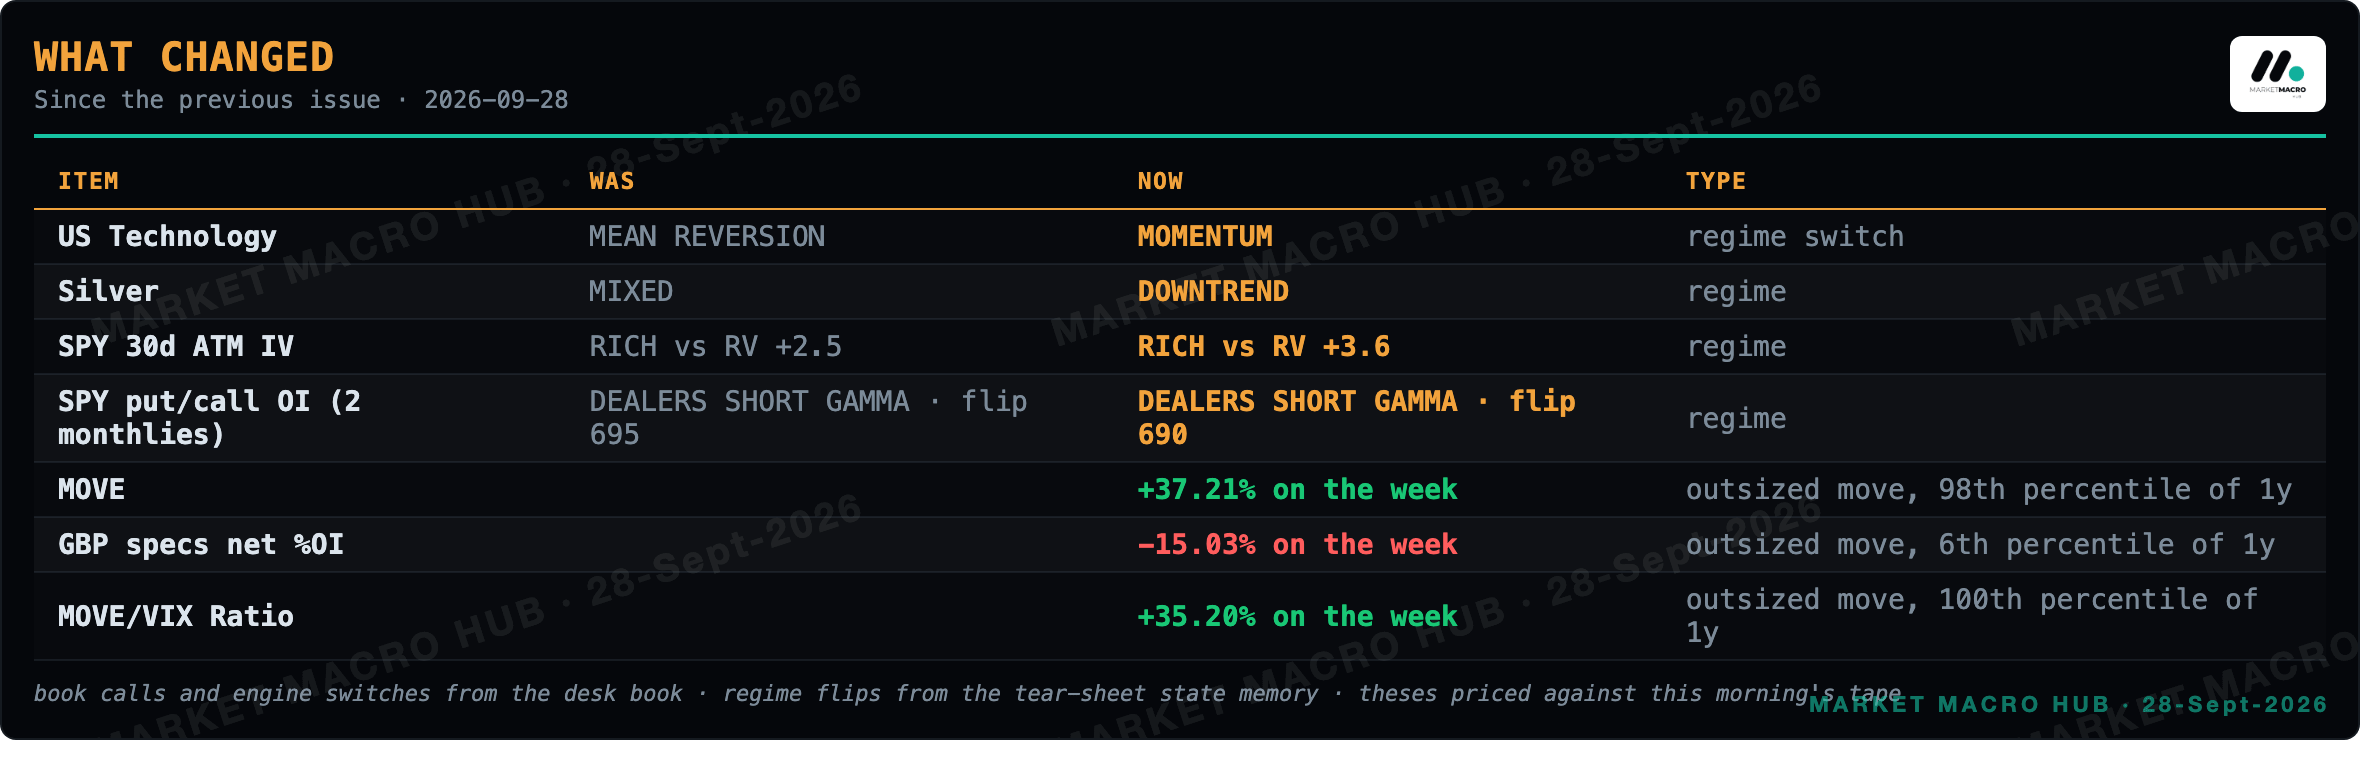
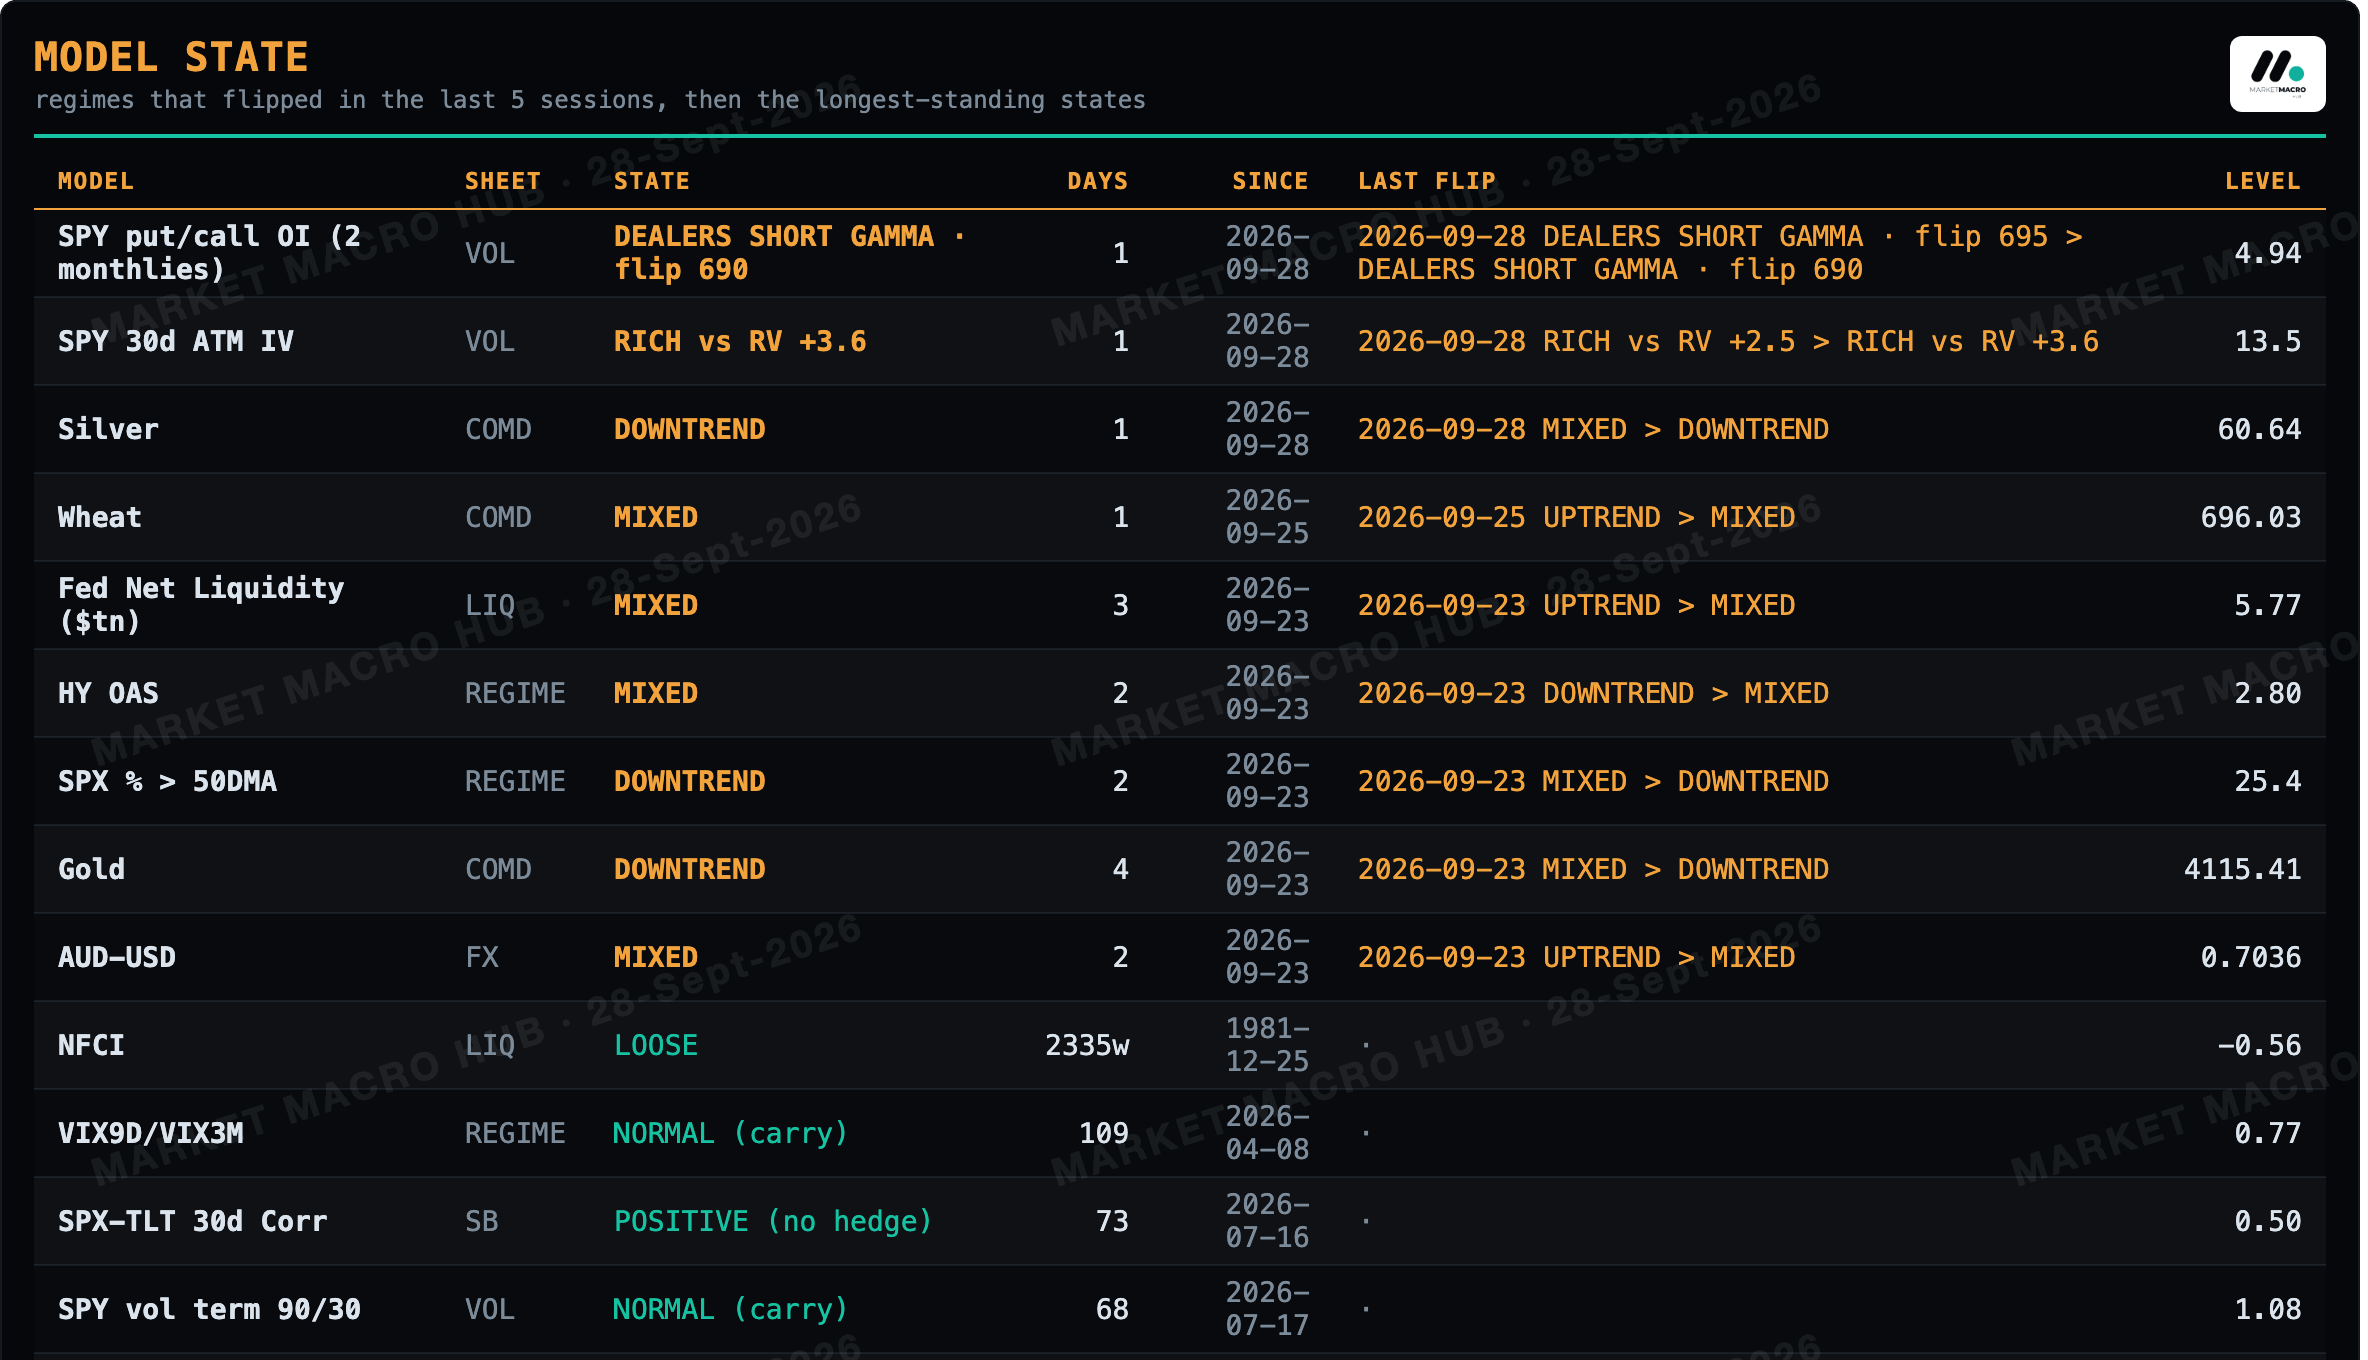
9 model states flipped inside the last five sessions: SPY put/call OI (2 monthlies) to DEALERS SHORT GAMMA · flip 690, SPY 30d ATM IV to RICH vs RV +3.6, Silver to DOWNTREND, Wheat to MIXED and more.
Measured Books · E1 to E5
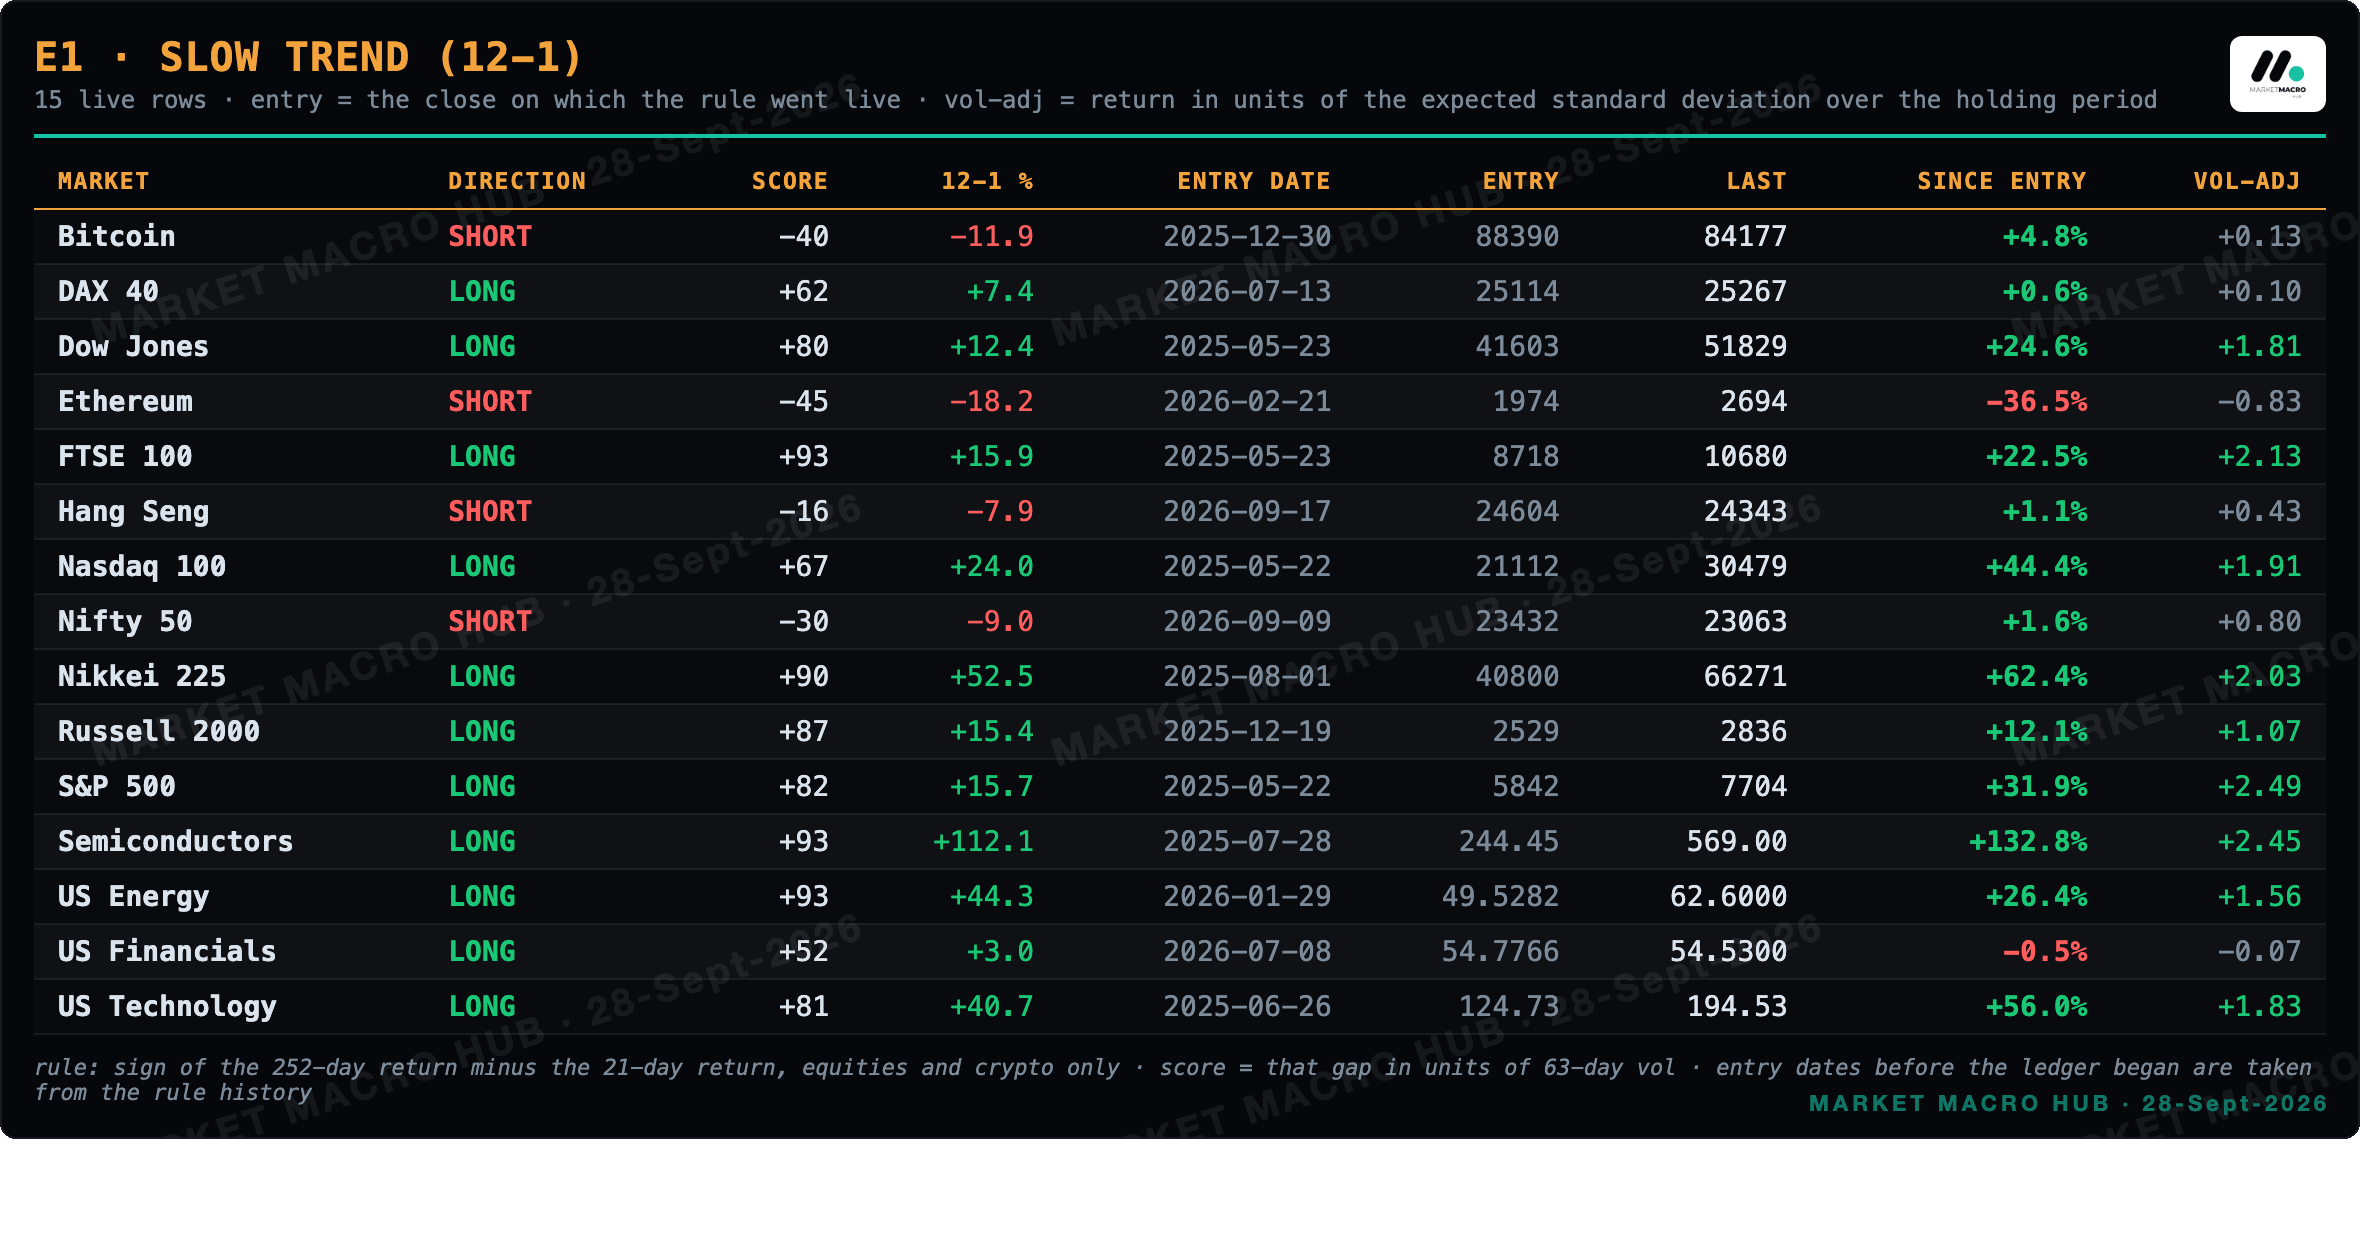
E1 since entry: 15 live rows, 13 positive, average +25.6%, median +1.56 vol-adjusted.
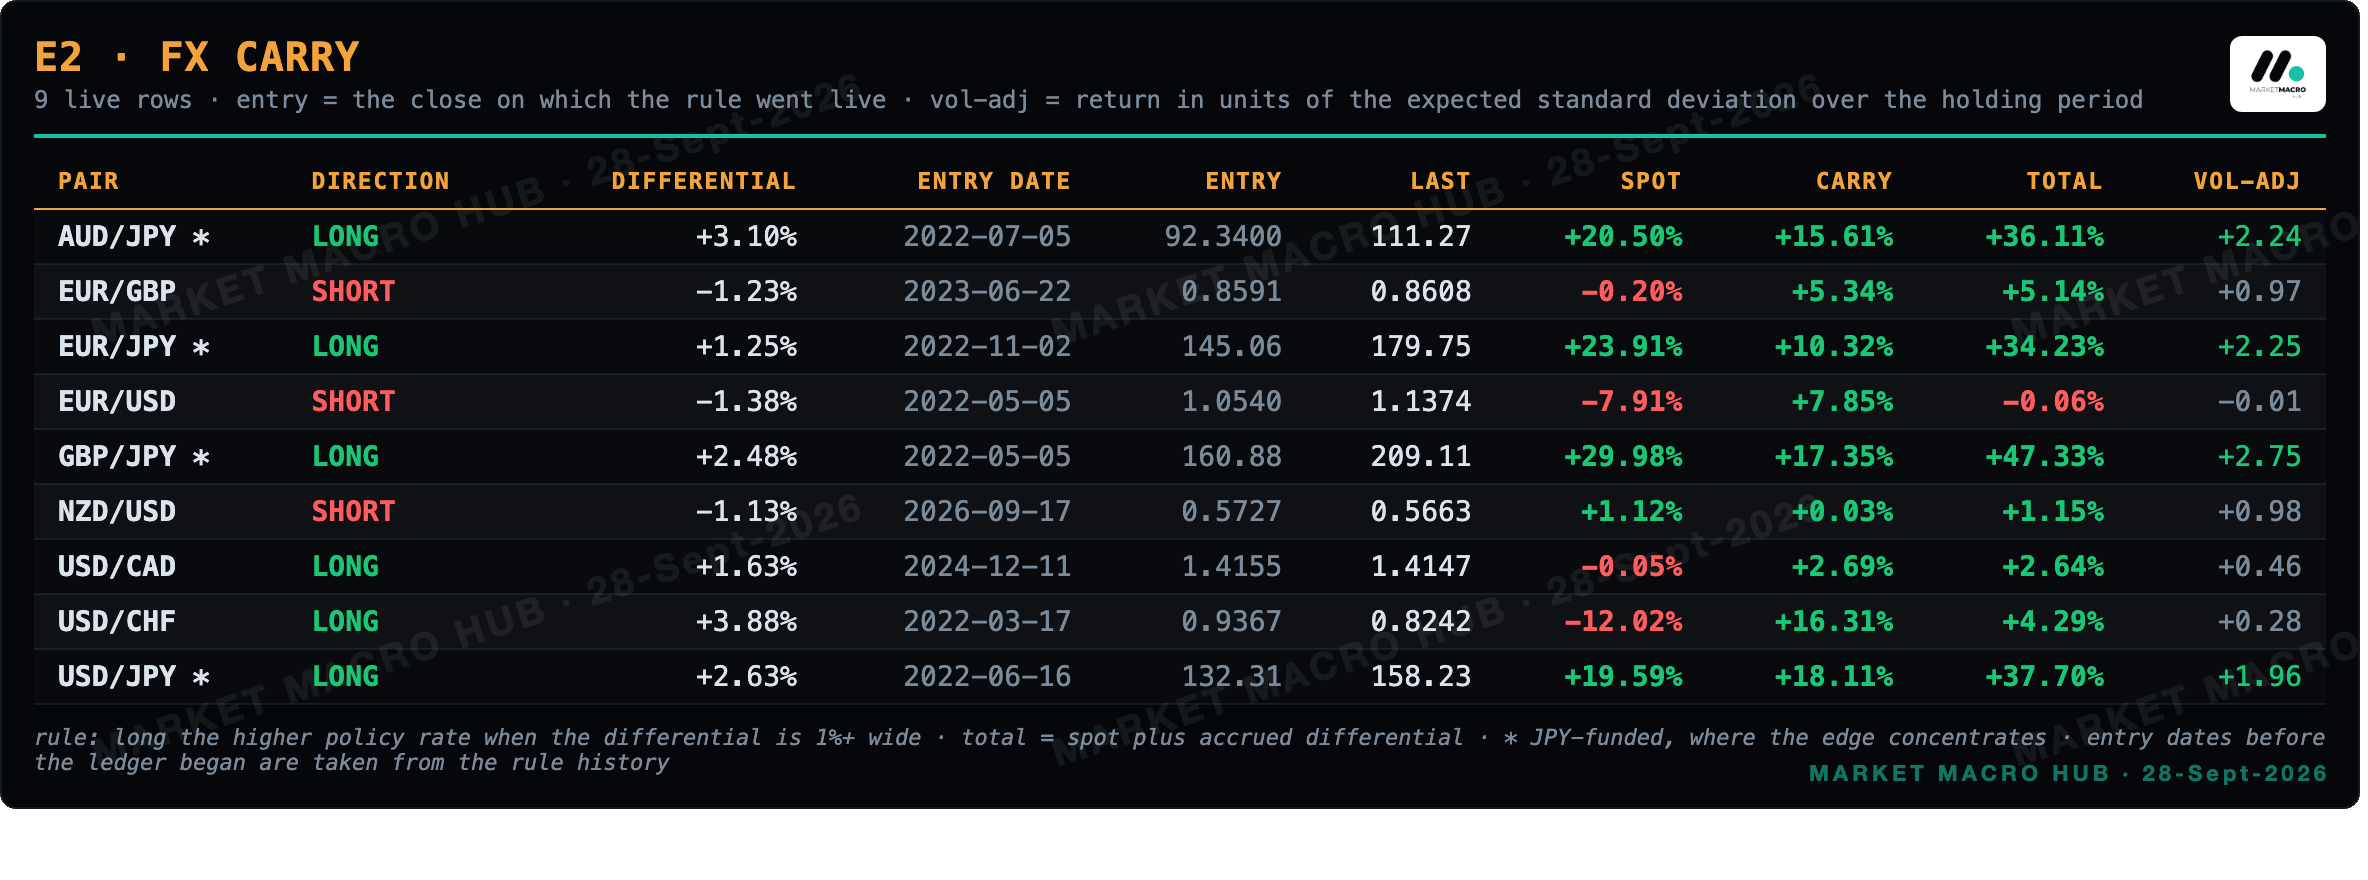
E2 since entry: 9 live rows, 8 positive, average +18.7%, median +0.98 vol-adjusted.

E3 since entry: SHORT US 2s10s from 2026-09-10, +8bp over 10 sessions (+0.85 vol-adjusted).

E4 since entry: LONG S&P 500 from 2026-07-08, +3.0% over 55 sessions (+0.57 vol-adjusted).

E5 since entry: 2 live rows, 2 positive, average +1.8%, median +1.11 vol-adjusted.
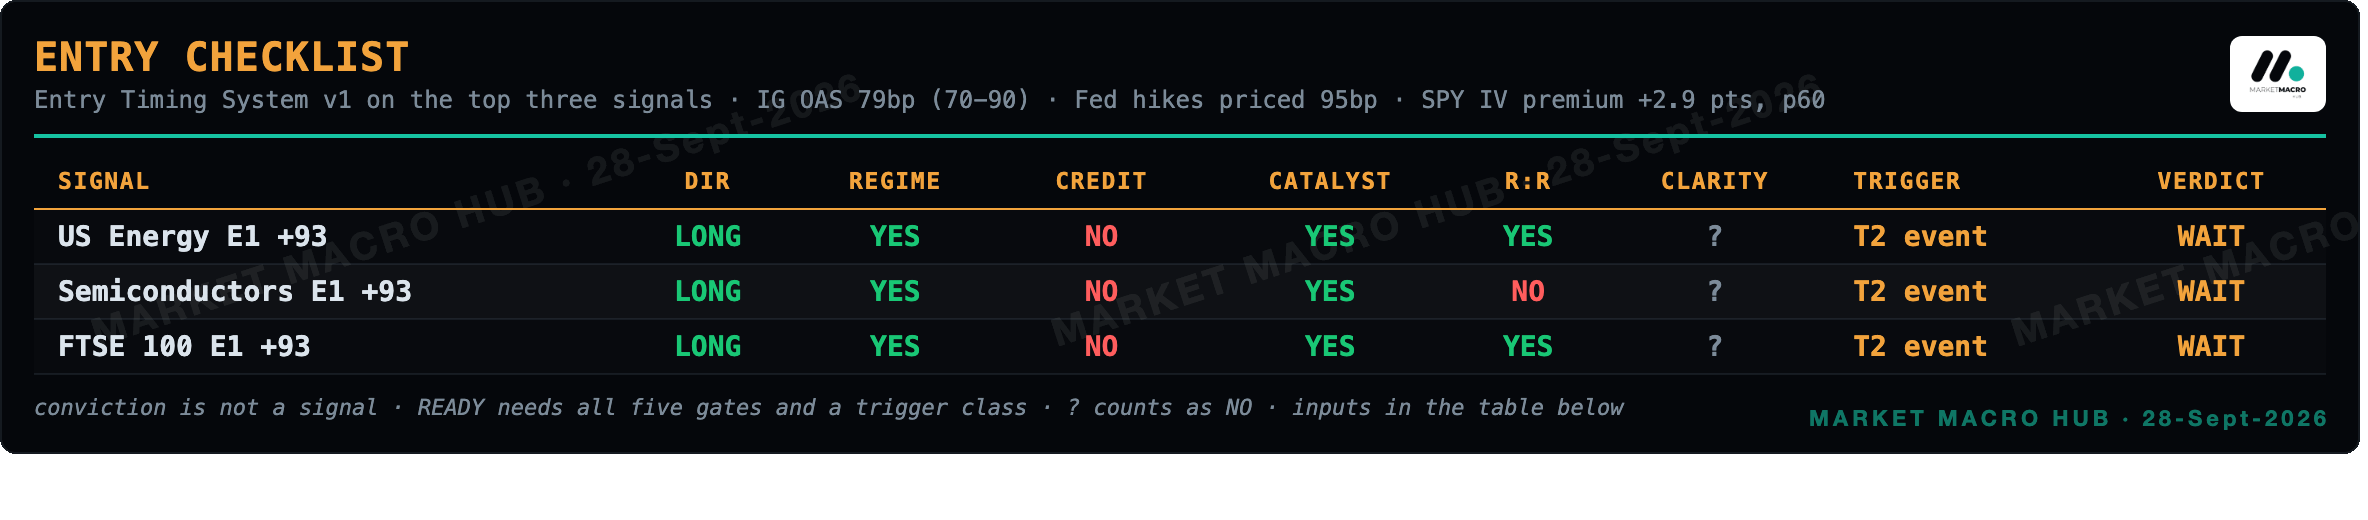
Entry Checklist
Sector Snapshot & Breadth
Scenarios for the Week
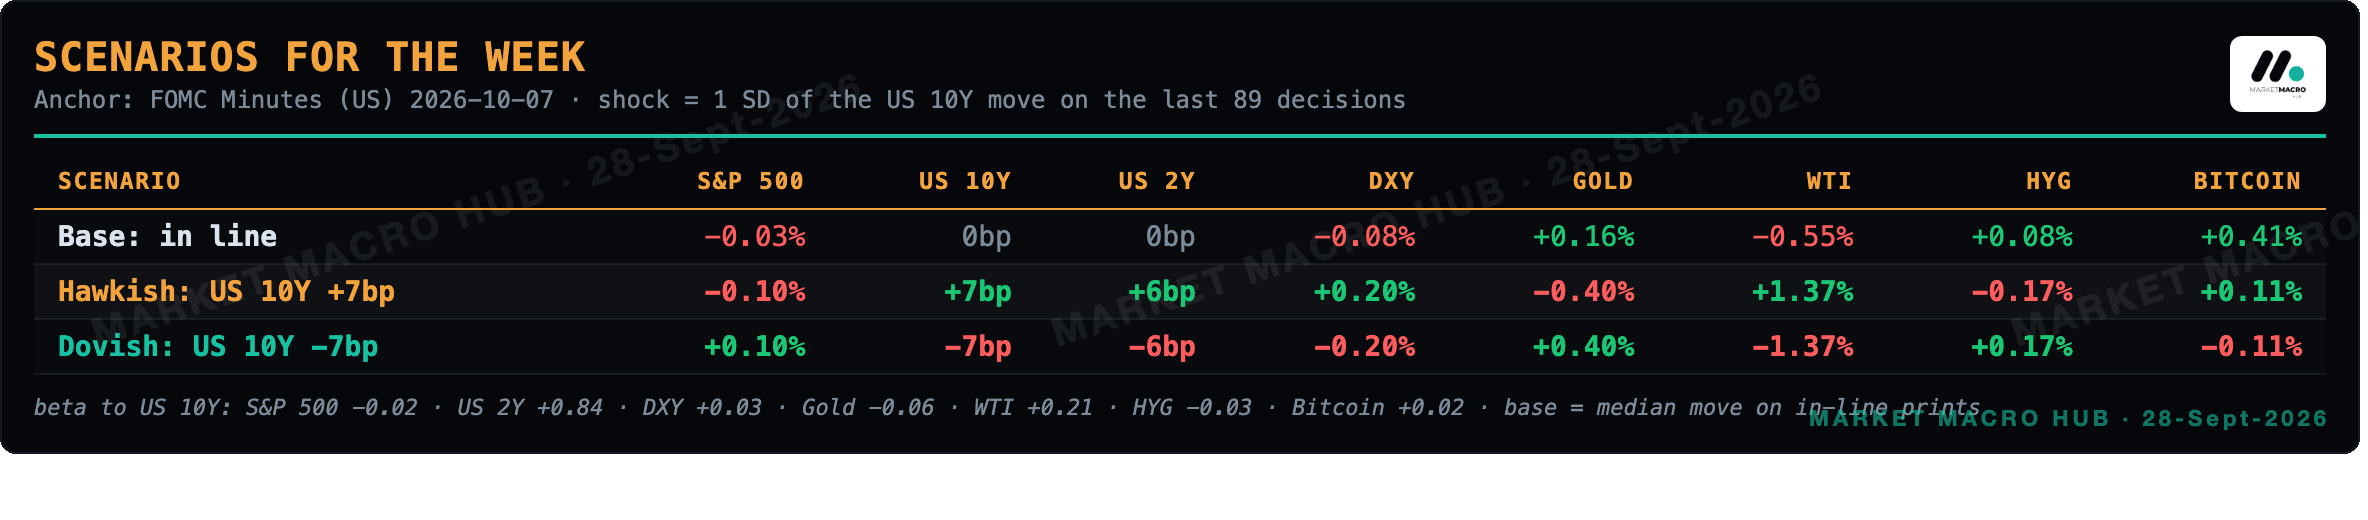
Expected moves are conditional means from 2-year betas to the anchor times a 1-standard-deviation event-day shock, not forecasts.
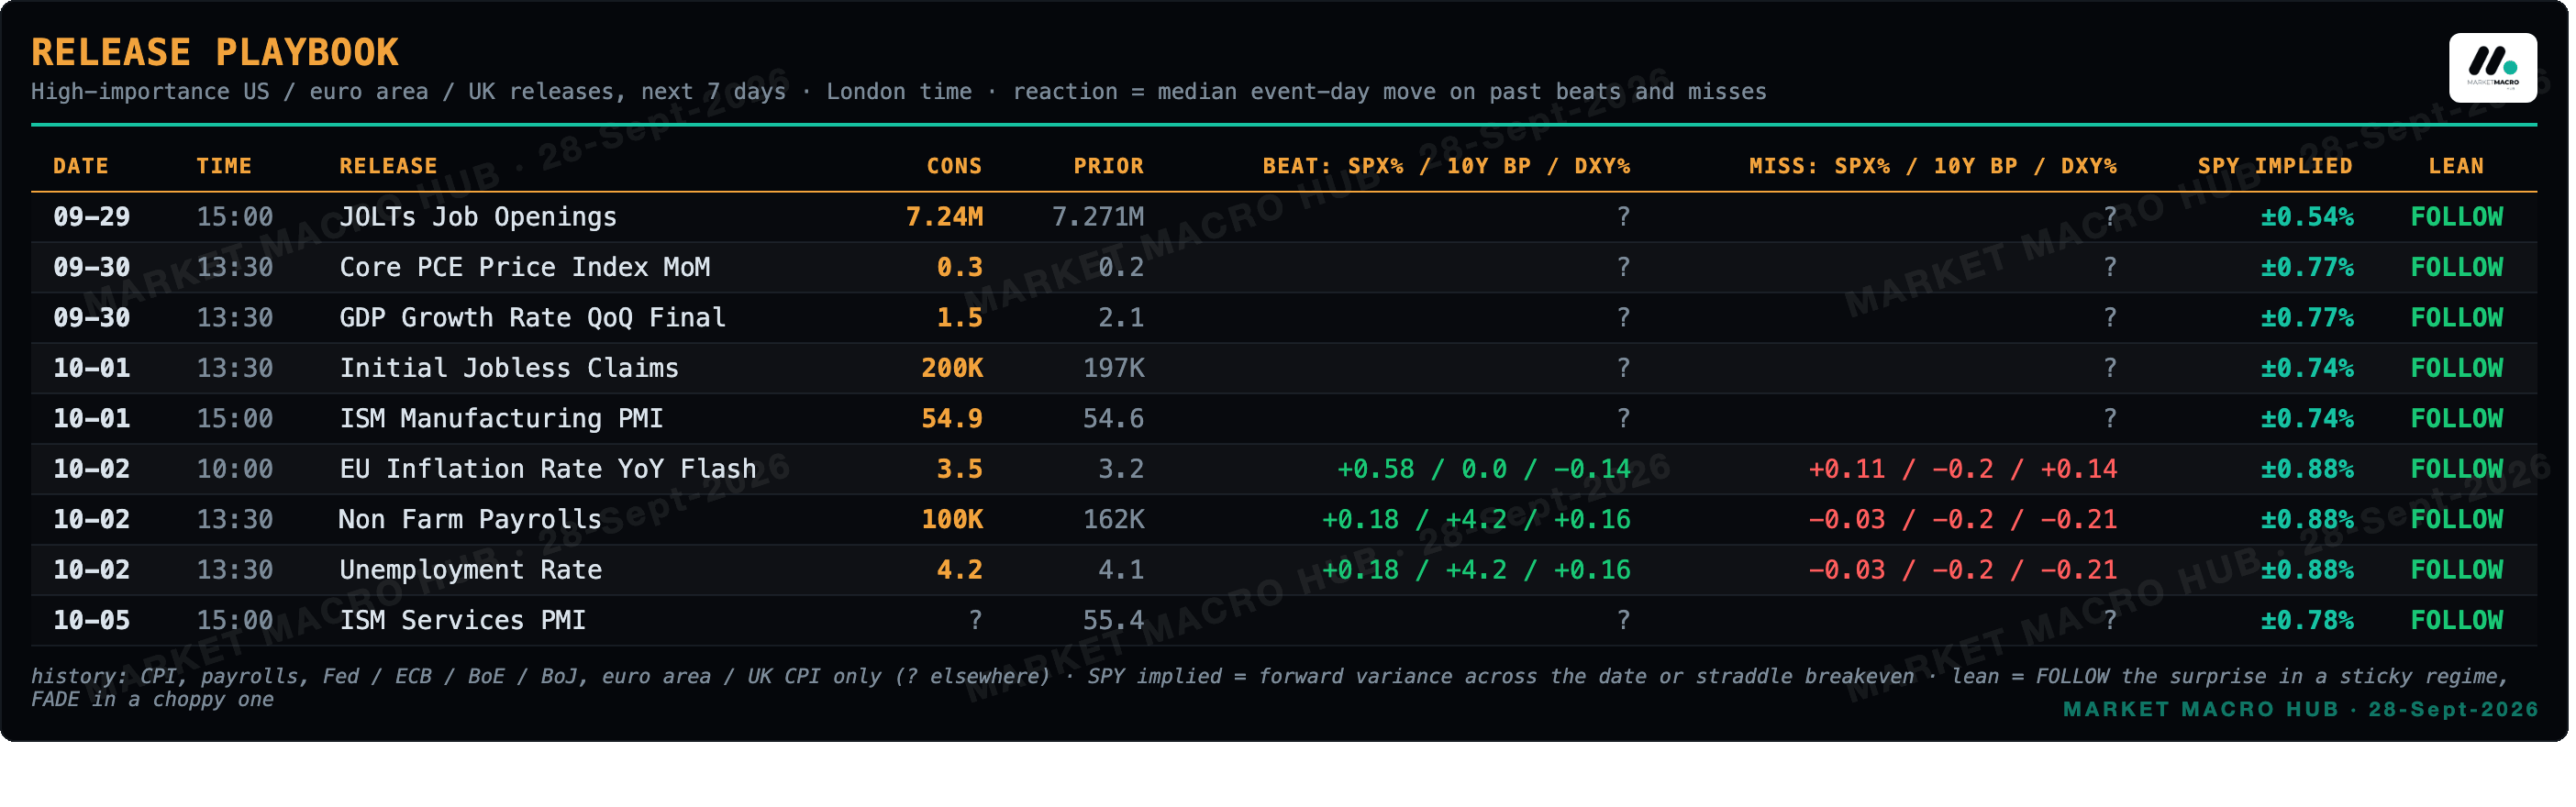
Release Playbook
Main Developments in Macro
TRUMP REJECTS IRAN HORMUZ DEAL, EXPECTS TALKS TO RESUME THIS WEEK
WTI +1.8%, BRENT +1.7% AS HOUTHIS TARGET RIYADH, SAUDI FLIGHTS DISRUPTED
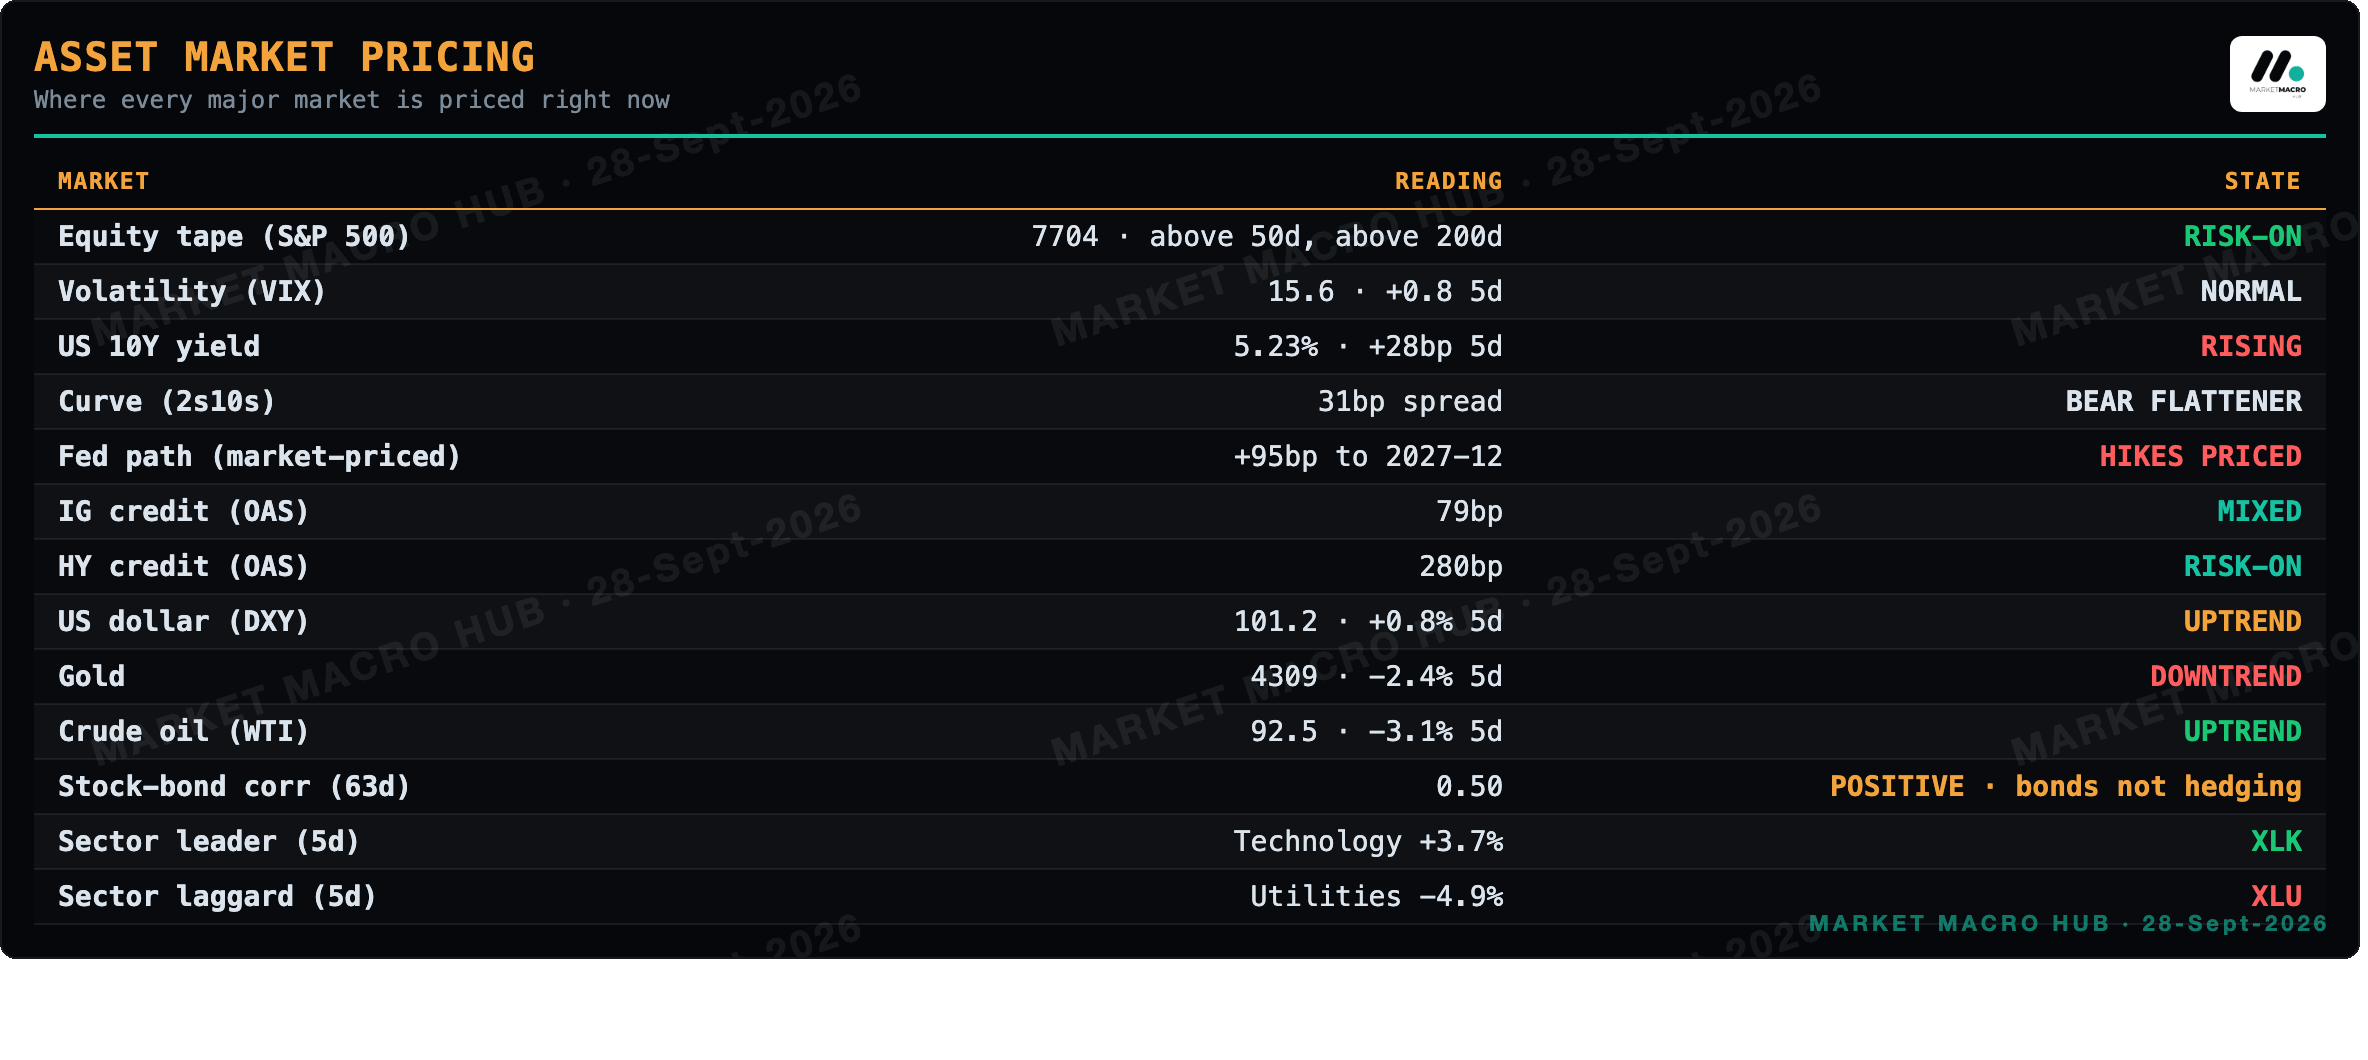
US 10YR YIELD 5.21% AS OIL STOKES INFLATION BETS AND FED HIKE PRICING
FED HAMMACK: POLICY MUST BE RESTRICTIVE, DOES NOT SEE CURRENT STANCE AS RESTRAINING ECONOMY
US-CHINA AGREE USD 30BLN RECIPROCAL TARIFF CUT, LAUNCH AI DIALOGUE
BESSENT URGES FED TO KEEP OPEN MIND, ARGUES AI AND DEREGULATION CURB INFLATION
SPOT GOLD -2.2%, SHANGHAI COMP -1.8% ON SLOWER INDUSTRIAL PROFITS
The data underneath is a soft-growth, sticky-price mix. Durable goods ex-transport came in at 0.3% against 0.6% consensus, but the Michigan final at 48.1 beat and claims at 197 undershot the 201 call. Dallas Fed slipped to 9.8 from 11.6. None of that argues for cuts, and with crude ripping the inflation side is doing the talking.
Cross-Asset Read
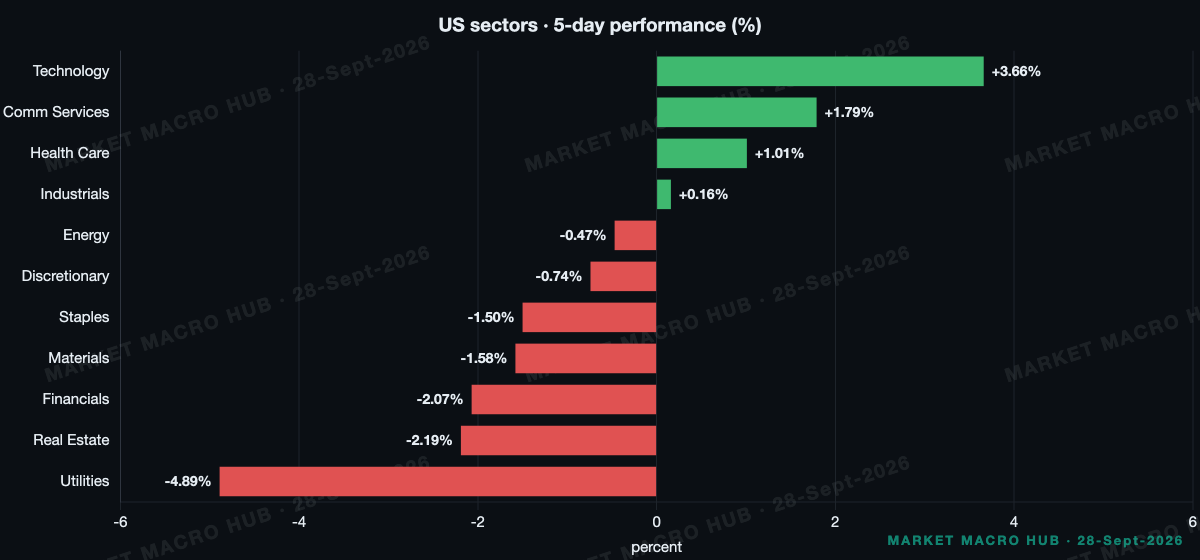
The tape that matters is rates and oil. I'm setting the equity split aside. On the prior session the sector contributions summed to -0.12pp against a -0.02% index, so the split explains none of the move and I won't read leadership into it.
The correlation shifts are where I'd focus a hedge. SPX versus 10Y yield tightened to -0.56 from -0.40, so a bond hedge on equities is working harder than a month ago as yields climb. The big one is gold versus 10Y at -0.44 now from -0.16, so gold is trading straight off the back-end, and with the 10Y +7bp that explains gold's soft morning. SPX versus Bitcoin jumped to 0.45 from 0.09, so crypto is no longer the diversifier it was.
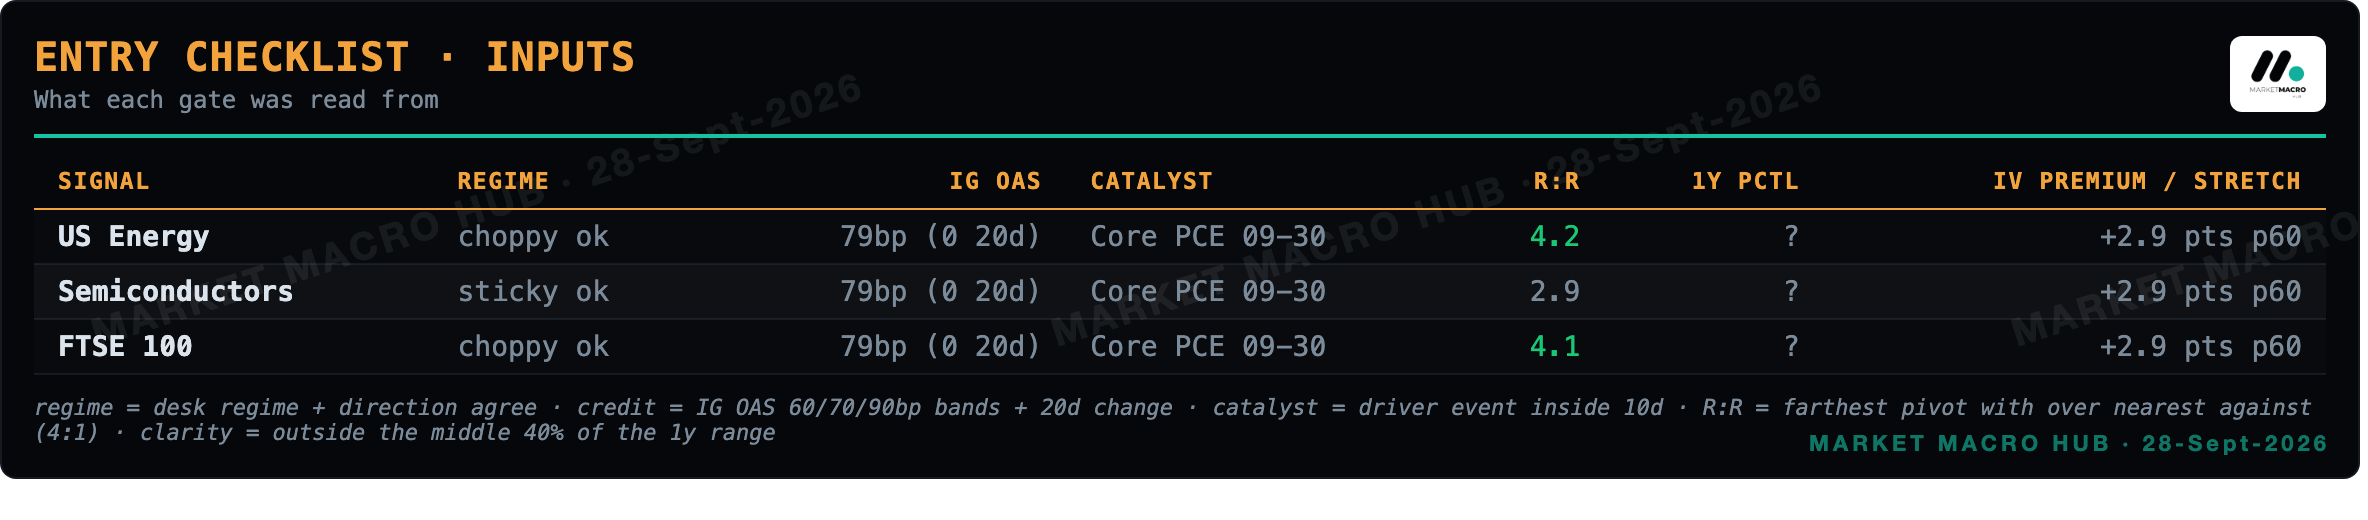
Credit gives me nothing to worry about. IG at 79bp sits at the tight, carry end of its own range against a 89bp mean, and HY at 280bp says risk appetite at the low-quality end is intact.
Rates & Fed Pricing
No month on the strip has a cut half-priced, so this is entirely a hike conversation. The first half-priced move is the November hike at 72%, and December is effectively locked at 100%. Cumulative tightening runs to +97bp at the 2027-09 peak of 4.85%, with the trough basically at spot. The terminal repriced +116bp on the week, and that is the whole story: oil rejecting a Hormuz de-escalation plus Hammack insisting policy isn't yet restrictive have driven the front-end. What changes my mind is the curve. With 2s10s steepening +5bp, the long-end is telling me the short-end path is too aggressive, and that keeps me fading the top of the strip.
The Week Ahead
Tuesday: JOLTs, CB Consumer Confidence and Case-Shiller. A soft JOLTs is the one that could challenge the no-cut strip.
Tuesday: Goolsbee, Musalem and Williams all speak, watch for whether they echo Hammack's restrictive line.
Wednesday: ADP at 72 consensus, the labour read that matters most for hike pricing this week.
Wednesday: GDP final at 1.5%, backward-looking, unlikely to move my read.
RBA hikes tomorrow as widely expected, relevant for the global hawkish backdrop but with little direct bearing on my book.
Tradeable Levels
Pivots off the last completed session (2026-09-24 / 2026-09-25). Levels marked * sit within 0.6 x ATR14 of the close.
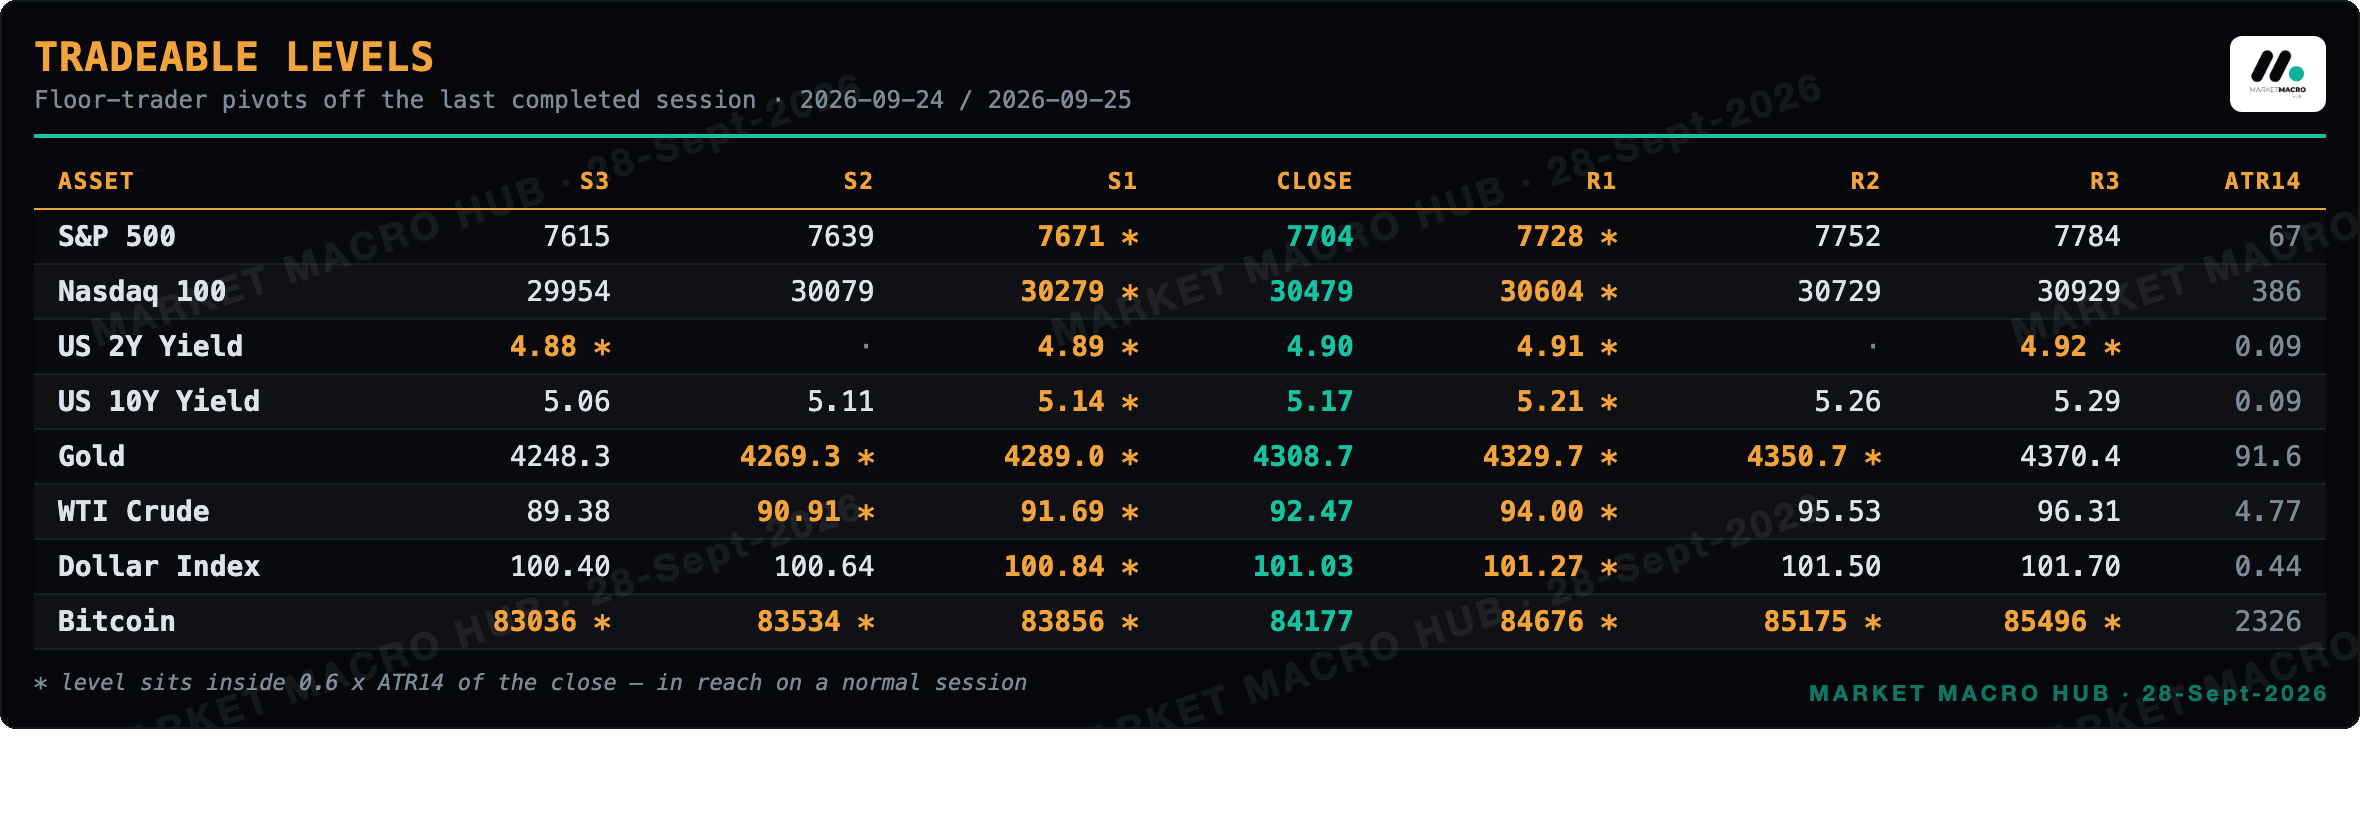
US 2Y Yield priced off a session whose range was under a third of normal travel, so that board is compressed and nearly every level sits in reach. Weekend crypto and half-day holiday sessions do this; treat the levels as loose rather than precise.
Vol Screen · Rich and Cheap Implied Vol
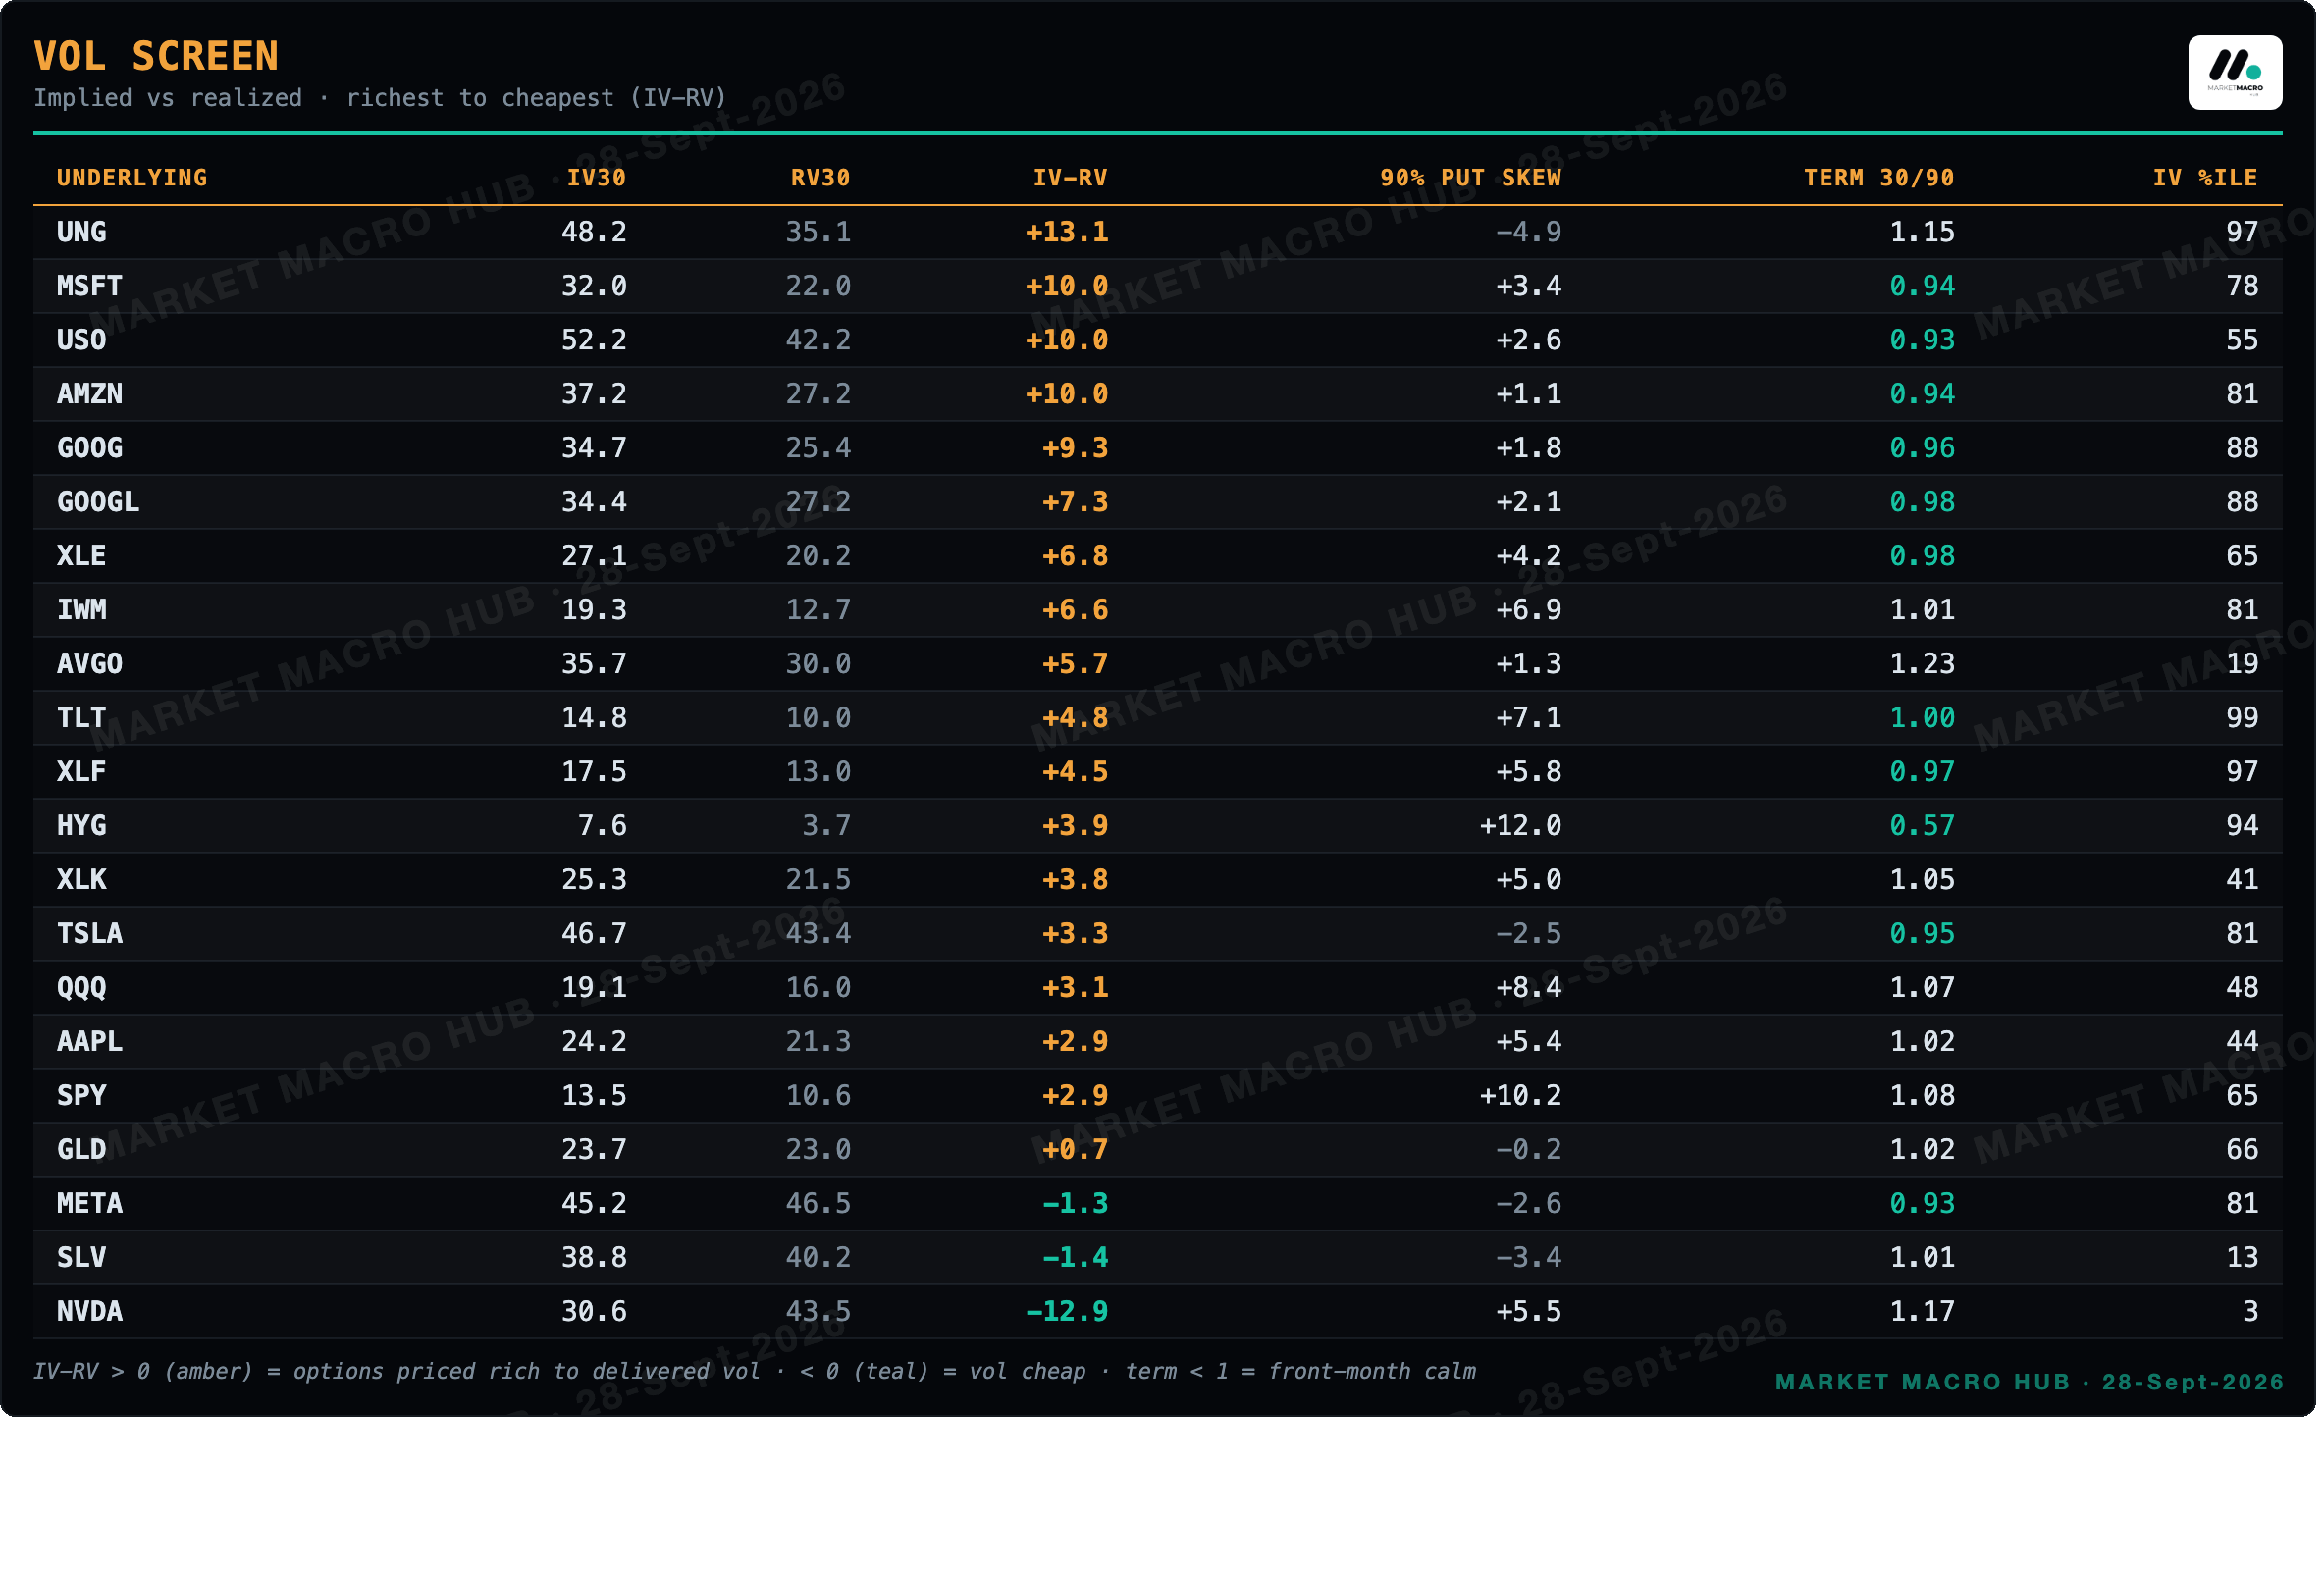
Positive IV-RV = options priced rich to what the tape is delivering (UNG and MSFT richest today); negative = vol going cheap (NVDA and SLV). Percentiles are each name's own archive history.
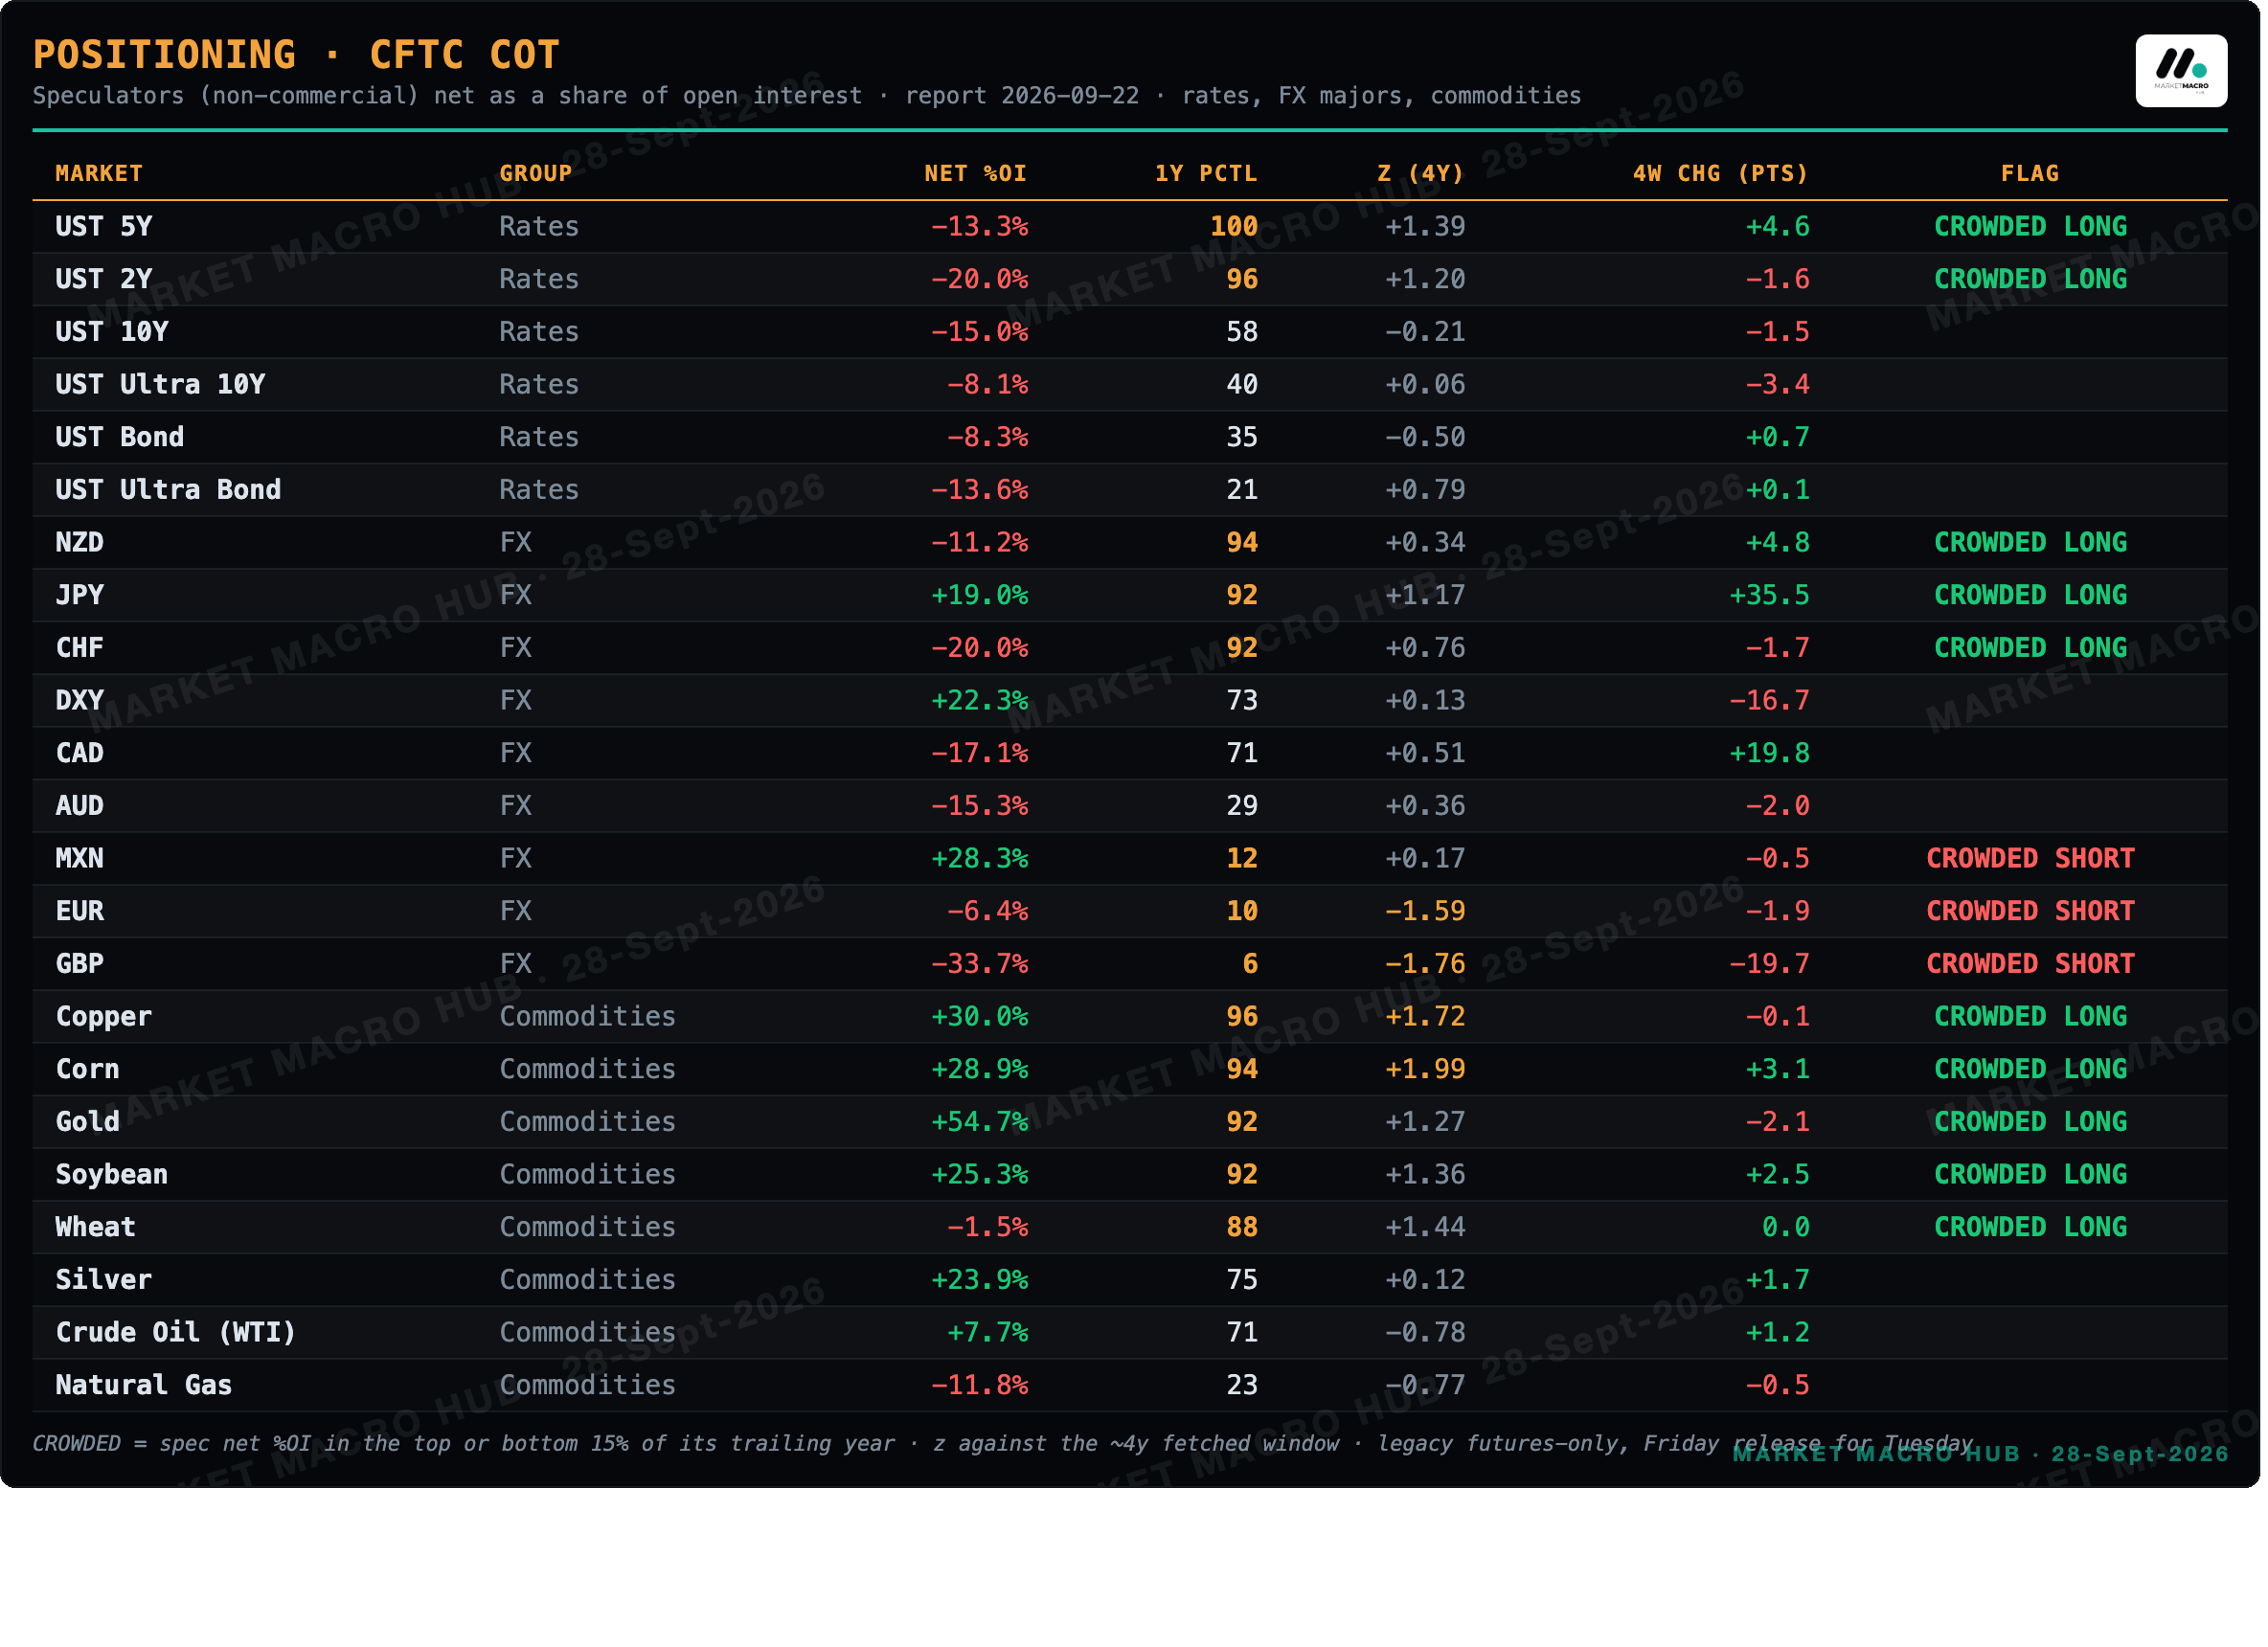
Positioning

The Measured Books · Monday Edges
E1 · Slow trend (12-1): live on equities and crypto only (measured noise elsewhere): US Energy LONG · Semiconductors LONG · FTSE 100 LONG · Nikkei 225 LONG · Russell 2000 LONG · S&P 500 LONG · +9 more
E2 · FX carry: signal only when the policy differential is 1%+ wide: USD/CHF LONG (+3.88%) · AUD/JPY LONG (+3.10%) · USD/JPY LONG (+2.63%) · GBP/JPY LONG (+2.48%) · USD/CAD LONG (+1.63%) · the edge concentrates in the JPY-funded crosses
E3 · Curve (2s10s momentum): slope 31bp, 0bp over 63 sessions → 63d trend FLATTENER (shorter-horizon state can differ · see appendix) · short 2Y (ZT) / long 10Y (ZN), roughly 2:1 DV01
E4 · Variance risk premium: POSITIVE, harvest is on (long SPX) · 51st percentile of its own history
E5 · Net liquidity (WALCL-TGA-RRP): $5.77tn, -42bn over 13 weeks → falling, a headwind
Disclaimer
The information in this publication is provided for informational and educational purposes only and is believed to be reliable, but its accuracy and completeness are not guaranteed. Nothing herein constitutes investment advice, an offer, or a solicitation to buy or sell any security, derivative, digital asset, or other financial instrument, nor a recommendation suited to any specific reader. All figures are drawn from the day's computed data set at the time of generation and may be delayed, revised, or superseded. Markets involve risk, including the possible loss of principal; past performance and historical relationships do not guarantee future results. Readers should conduct their own research and consult a qualified financial adviser before making any investment decision. The author may hold positions in instruments discussed. This publication is licensed for the personal use of the subscriber only: redistribution, reproduction, or resale in any form is prohibited. © 2026 MARKET MACRO HUB. All rights reserved.