
Part 2: What If The Fed Look Through Inflation?
The Fed Looking Through Inflation: What It Means Across Every Asset Class

If you haven’t already, check out the recent report and video breakdown from Part 1.
Report:

Video:
Let’s get into Part 2…
The FX Picture
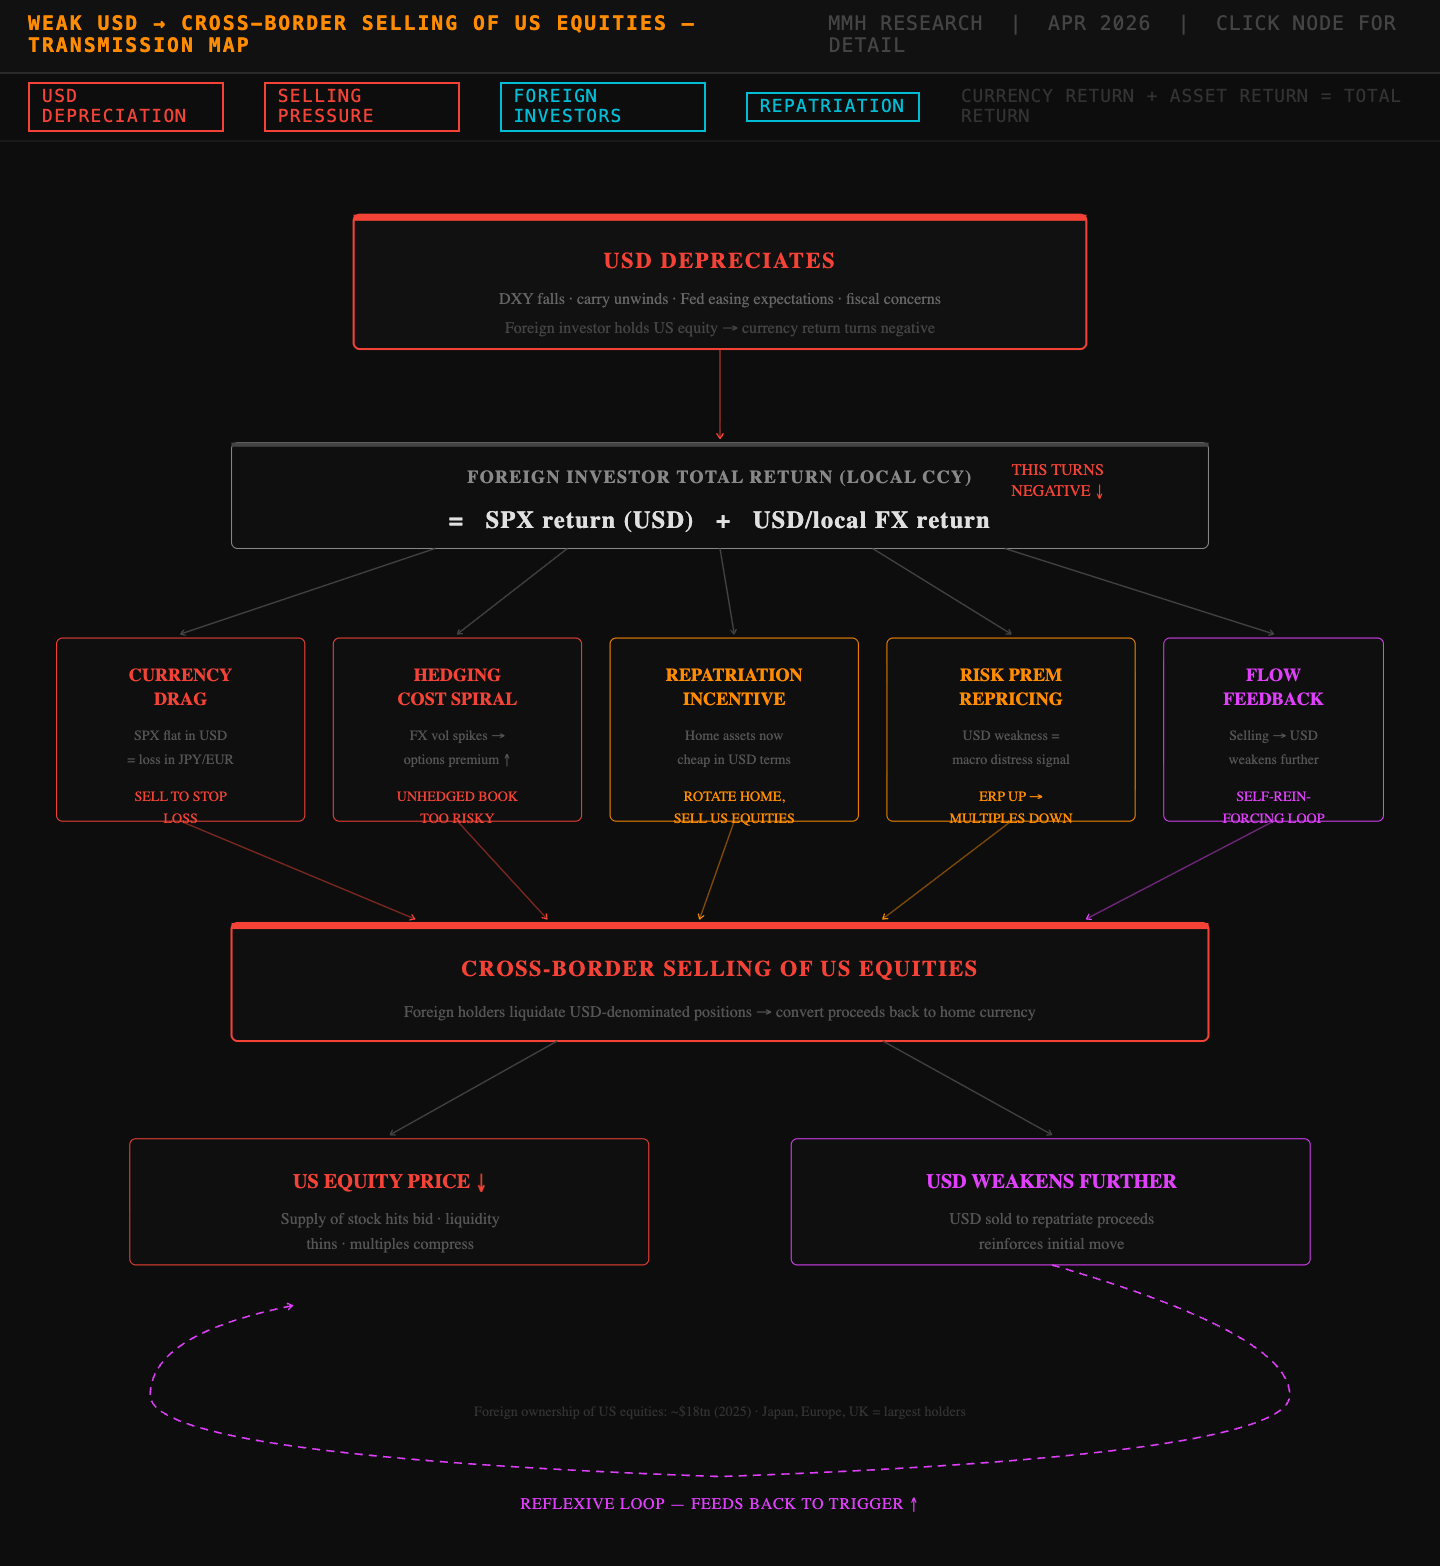
The dollar is the key variable for everything else right now and could be particularly important in 12 months given the implications of a weak currency on the equity market (depending on the extreme of weakness we see in the dollar). I always start with the rates dynamic, but ultimately if structural weakness hits the dollar in the next 12 months (likely) then people will start question, how much of a dollar weakness will equities be able to sustain before a bunch of cross-border selling happens.
I’ve tried simplifying this breakdown, but I’d say if you don’t get it just throw it into AI and ask for help. Focus on the bottom part of this flow chart, that reflexive loop can lead to a type of capitulation in equities. But I’m not trying to fearmonger, it’s just a scenario if we get this structural weakness in 12-18 months time.
So there are different factors driving the dollar in the short run vs the medium run because they point in completely different directions. In the short run, the flows have been driven DIRECTLY by the Iran conflcit which pushed real rates higher and finaly made the USD a safe haven again (which we didn’t see in April). So it’s is a geopolitically driven dollar bid that has LESS to do with the fundamental story.
The medium-term picture is structurally dollar negative. The fundamental logic for continued dollar weakness is: if the Fed is going to cut while other central banks are on hold, the forward rate differential creates outsized downside. There is also MASSIVE fiscal pressures on the dollar as it makes sense to structurally weaken it if Trump is going to be successful at reshoring manufacturing and actually competing with China.
A Fed willing to fight inflation aggressively means that they DIRECTLY keeps real rates high and therefore gives a stronger dollar (which is also a tail-risk to equities eventually), and attracts global capital into dollar-denominated assets and we’ve seen just how sensitive dollar flows are to real rates over the last few weeks. But a Fed that is hopeful about inflation staying above target for longer is a Fed that allows real rates to drift LOWER and adds a bunch of liqudiity to markets, which reduces the carry incentive to hold dollars.
The rolling correlation between real rates and the dollar have been extremely high. It is so important to not just focus on direction of a given asset, you want to see how changes in correlations happen in DIRECT correlation ot the implied volatility of the asset. Don’t let that confuse you either, I am for sure the first one that wants to dumb down ideas. Literally run a rolling correlation and regression model, then watch how changes occur as the imlied vol of the asset moves.
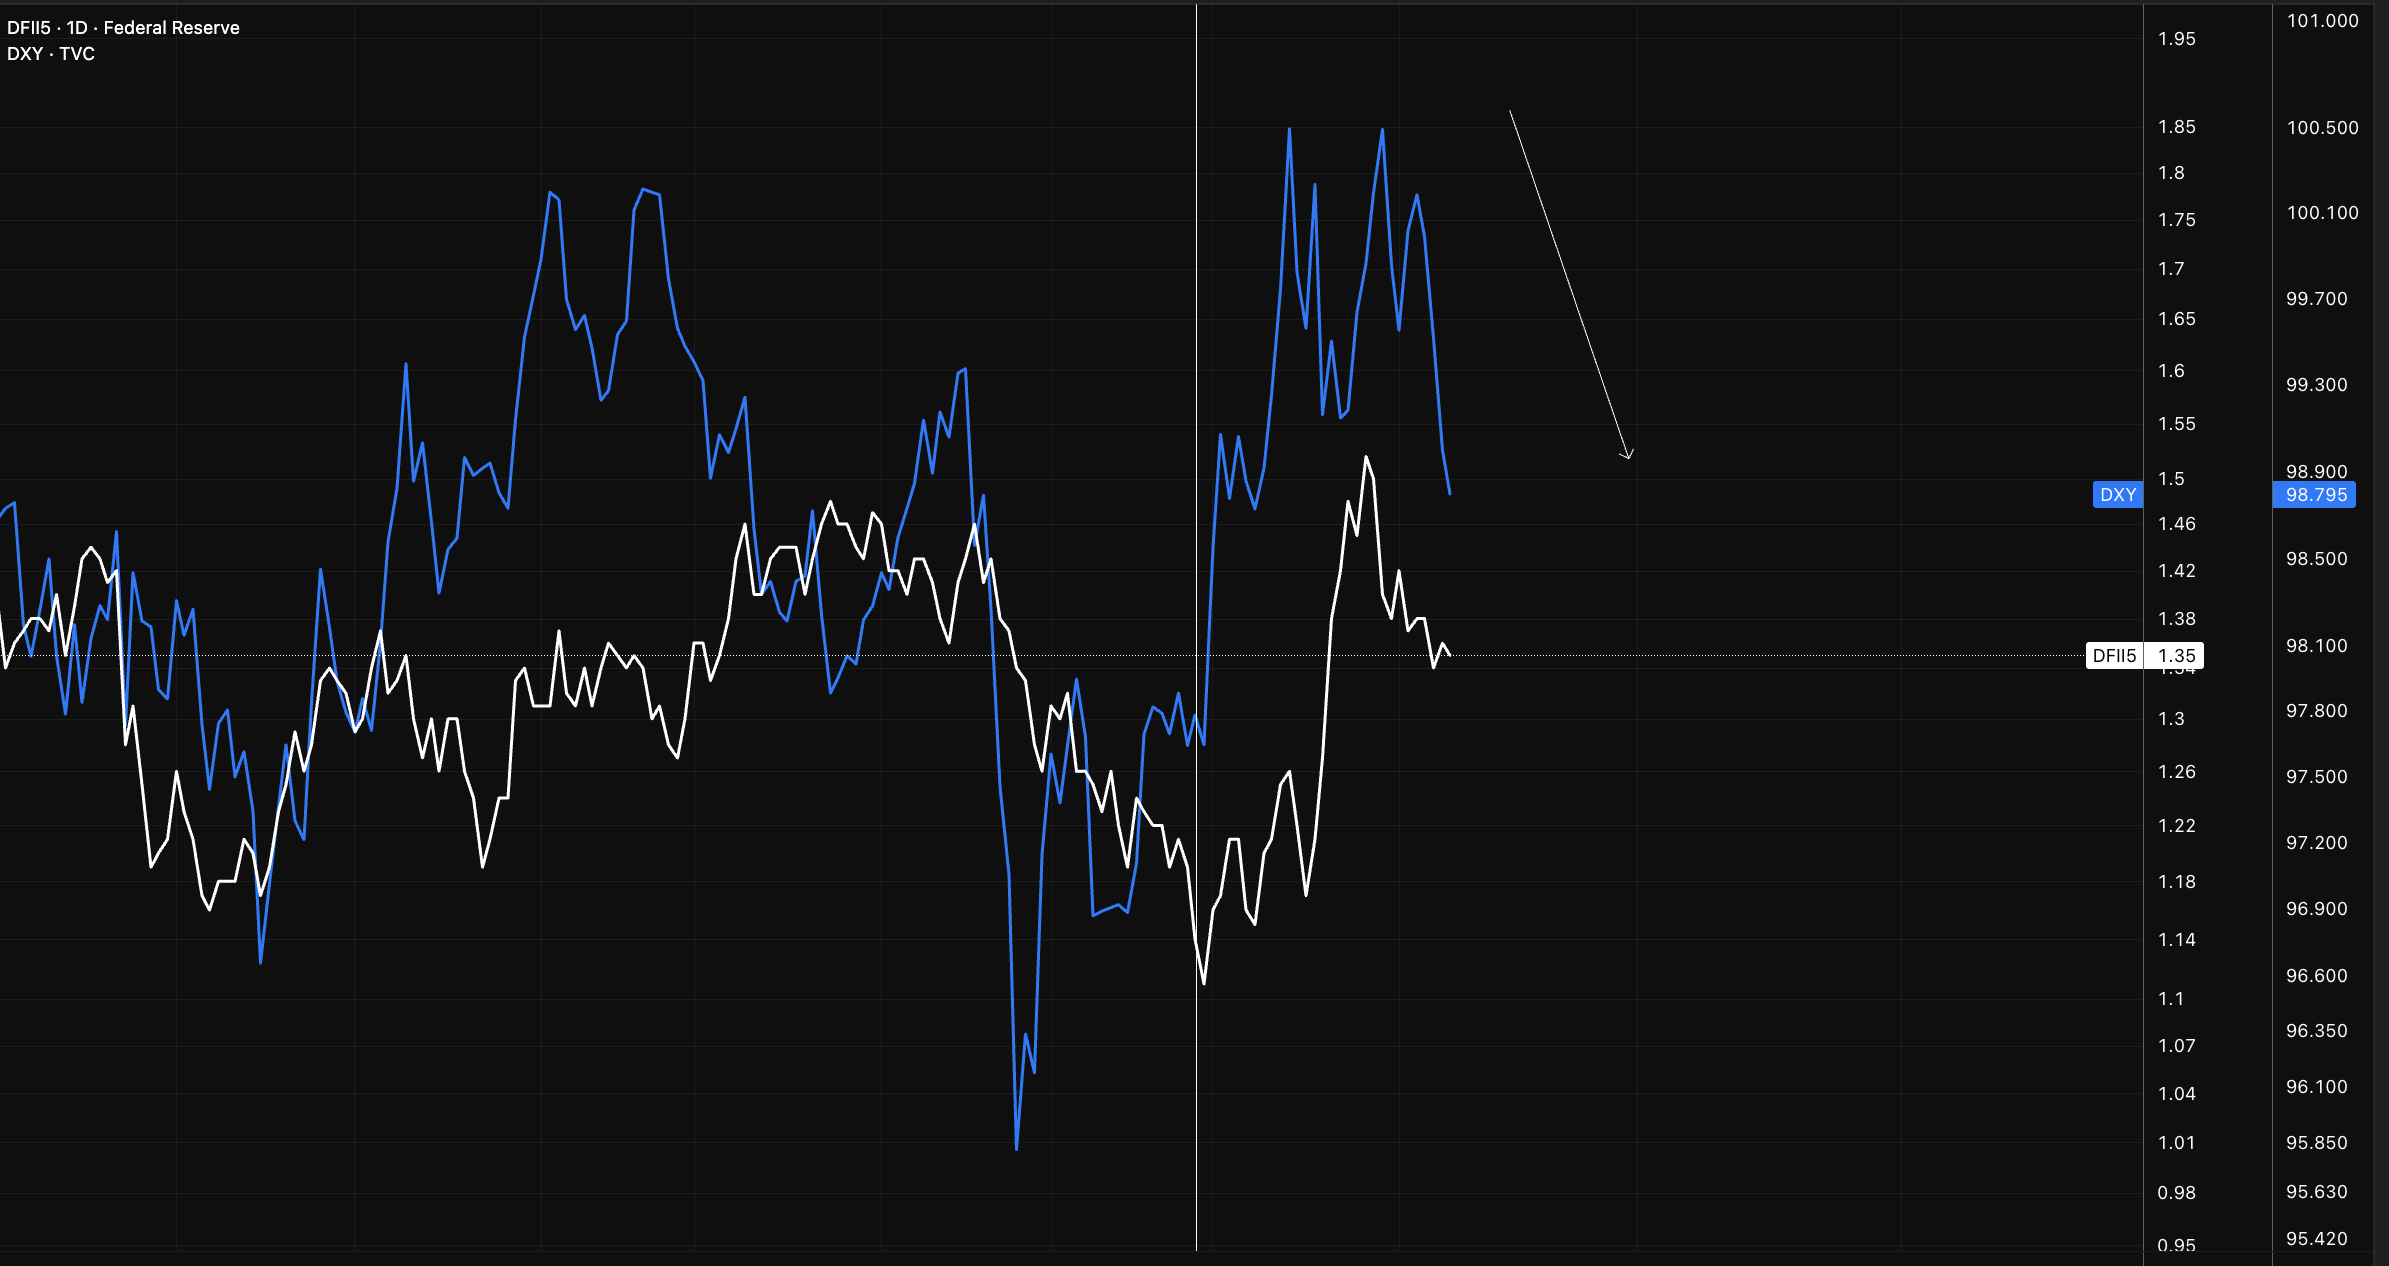
In the most recent video breakdown I spoke about the fact that real rates are the most imortant source of liqudiity because they affect it directly day to day. So when people think about things like QE, yes it’s important, but they only come about in particular macro regimes. I’d rather focus on a liqudiity source that is pulling and pushing liqudiity in and out of the system by the day.
The whole FX market is predominantly just differentials (infl swaps, real rates, growth etc) and the dollar’s strongest fuel is yieldd, but when US yields decline relative to Europe, the UK, or Japan, the dollar forfeits a portion of its carry benefit. That is EXACTLY what the looking through inflation posture delivers.
The euro has been and probably will be the biggest beneficiary because European growth has surprised to the upside and the ECB is no longer in a position where it needs to be dramatically more dovish than the Fed (particularly as they are net importers of oil and would likely need to keep their forward path more hawkish than the Fed).
Equities as a Function of Rates and FX
This was the visual I used in the most recent report, which explains why equities are a function of rates and FX, which is why you can’t run regressions the same. For example, you can ask “what % of movements in rates has accounted for returns in equities”, but you can’t ask “what % movement in equities has accounted for returns in rates” because that doesn’t make sense. Rates don’t move on equities, equities moves on rates and FX.
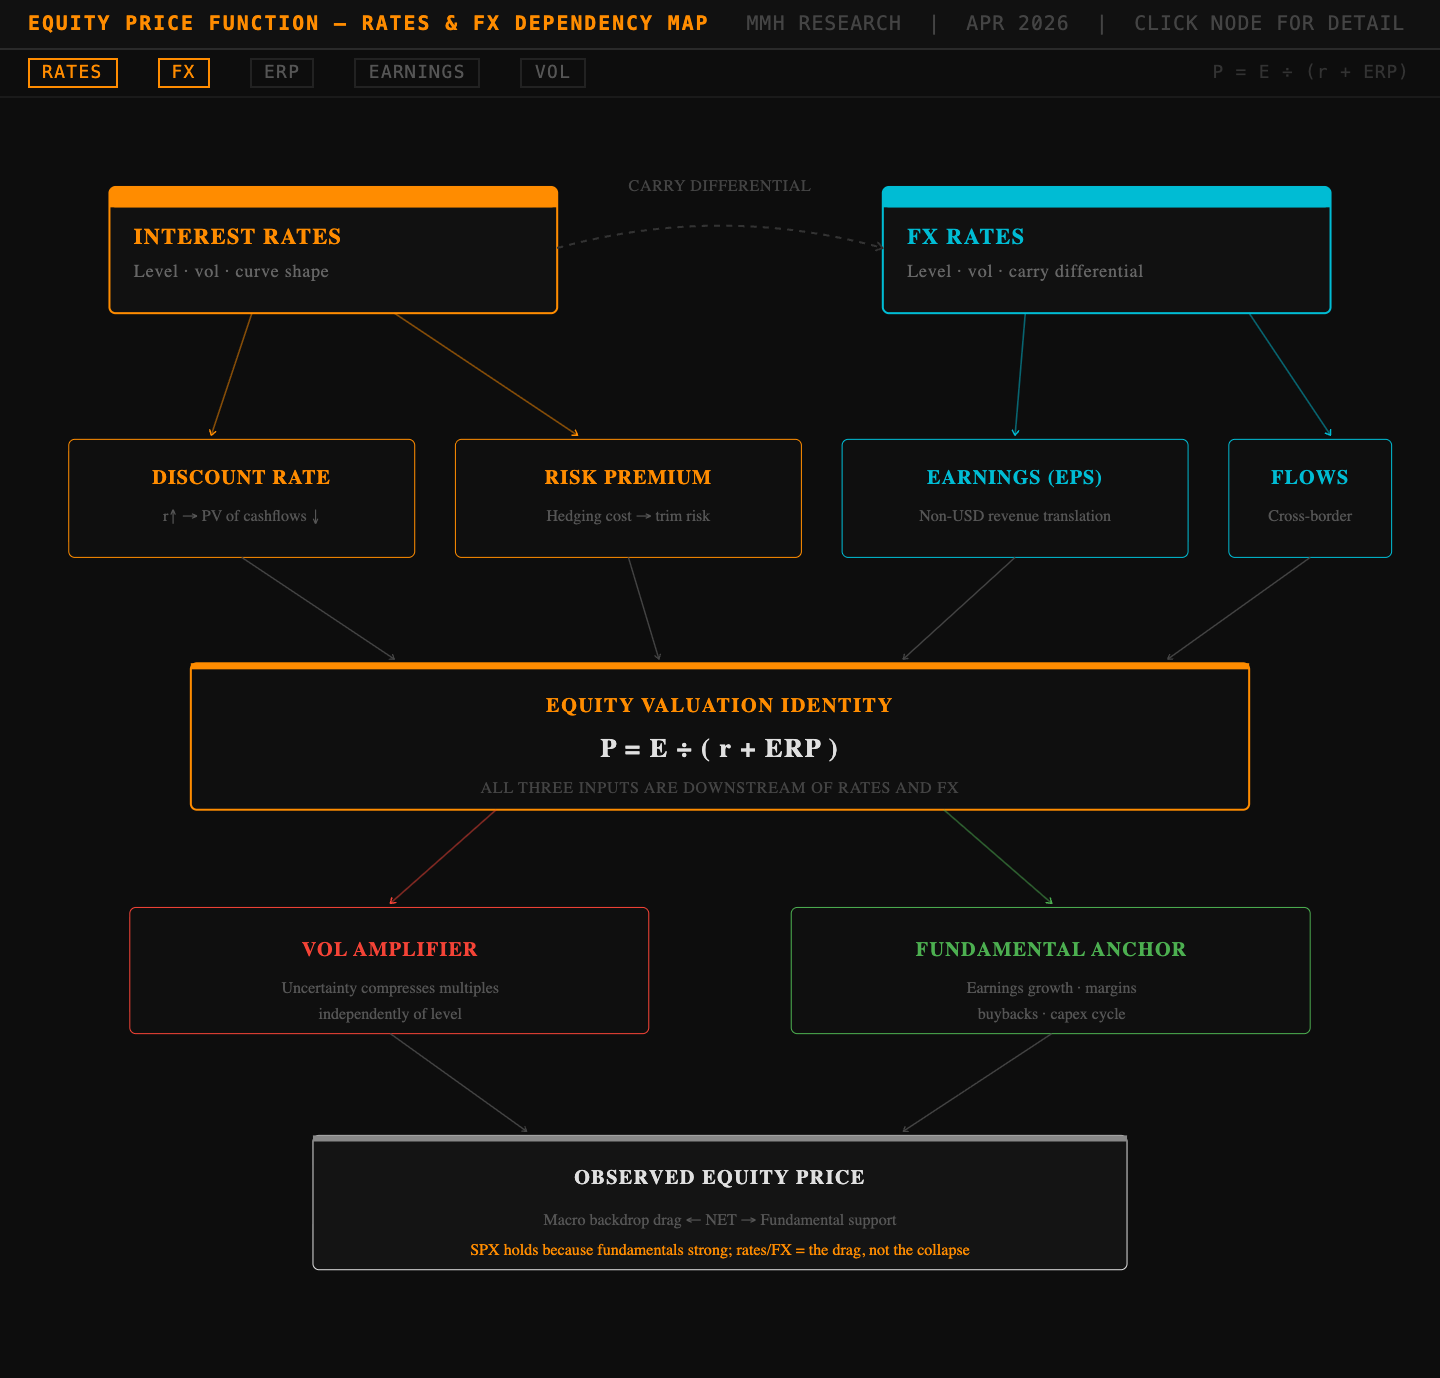
Equities are a rates and FX story with a fundamental overlay that mostly just determines who wins within the asset class rather than the level of the market itself.
The discount rate is rates. The earnings power of US multinationals is FX. Once you understand those two inputs, you have 80% of the equities story. When the Fed looks through inflation and real rates drift lower, the discount rate falls, which is DIRECTLY positive for valuations. That is the immediate bullish read that equity markets want to run with, BUT it is incomplete analysis because you then need to think about what the FX channel does to earnings and what the dollar’s trajectory means for the composition of returns.
The market level analysis is fairly simple with lower real rates, higher multiples, all else equal. The complication is that all else is NEVER equal. The reason the Fed is looking through inflation is that there is an inflationary shock that is partly supply-driven and partly tariff-driven. That same supply shock that is pushing prices up is also compressing margins for a lot of US corporates, particularly those with significant goods exposure and domestic cost bases that are rising.
So you can have a higher multiple from lower rates and simultaneously have a lower earnings number from the margin compression, and the net effect on price is not obvious.
The FX channel into earnings is the part that most people understand in the abstract but don’t fully work through the math on. The S&P makes roughly 40% of its revenues from outside the US. When the dollar weakens, those non-dollar revenues translate into MORE dollars, which is a direct EPS tailwind. That is the straightforward version of the story, and it is why broad dollar weakness has historically been associated with S&P 500 outperformance. But there is a subtler point which is, a weak dollar also makes US exports more competitive, which benefits certain industrial and tech companies that have meaningful global market share.
The contributons to retruns in the S&P will likely shift meaningfully as we move through the next couple months.
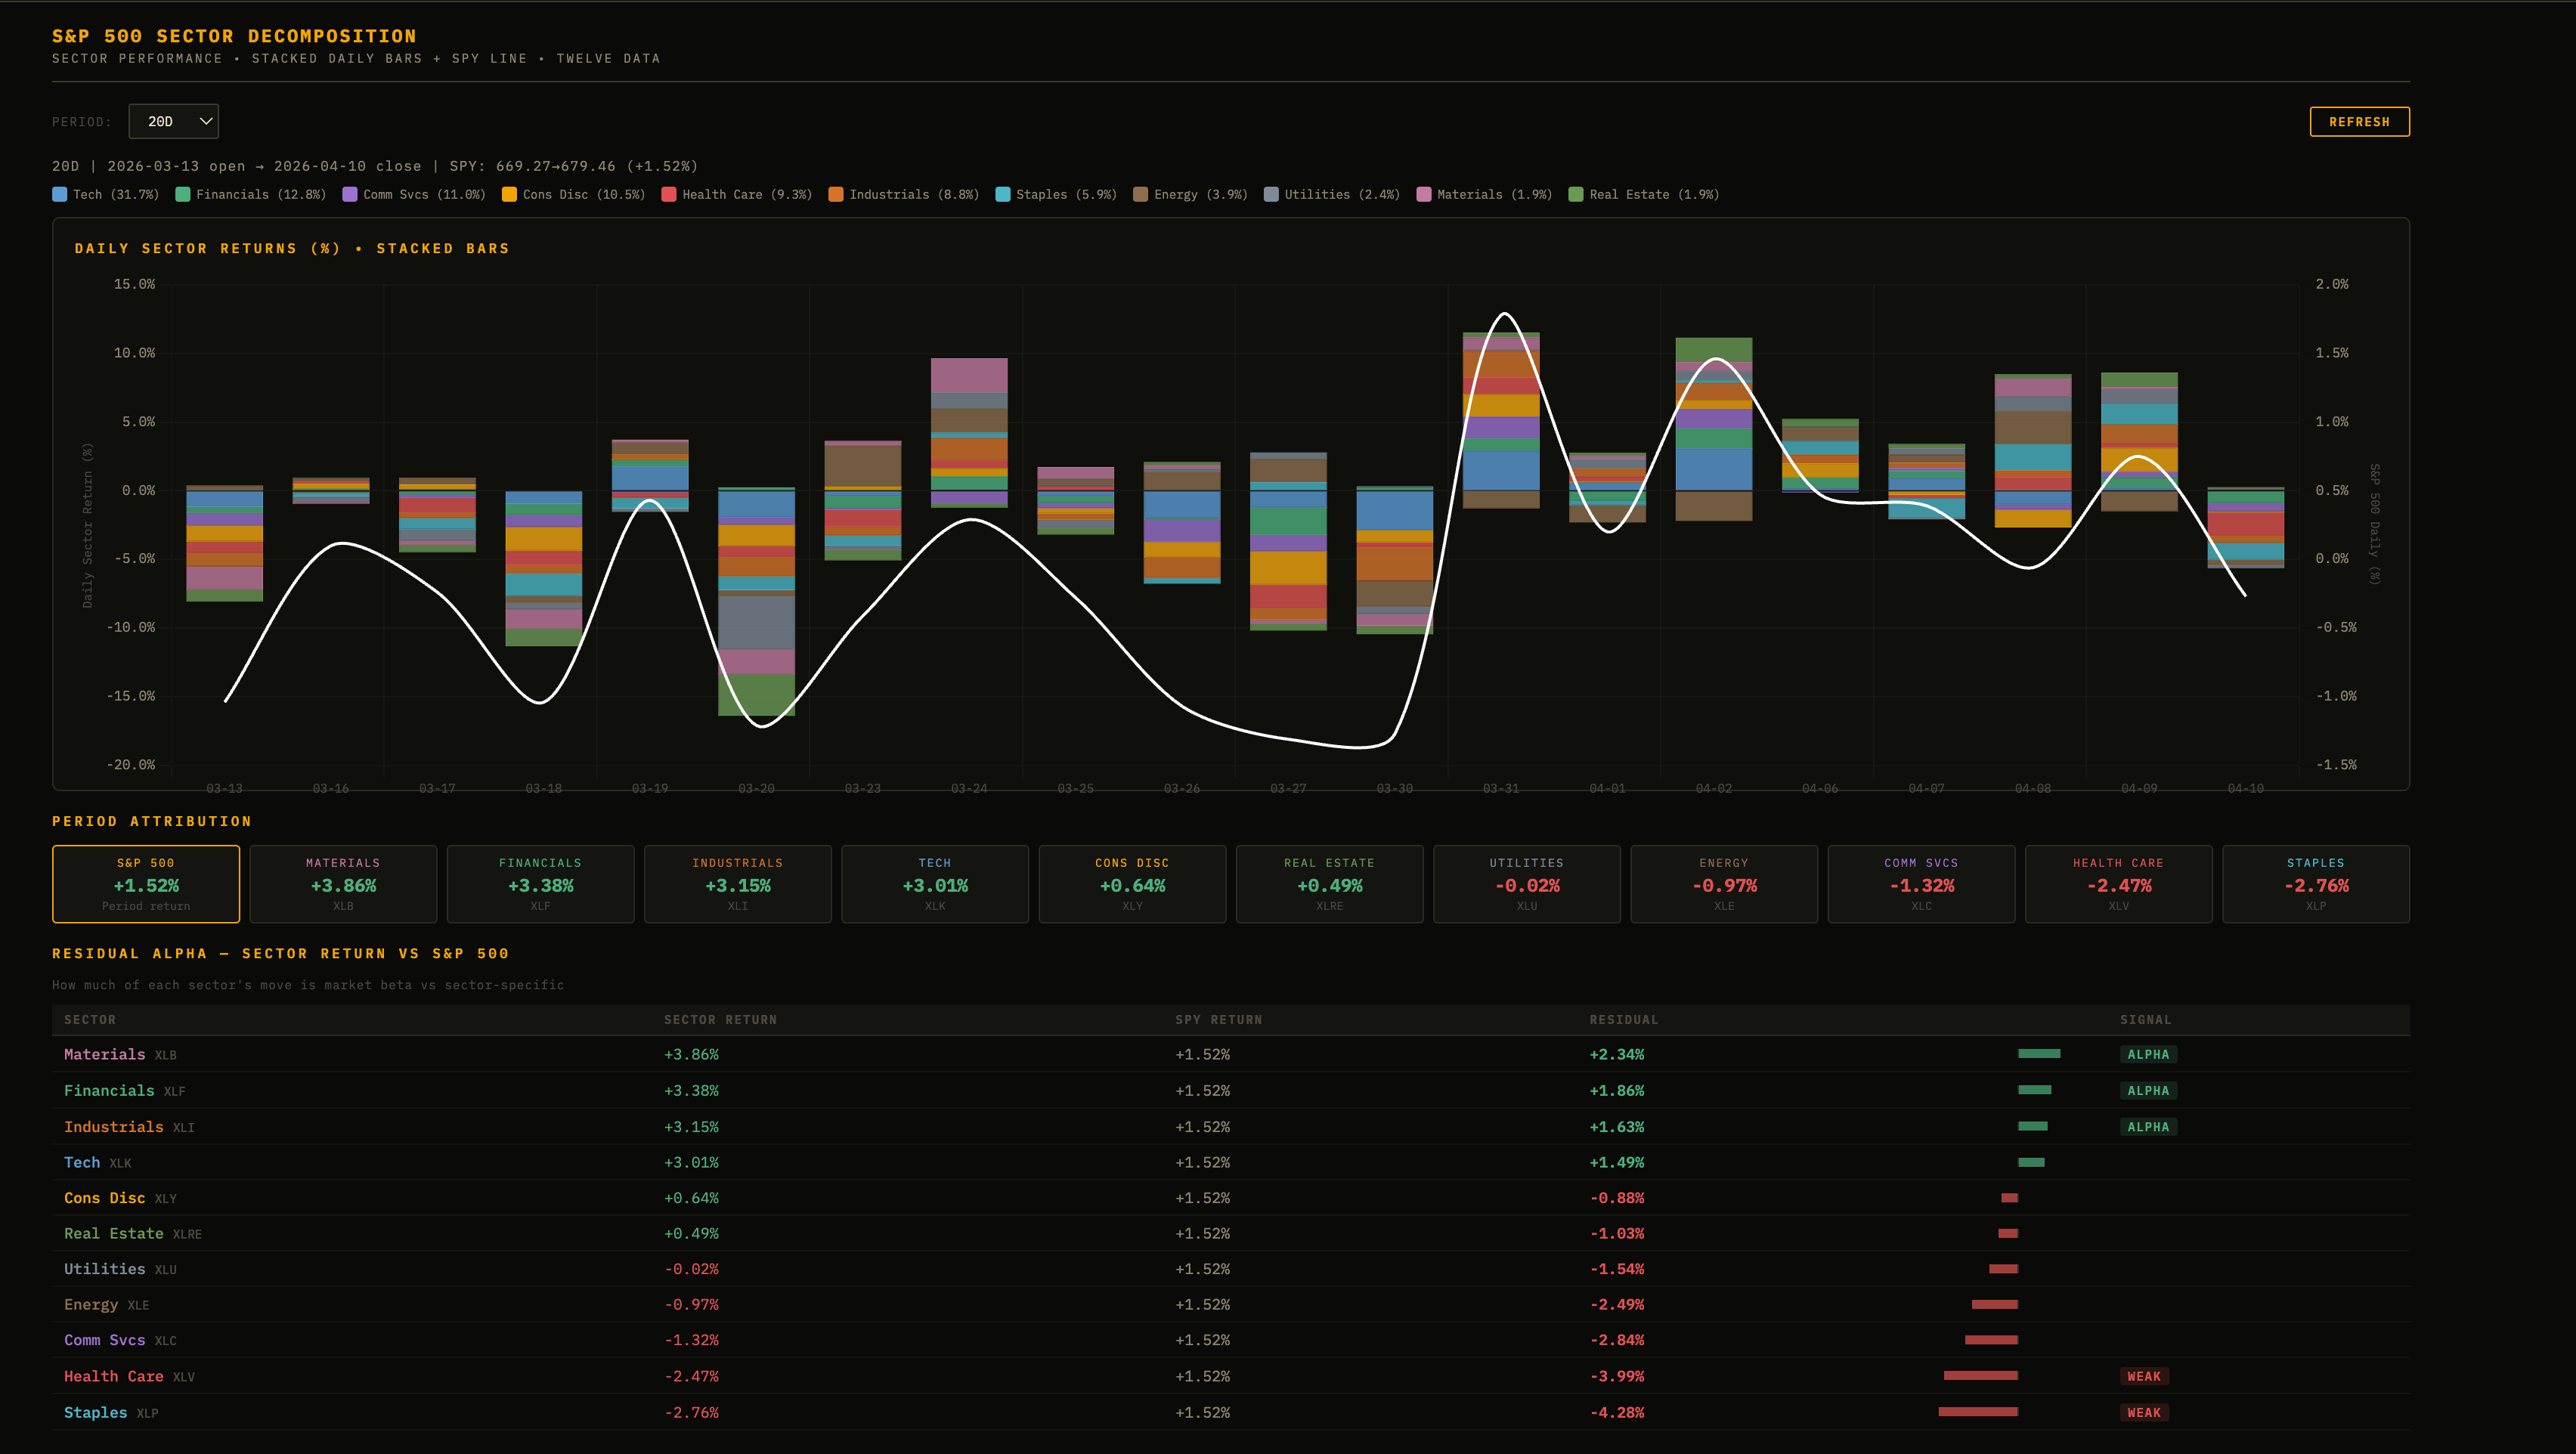
The Sectors That Win in This Liquidity Regime
The liquidity unlocking from a Fed that is NOT hiking is most directly felt in the sectors and asset classes that are most sensitive to the cost of capital. Let’s go through them properly.
Commodities and real assets are the most DIRECT beneficiary of inflation being tolerated above target. If the market believes the Fed is not going to crush inflation, then real assets that act as inflation hedges see structural inflows and you’d probably see XLRE massively outperform (I don’t have an egde on the bottom-up in real estate, but top down would look great).
Real estate is a DIRECT beneficiary because it’s the most explicitly interest rate sensitive sector in the equity market. Mortgage rates follow the 10y more than the Fed funds rate but the signal effect from a more dovish Fed/forward curve does filter through to lower longer-term rates at the margin which improves affordability and cap rates simultaneously.
Small caps are the most interest rate sensitive equity category because they have more floating rate debt relative to large caps and LESS access to the investment grade bond market. When the Fed/forward curve pivots from hawkish to looking through inflation with an eventual cut bias, the cost of capital for small caps falls more than it does for large caps. The Russell has historically outperformed in the 6 to 12 months following the last hike in a cycle. The caveat is that small caps also have MORE domestic revenue concentration, which means they benefit LESS from dollar weakness but are also hurt LESS by dollar strength than multinationals.
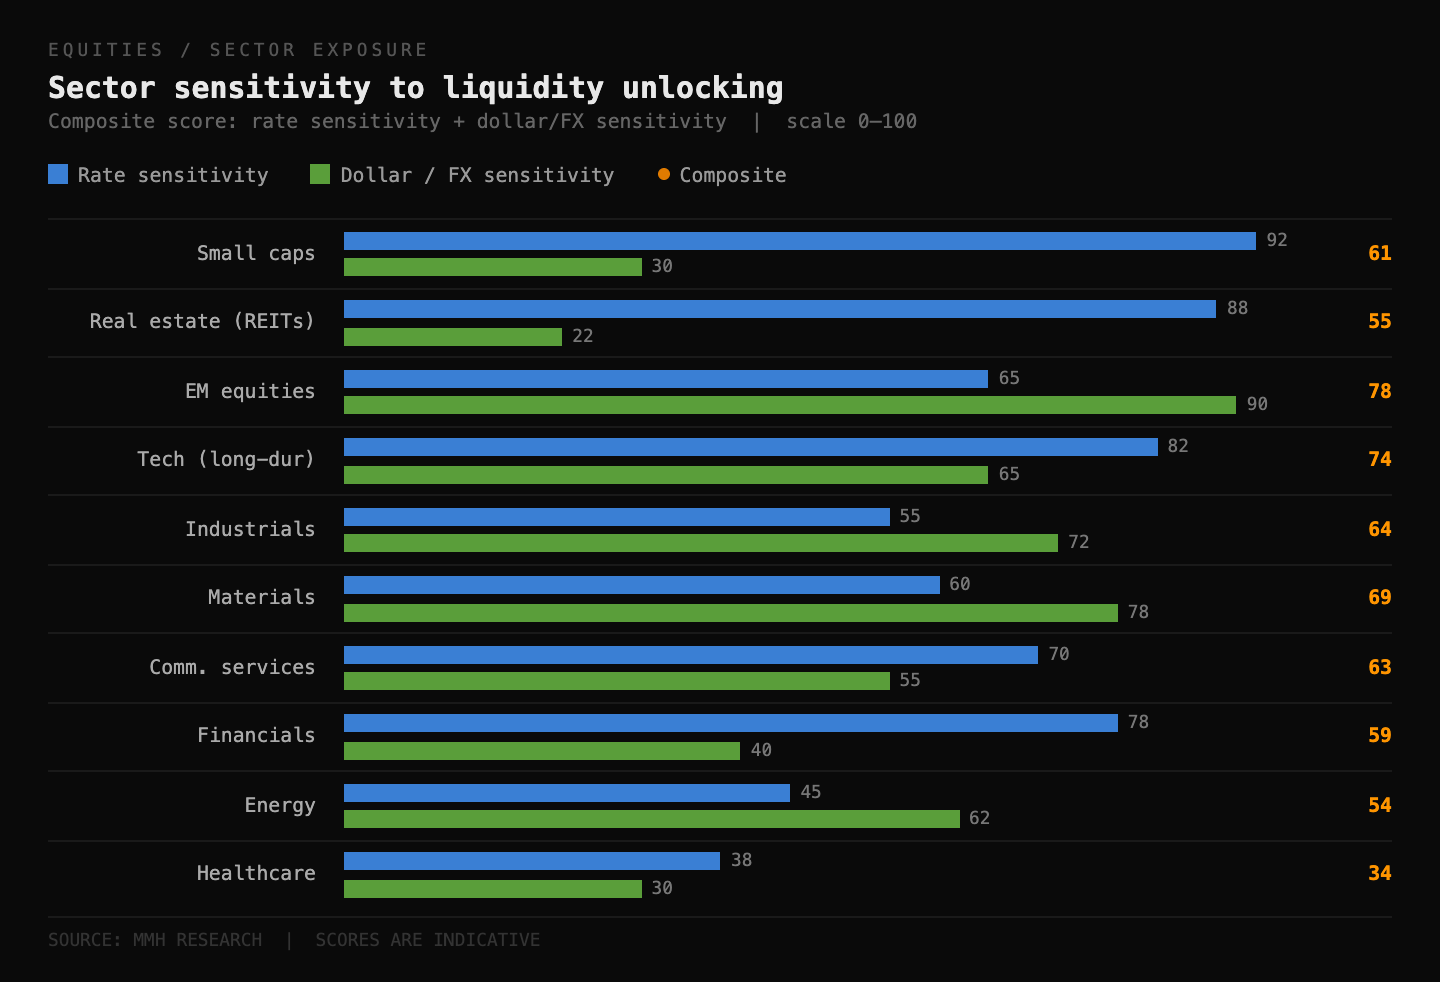
Tech (specifically the non-profitable and duration-sensitive end of the spectrum) is the sector that benefits most from lower real rates. Long-duration assets are the MOST leveraged to the discount rate. When real rates fall, the present value of earnings that are 5 or 10 years in the future rises disproportionately. That is exactly why the most speculative parts of the Nasdaq went up so much when rates were at zero and fell so hard when rates rose. The current view I have of real rates drifting lower as the Fed tolerates above target inflation is a positive setup for tech and you’d be best exposed to single names than the sector ETF in my view because some of these moves will be outsized.
I want to just make it clear that by no means am I the guy for EM, I have little edge there as I don’t have many models running on it nor do I spend much time on research there. But emerging markets are the big beneficiary of the dollar weakness that comes alongside this regime.
Portfolio flows into EM equity ETFs are almost ALWAYS associated with a weaker dollar. EM countries and companies often have dollar-denominated debt, so dollar weakness reduces the real burden of that debt. At the same time, EM central banks have more room to cut when the Fed is on hold or cutting because they do not need to maintain rate differentials to defend their currencies. Lower rates in EM, lower debt burdens, a weak dollar supporting commodity prices, and a risk-on environment from easy US financial conditions is a perfect setup for EM.
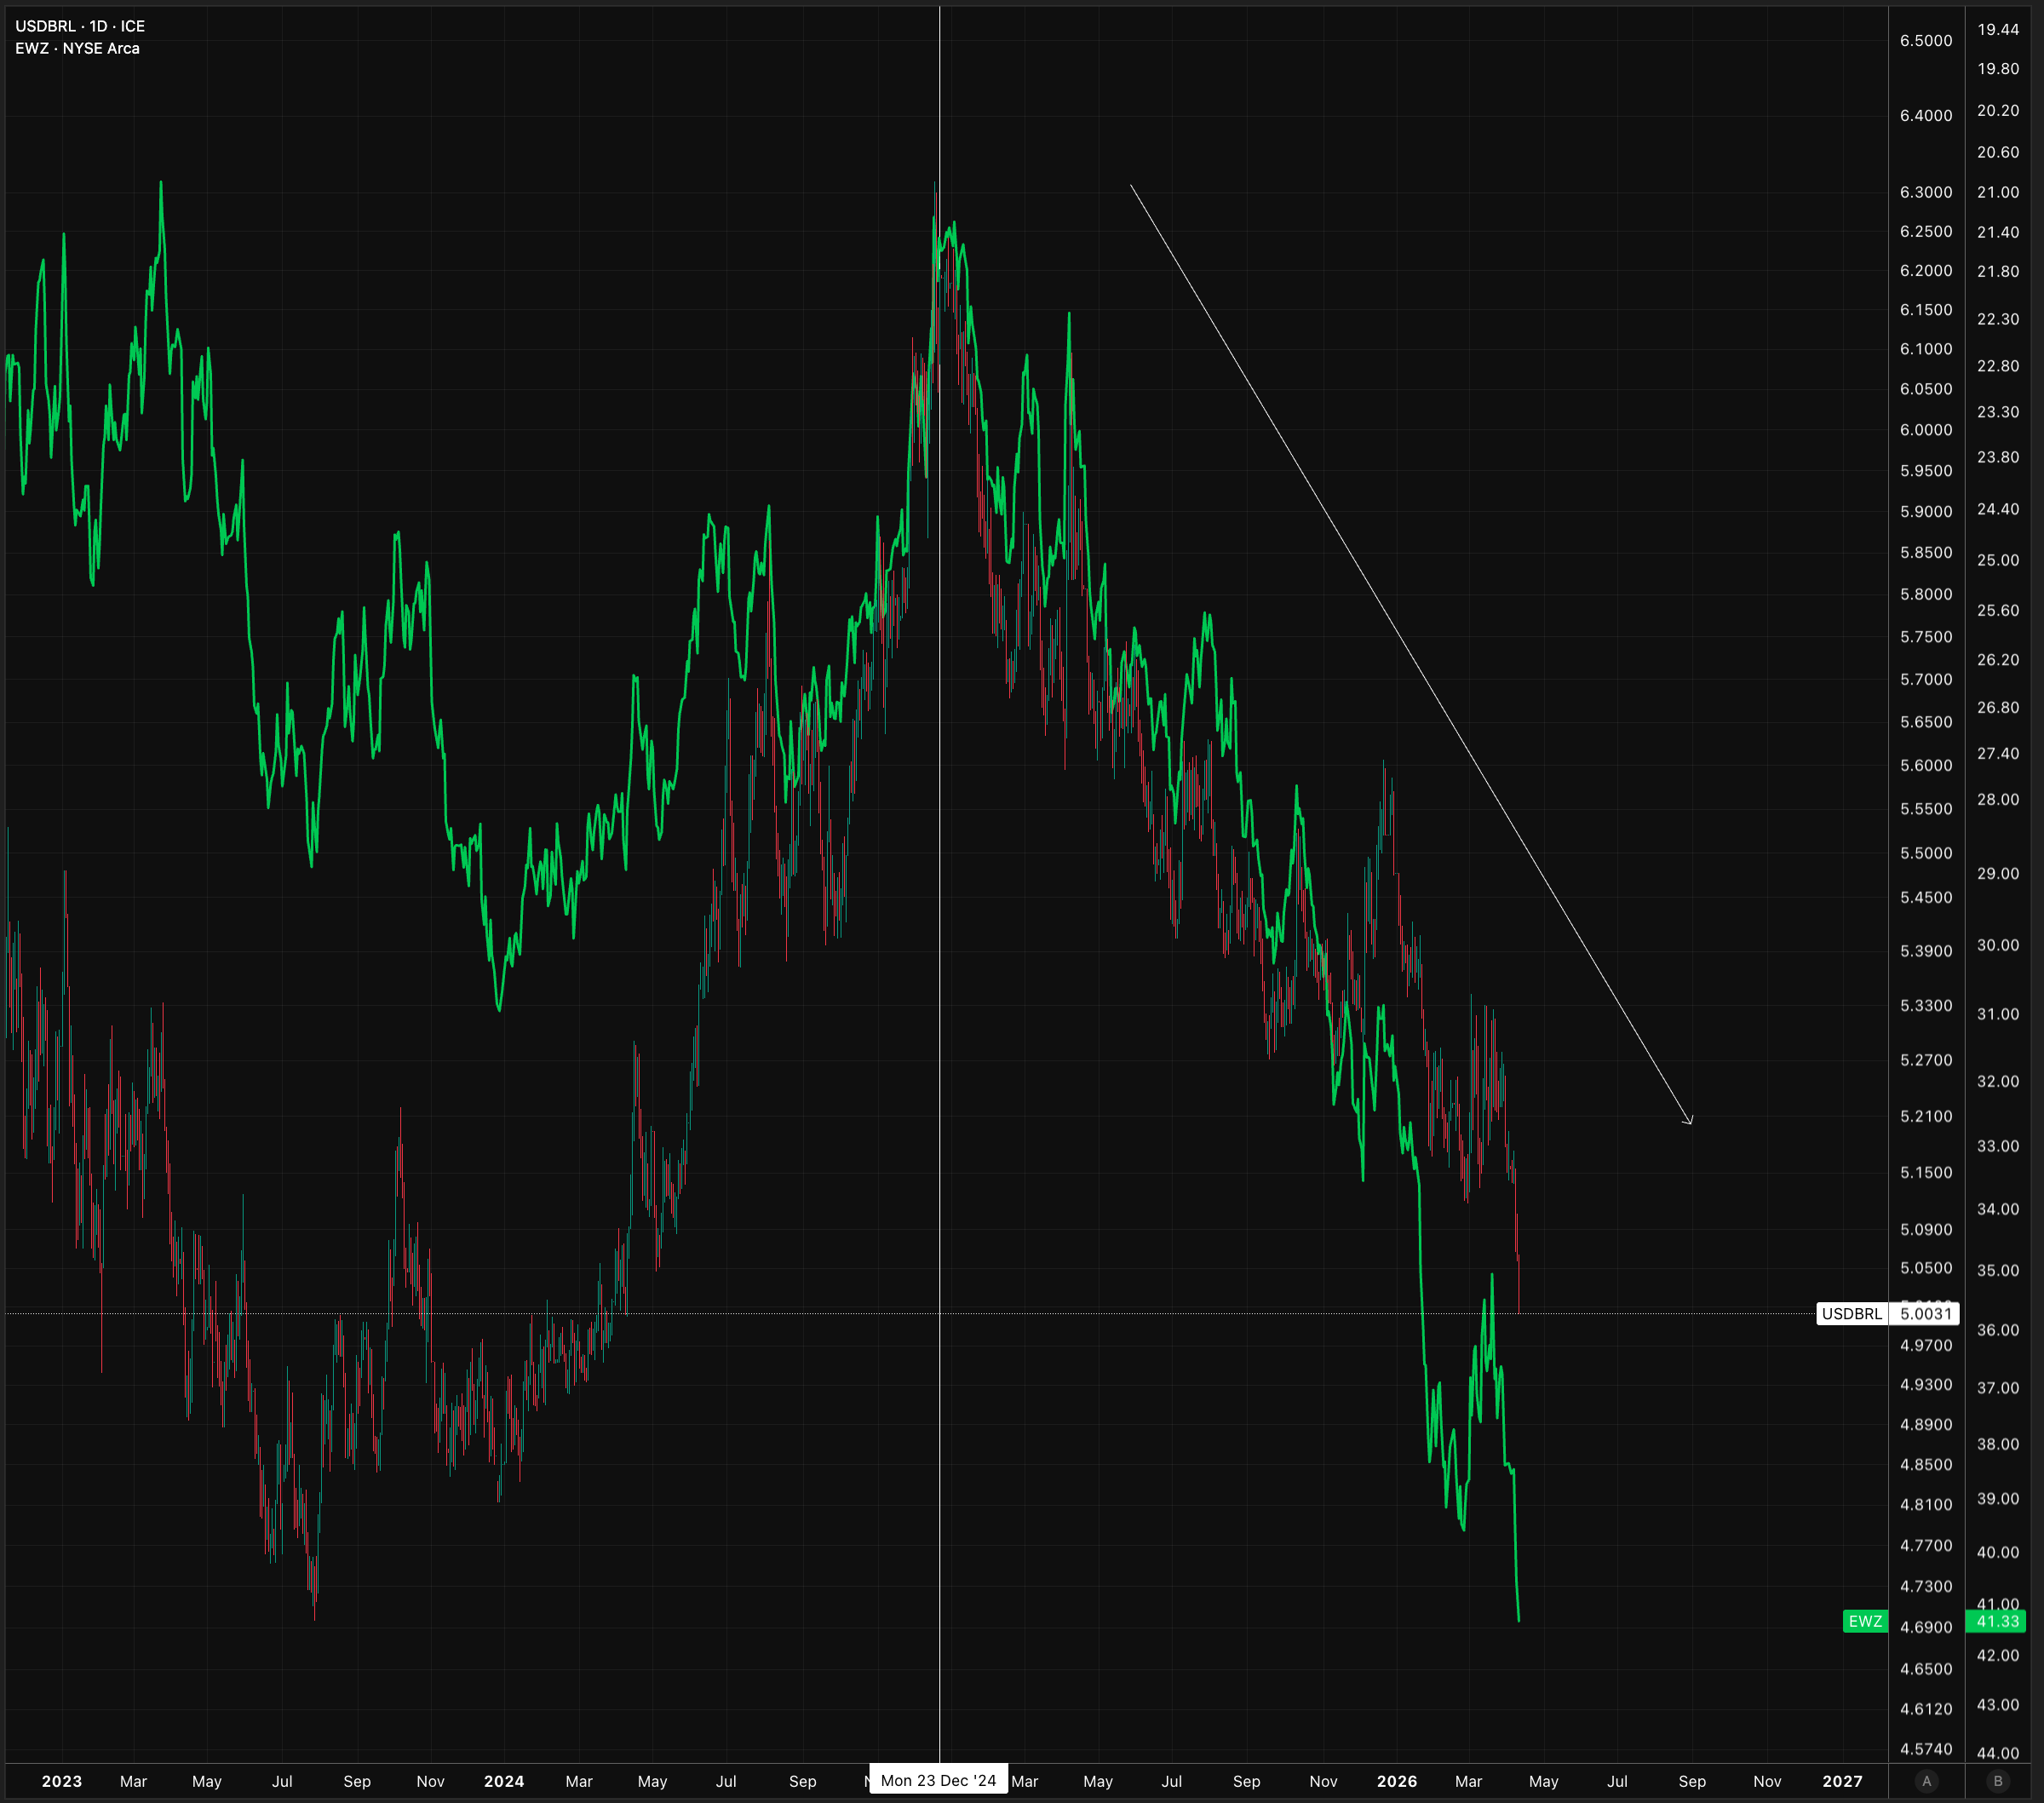
What’s interesting about EM is that their currency and equity market can often rally together because both are driven by the same thing (dollar weakness attracts capital inflows that simultaneously bid up local assets and local currencies).
I’ve inverted the scale here below, but the Brazilian real has been rallying with their domestic equity market:
The Downside
Now here is where this ALL goes wrong. The most dangerous scenario is the one where the Fed’s tolerance of above-target inflation is read by the market as a structural shift in the reaction function (policy error).
Right now, long-end inflation swaps are still anchored around 2% which suggests the market believes the Fed’s long-run commitment. But that anchoring is a belief, and beliefs can change quickly when data changes. If business-level inflation expectation starts to become entrenched, you get second-round effects that make the energy shock look LESS transitory than the Fed is modeling.
The second downside is what happens if the labour market breaks more than the Fed expects. The Fed is looking through inflation partly because they believe the labour market is just cooling rather dramatically cracking. Just look at how volatile jobs growth has been:
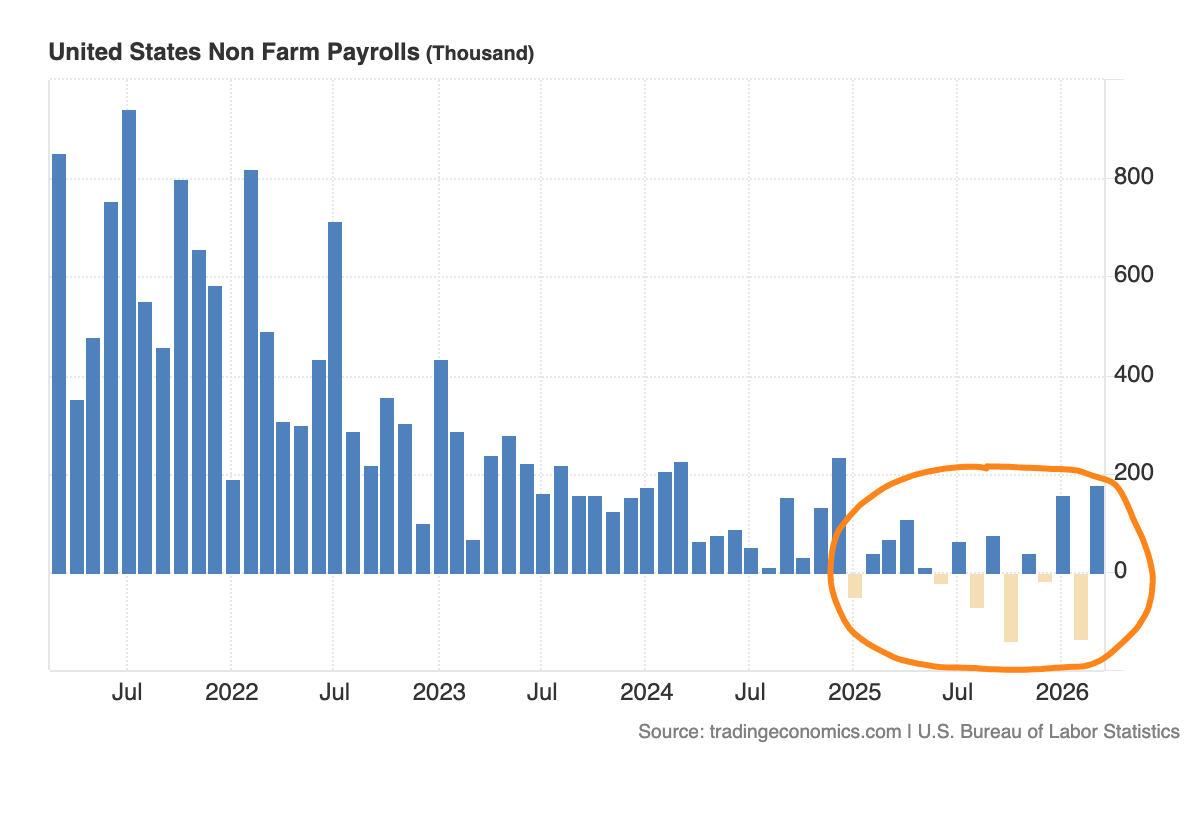
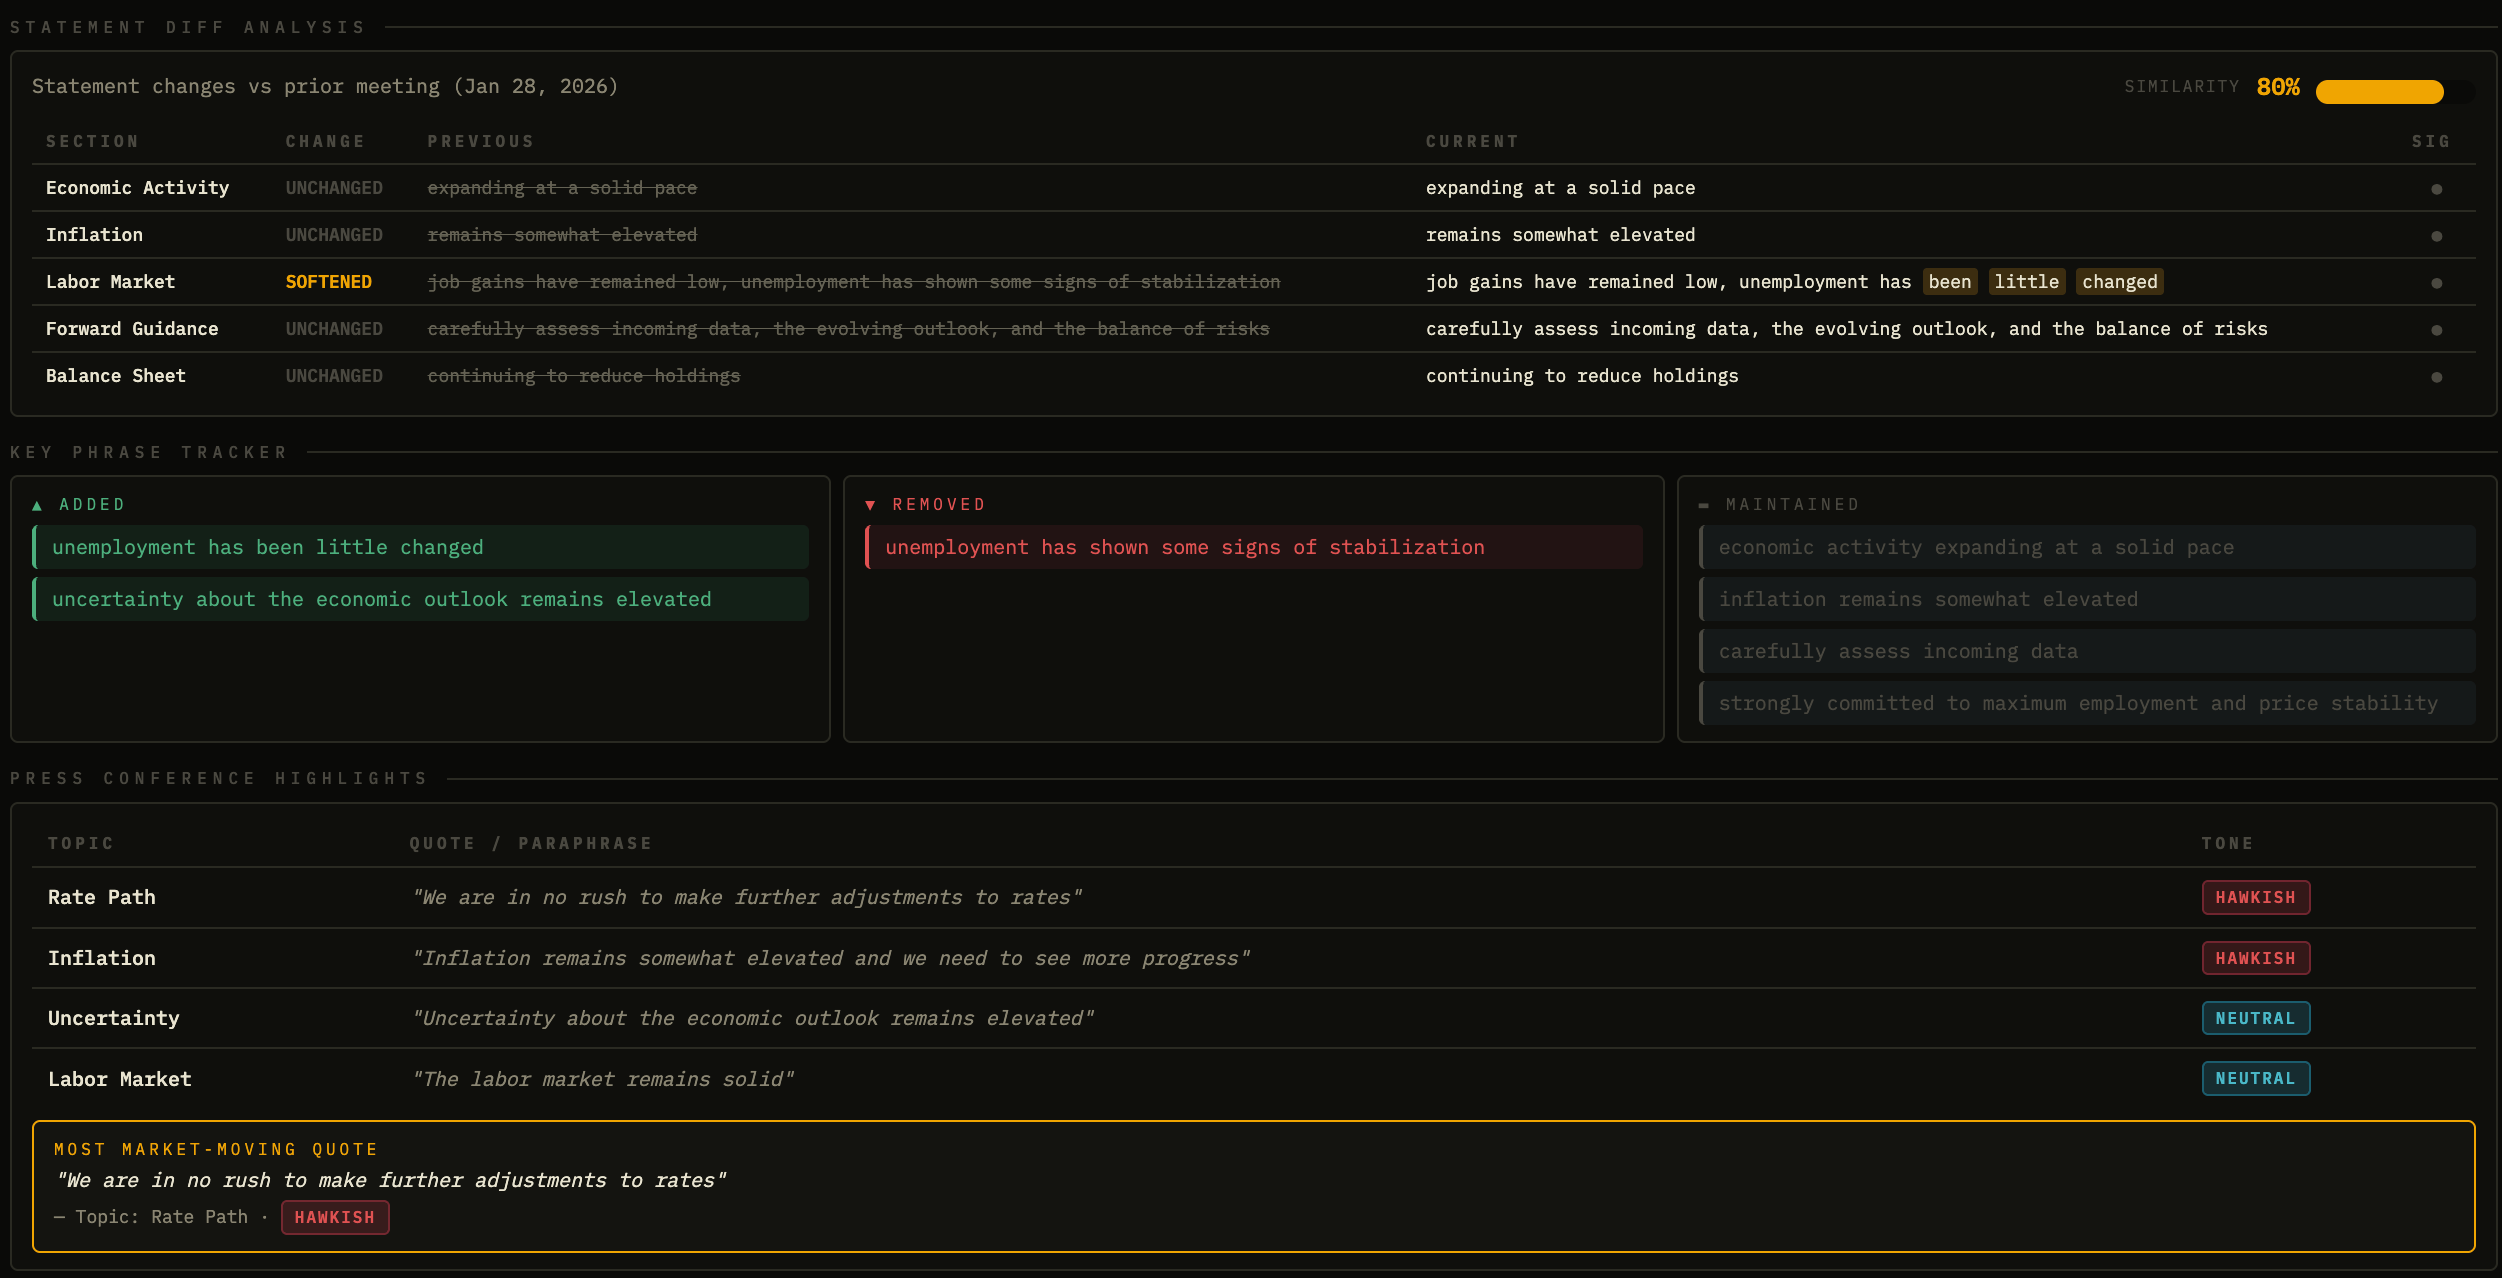
The Fed’s March statement pointed to reduced hiring rather than widespread layoffs as the dominant dynamic. If that characterisation is wrong and you get a genuine labour market deterioration, the Fed faces a stagflationary dilemma where cutting would add fuel to the inflation problem but not cutting would accelerate the labour market decline (1970s type analogue), but I really don’t believe we’re heading there. You can see how there has been a little more emphasis on the jobs data:
The third downside is positioning. If the consensus trade is long risk, long EM, short dollar, short rates vol, and that positioning is crowded, then any shock that forces a reversal of those positions becomes amplified beyond what the fundamental catalyst would usually warrant.
The backdrop of record high markets combined with rising underlying implied volatility has created a distorted risk profile where catalysts are likely to trigger larger than normal market movements. The size of the reversal from a crowded consensus unwind can be severe particularly if carry trades start to unwind.
Why Sustained Dollar Weakness Can Actually Hurt Equities
Firstly I’d say refer back to the first flow chart in this report. This is the part that most people miss and it is worth really thinking through carefully because cross-border flows matter so much.
There is a version of dollar weakness that is good for equities (which is why we often see inverse correlations between equities and the dollar). That is the version where the dollar weakens because global growth is accelerating, the rest of the world is growing faster than the US, and capital is rotating into higher return opportunities abroad. It’s basically the dollar decline that comes alongside a global risk-on environment. Multinationals get the earnings tailwind from translation, and EM gets the capital inflow and everyone wins.
The equity-negative version is where the dollar weakens because of concerns about US fiscal credibility, because foreign holders of US assets are reducing their exposure, or because the Fed’s willingness to let inflation run above target is eroding confidence in dollar-denominated assets as a store of value (this is the likely trigger in this scenario). In this version, you get a situation similar to 2022 in reverse, where a falling dollar is associated with falling US equity prices because both are symptoms of the same loss of confidence in US financial assets. There’s been much more positive stock-currency correlation across the last 5 years than there were in the previous 5 before that.
It’s not always obvious in real time which version of stock-currency correlation you are in (fiscal credibility or Fed behind the curve) but this is why it’s SO important to run rolling regressions and attributions so that you can see where flows of capital are going. The signal to watch is the relationship between stocks, bonds and the dollar rather than in pairs.
In the less worrying version, all three can do reasonably well because the driver is global growth optimism. In the toxic version, bonds sell off, the dollar sells off, and equities sell off together because the driver is a loss of confidence in US assets broadly. A significant widening of swap spreads (which is just where Treasuries trade higher in yield relative to SOFR rates) and sustained steepening of the 2s10s would be signals that the selling of bonds is becoming an issue beyond normal cyclical dynamics.
The more practical channel through which sustained dollar weakness hurts equities is through imported inflation. If the dollar fallsaggressively on a trade-weighted basis, it adds somewhere between 50 and 100bp (historical avg) to domestic inflation through import prices over a 12 to 18 month lag. For a Fed that is already tolerating above target inflation, that is a MASSIVE problem because it extends the period during which they cannot cut even if growth is slowing. You end up with a tighter for longer outcome by the back door even though the Fed never explicitly tightened. That slower growth, higher inflation, constrained Fed combination is NOT the environment that justifies the multiple expansion that equity bulls are counting on.
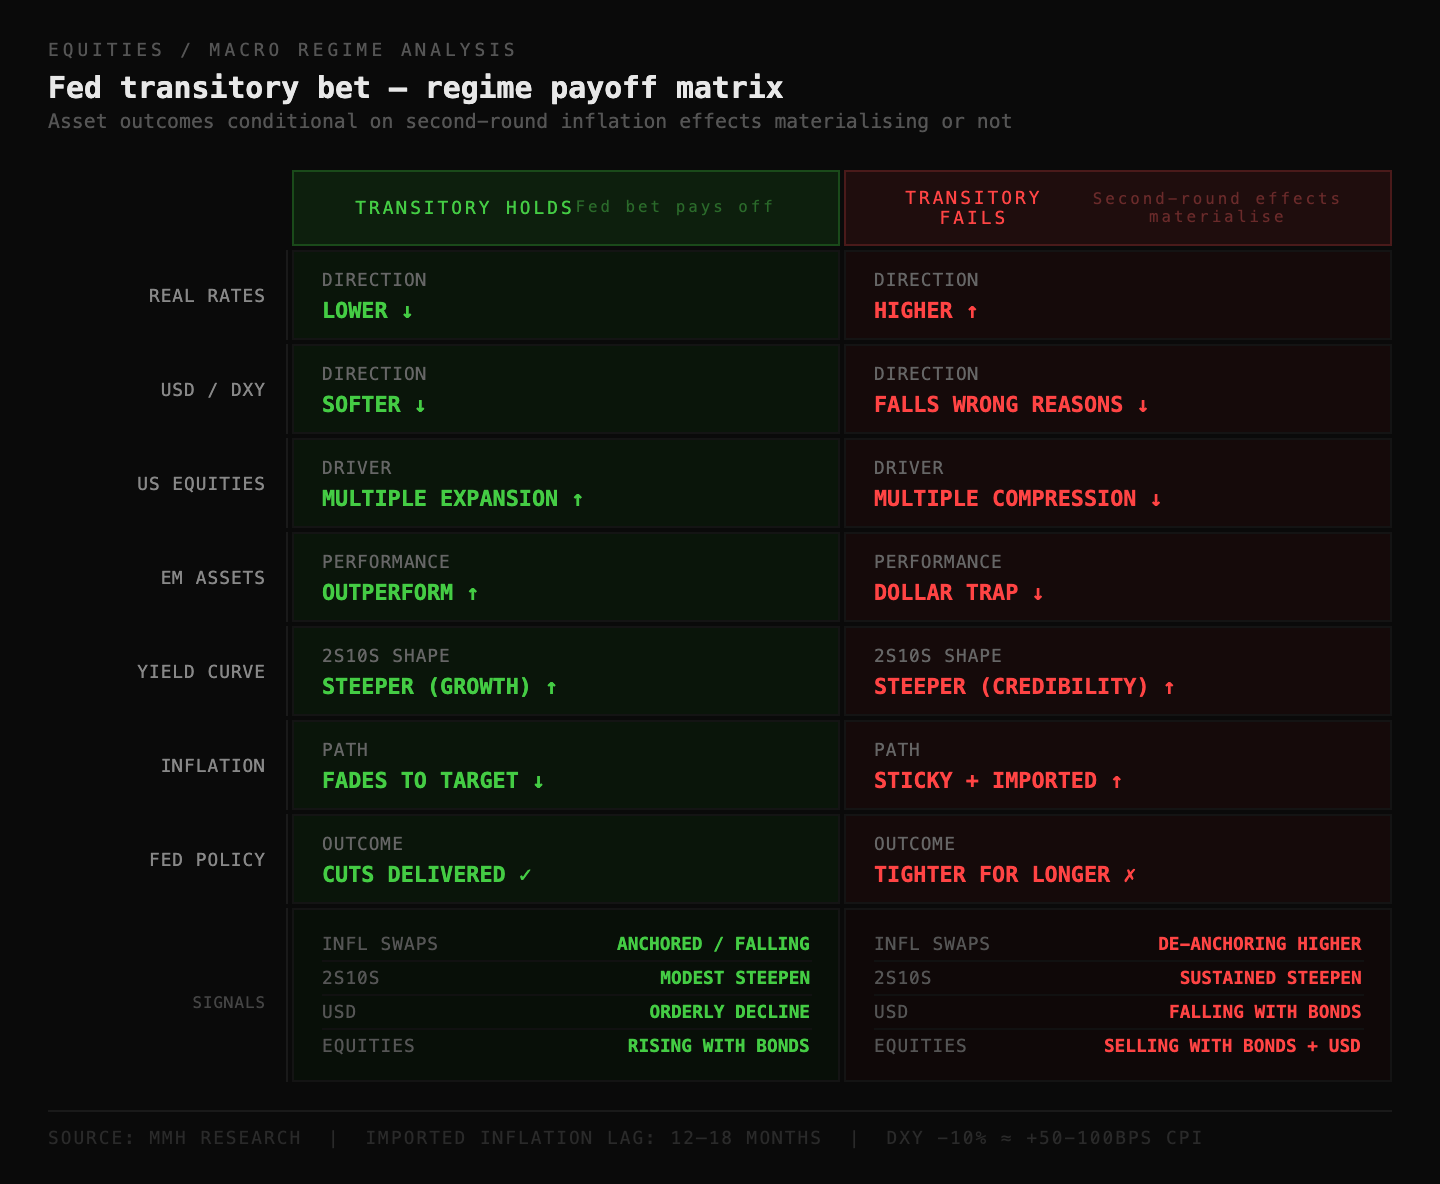
The bottom line across all of this is that the regime of the Fed tolerating above target inflation is fundamentally a bet that the transitory story is correct and that the second-round effects do not materialise. If that bet pays off, you get lower real rates, a softer dollar, higher risk asset valuations, strong EM performance, and a steeper curve that reflects growth optimism rather than credibility concerns.
If it DOESN’T pay off, you are in the scenario where the central bank falls behind the curve, loses credibility, faces a dollar that is falling for the wrong reasons, and an equity market that eventually reprices to reflect the reality that easy financial conditions were built on a foundation that turned out not to hold.
Thanks
Alfie