
Oil Up, Rates Down: Is the EM Carry Gone?
Key Indicators to Watch and Potential Challenges for Emerging Markets As Rate Cuts Persist

Hey guys,
Good Friday is tomorrow, so make sure you have one.
Lend me your attention, we’re headed straight in today.
We’re going to cover the following topics:
U.S Macro Update
Is the EM FX Carry Still Alive?
US Macro Update
In the U.S policymakers are at a standstill, last week we received the revived SEP (Summary of Economic Projections), which showed a modest increase in expectations for 2024’s GDP growth, +0.7% vs December’s GDP projections and +0.2% for PCE inflation.
There was one notable change in Jay’s opening statement on page 3 of the transcript: “unexpected weakening in the labor market could also warrant a policy response”. The Fed made it clear, that regardless of the hot CPI prints, ensuring they do not overdo the tightening process is front of mind.
Here’s what I’m looking at as a gauge of US financial and economic conditions:
1. Durable Goods Reading (Tuesday 26th March)
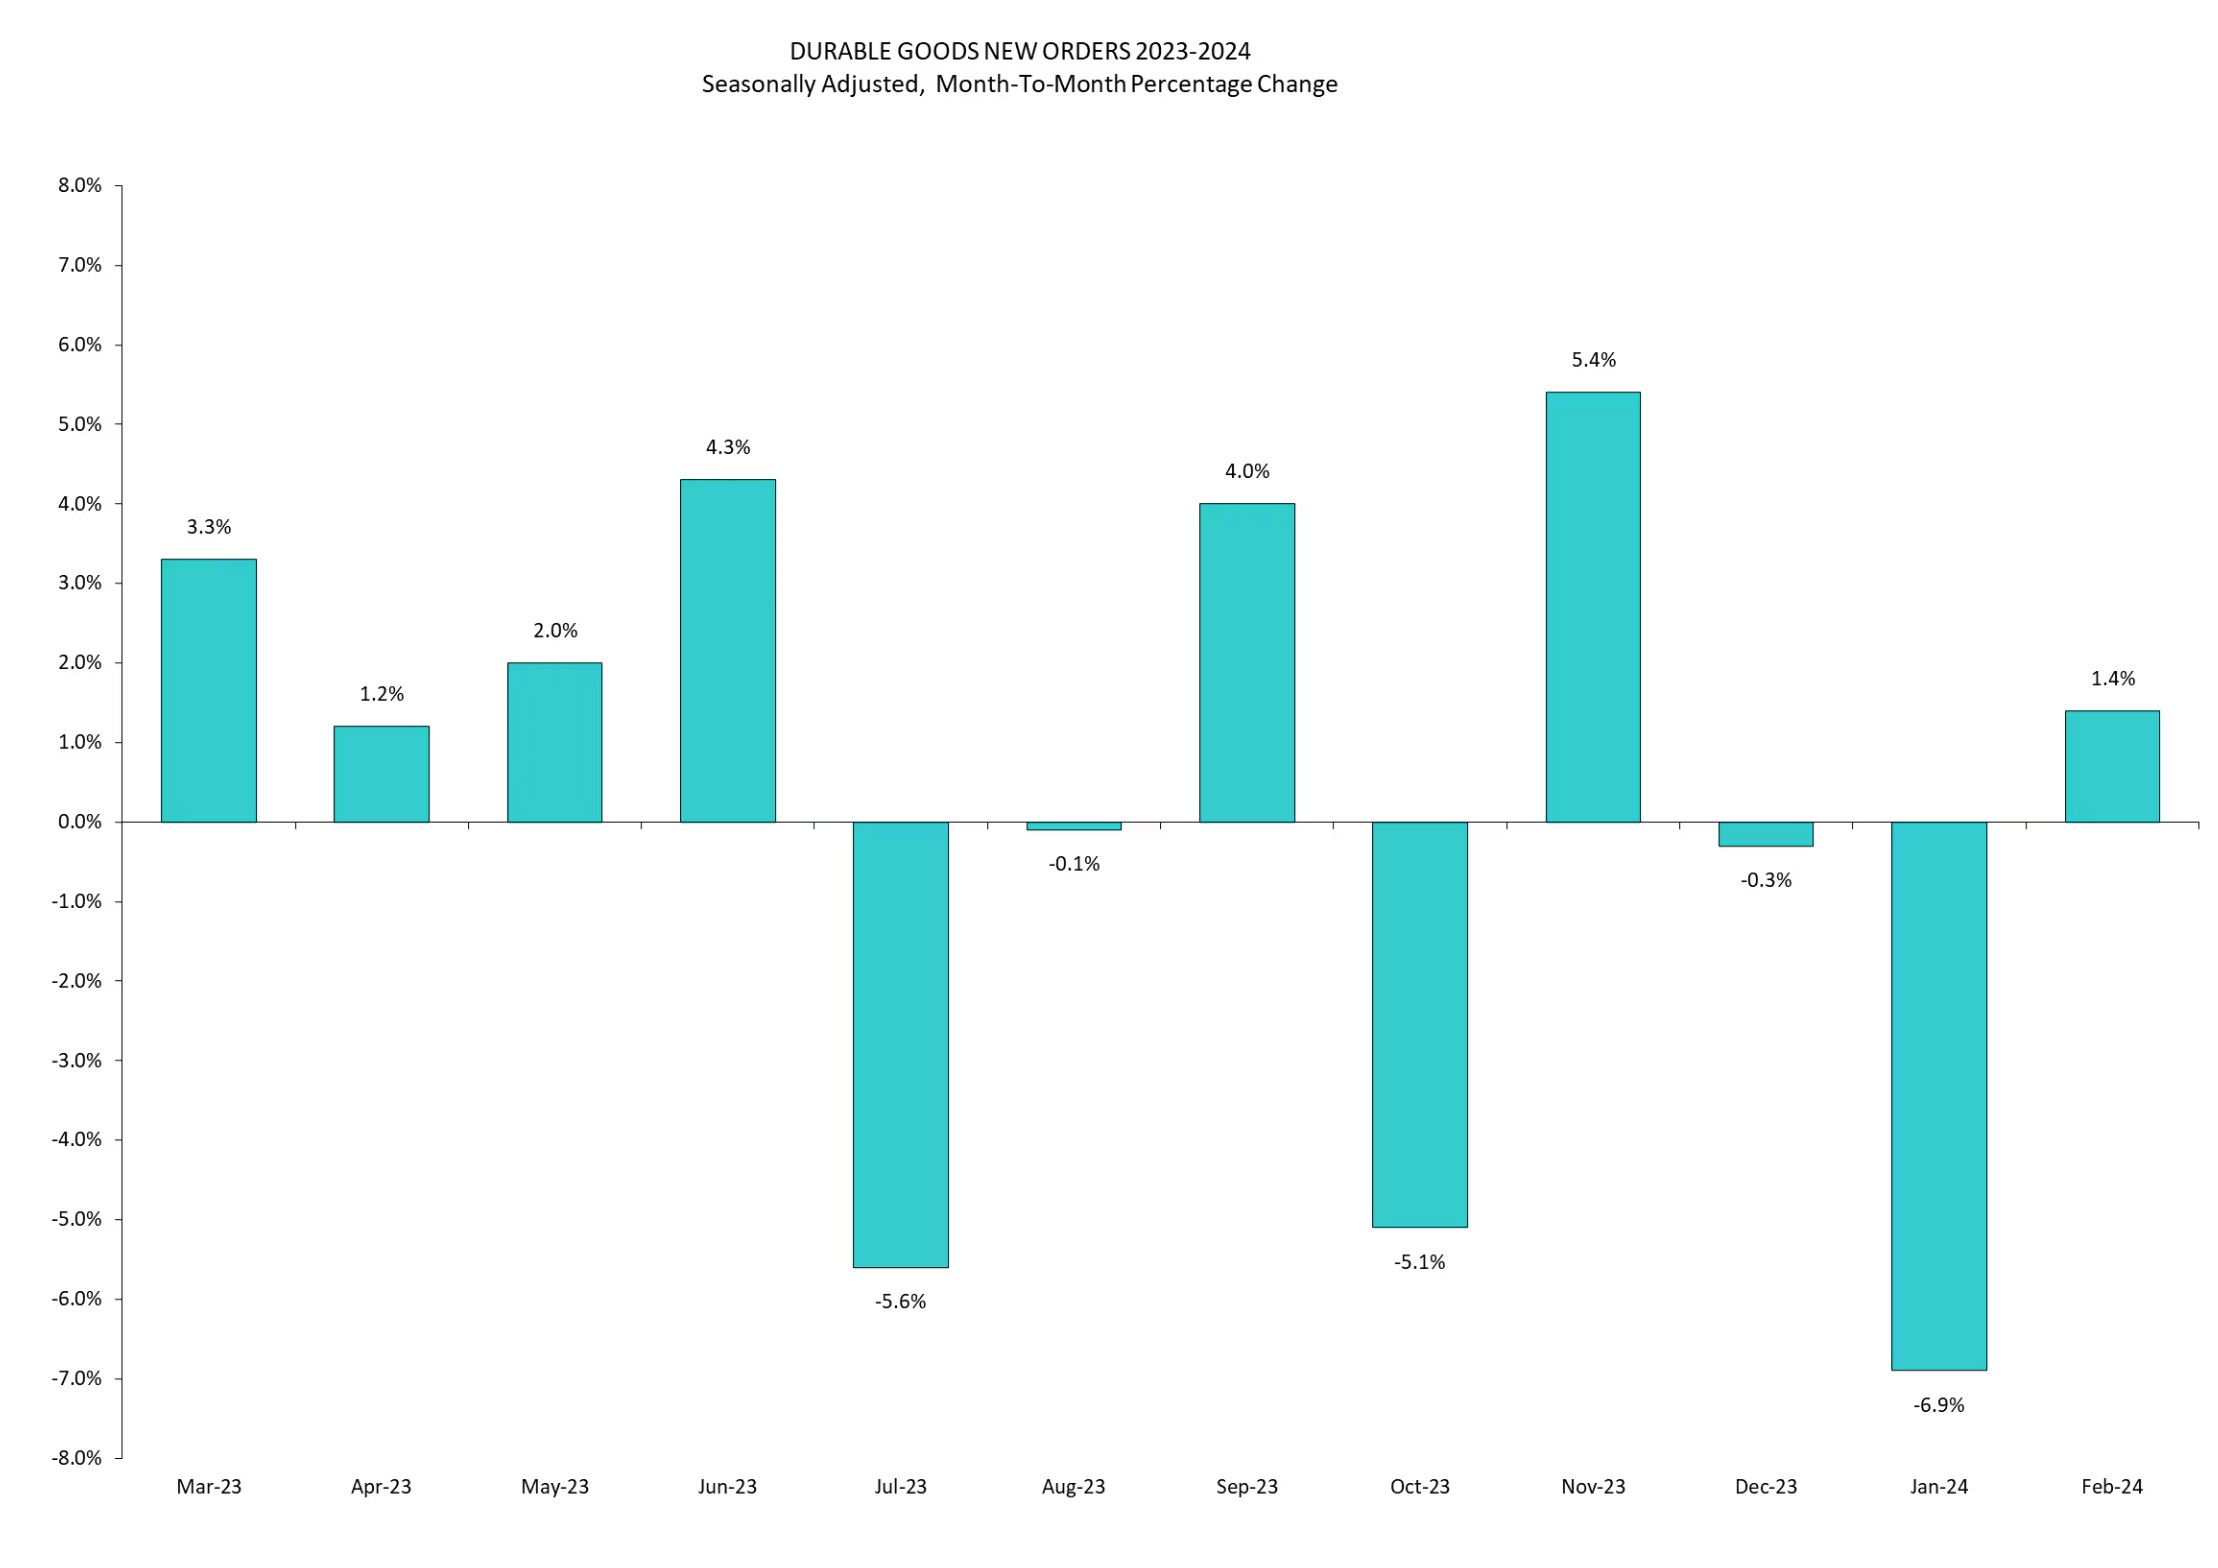
In February, new orders for durable goods recovered to 1.4% after January’s negative revision to 6.9%. As given in the name, durable goods are items like cars, refrigerators, machinery equipment etc, that have a lifespan of more than three years.
Durable goods are an important economic indicator for a few simple reasons:
Signals future demand: Durable goods like cars appliances and machinery are typically expensive; so when there is an uptick in new orders for these goods it’s an indication of consumer sentiment and business confidence.
Strength in durable goods orders signifies more than just consumer confidence; it's a positive indicator of domestic manufacturing health. Take the example of increased car demand. This translates to higher orders for car manufacturers, who in turn need to purchase more parts like steering wheels. This ripples through the supply chain, forcing upstream suppliers and producers to ramp up production to meet this demand.
2. Weekly Gasoline Prices
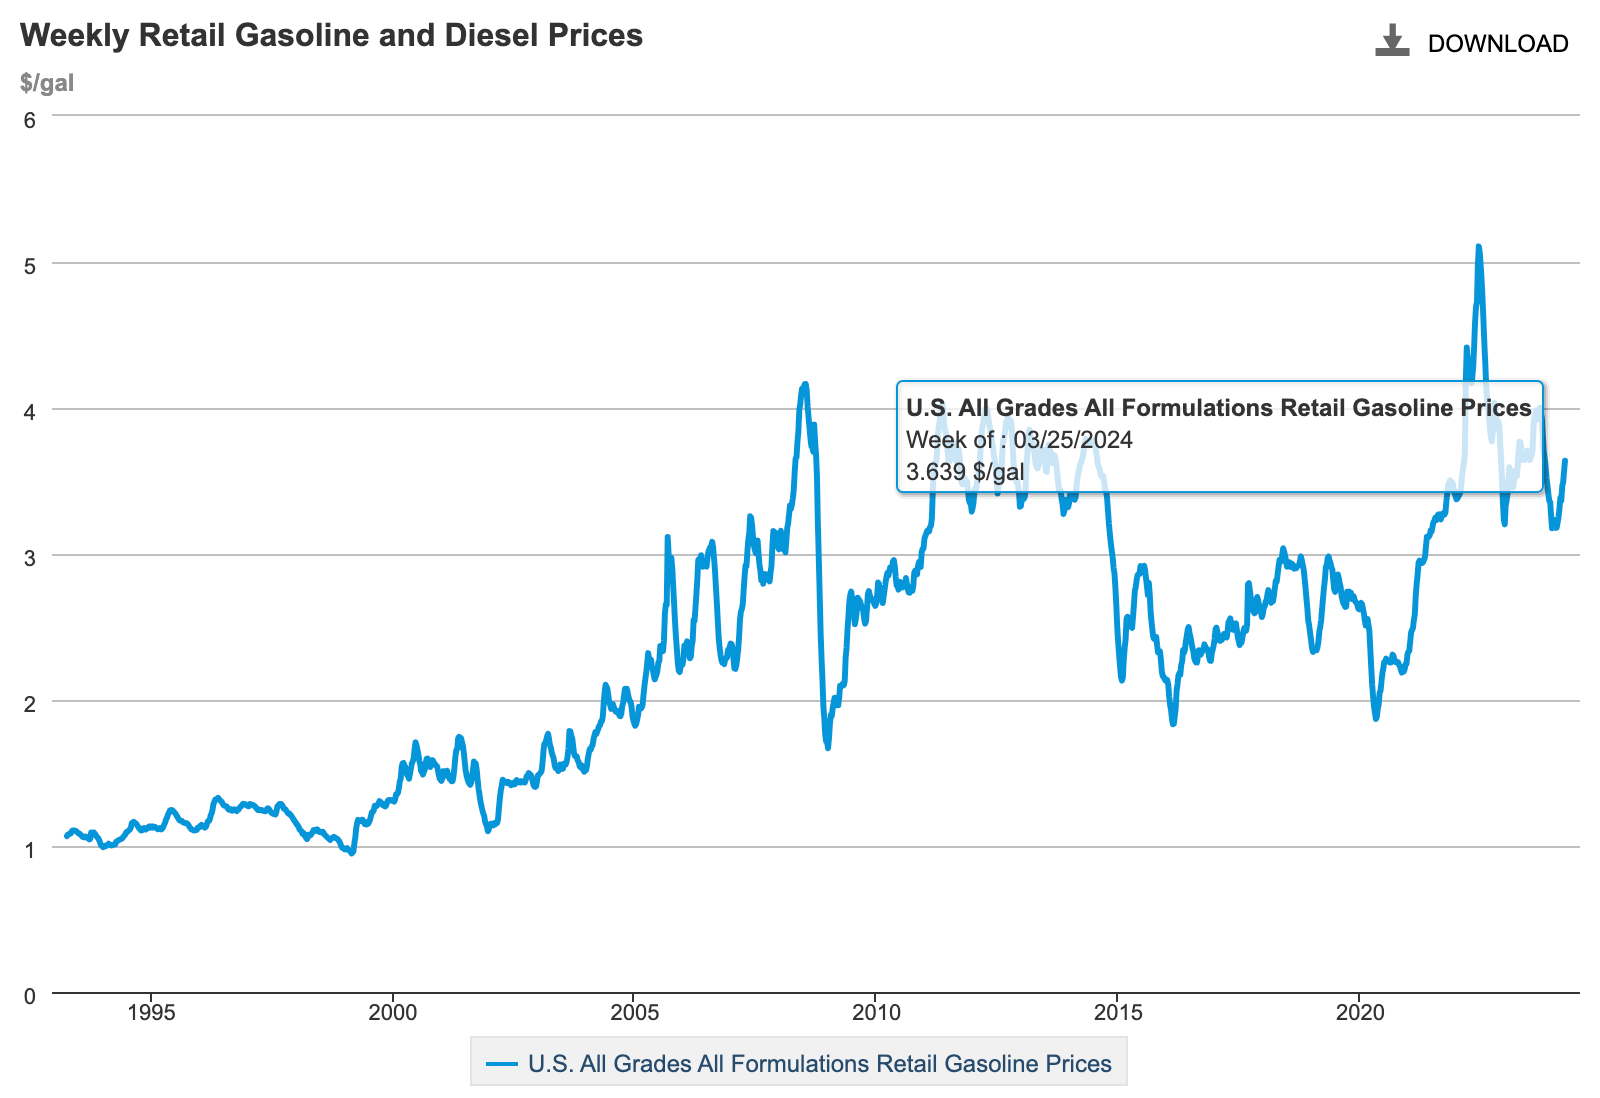
As expected, along with the rise in Crude prices, gasoline prices have rebounded since bottoming out in December 2023. Several factors, ranging from underlying demand increasing for Crude to the IEA’s energy outlook upgrade. To further add, airstrikes on Russian refineries by Ukraine and refineries entering maintenance season have all contributed to prices on Brent & WTI being up 17% and 14% respectively.
As it stands oil fundamentals remain bullish, which isn’t good for the Fed or for the Biden administration, so it’ll be important to watch ongoing developments through to the summer.
For those who don’t know, during maintenance season refineries shut down parts of their operations, or even entire facilities, to perform necessary repairs and upgrades. This reduces their ability to convert crude oil into gasoline, diesel, and other refined products.
To understand gasoline prices it’s important to understand what exactly goes into its price.
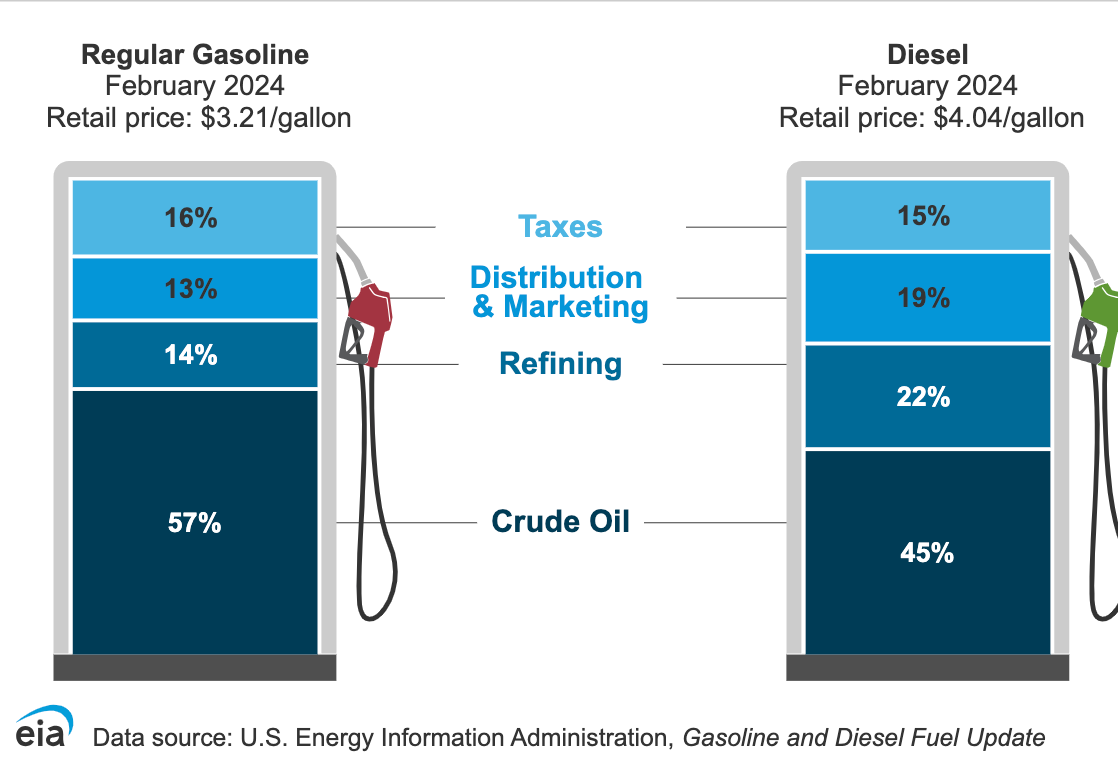
The main components of the retail price of gasoline:
The cost of crude oil 45% - 57%
Refining costs and profits 14% - 22%
Distribution and marketing 13% - 19%
Taxes 15% - 16%
So, for gasoline prices close to 60% of its price is due to crude oil, so when we have a 15%, or 20% rally in crude prices it’s simply a consequence that we’ll see a 10%+ move in gasoline prices.
3. Financial Markets
Rates, Spreads & Yields
Yields falling, spreads tightening and yield curve steepning…
The story of fixed income as the Fed embark on the cutting cycle.
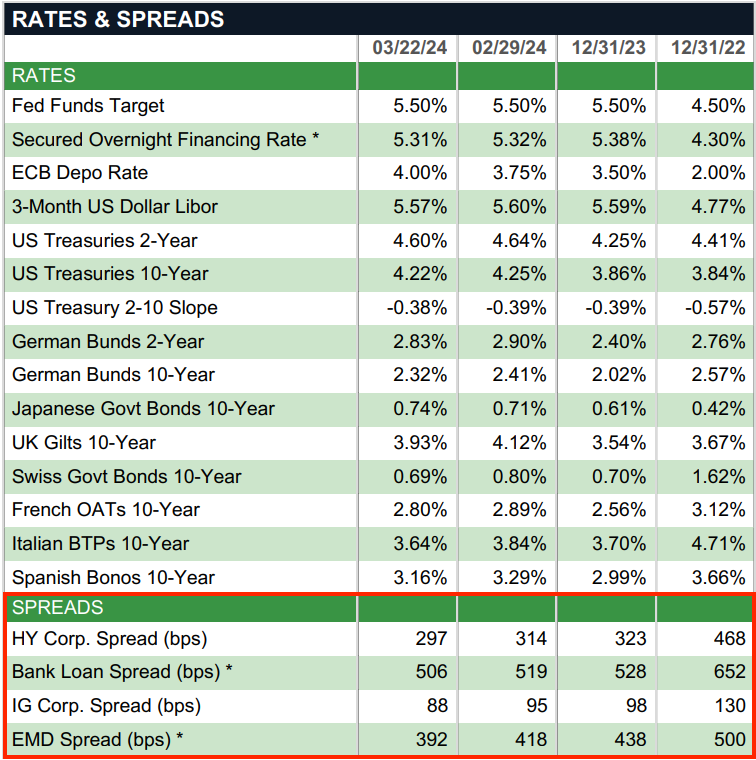
Yields on the 2-year have eased ever so slightly, the 2-year now sitting at 4.60% with the 10-year at 4.18% respectively. As we near the Fed cut we can expect to see the 2s/10s curve finally return to positive territory, out of the inversion, which should insight a withdrawal of capital out of money market funds with short-end rates dropping.
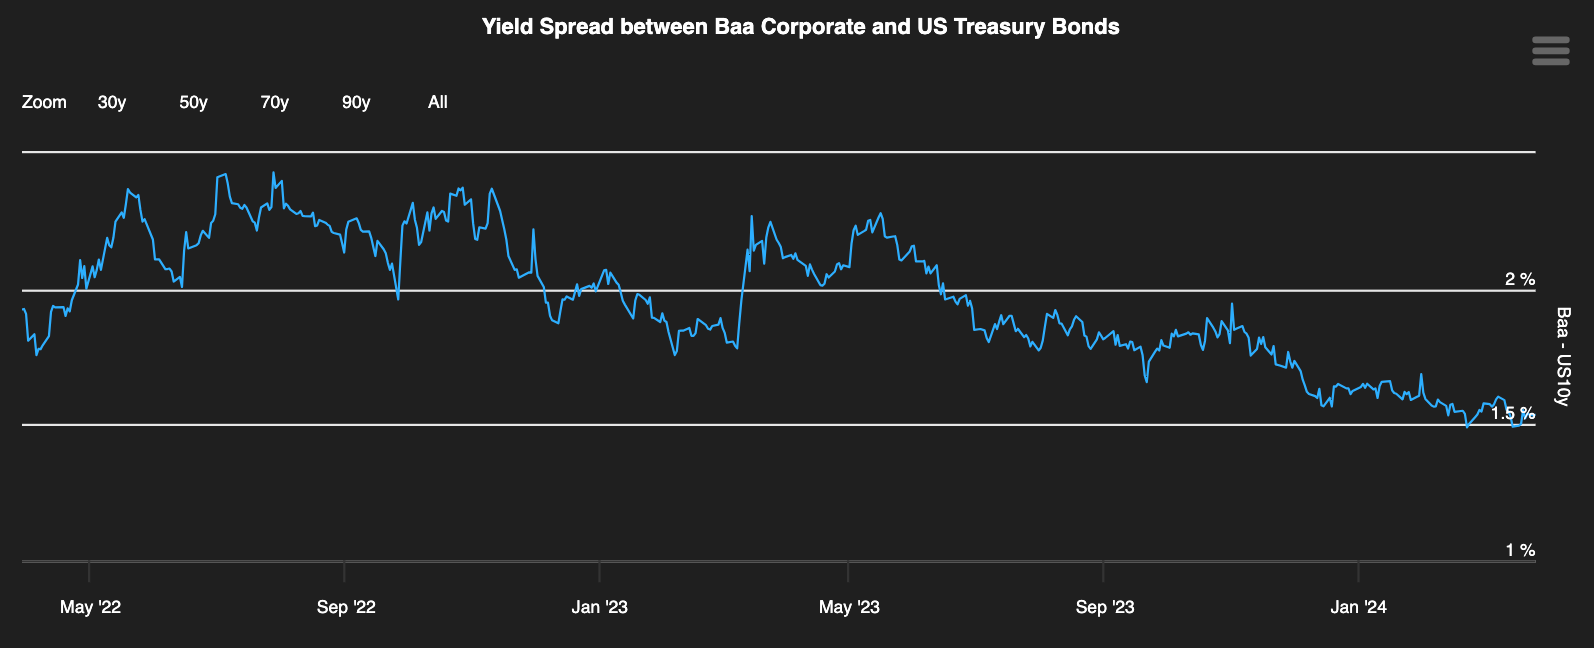
Yield spreads are an important factor when considering financial conditions, the availability of credit and the cost of accessing credit tell us a lot about where we are both in the credit and business cycle. The underlying factor that dictates the yield spread between HY (High Yield) Corp, IG Corp and EMD (Emerging Market Debt) is credit risk. Since Nov ‘22 IG (Investment Grade) spreads have been narrowing, as seen in Figure 5, but it’s important to understand why.
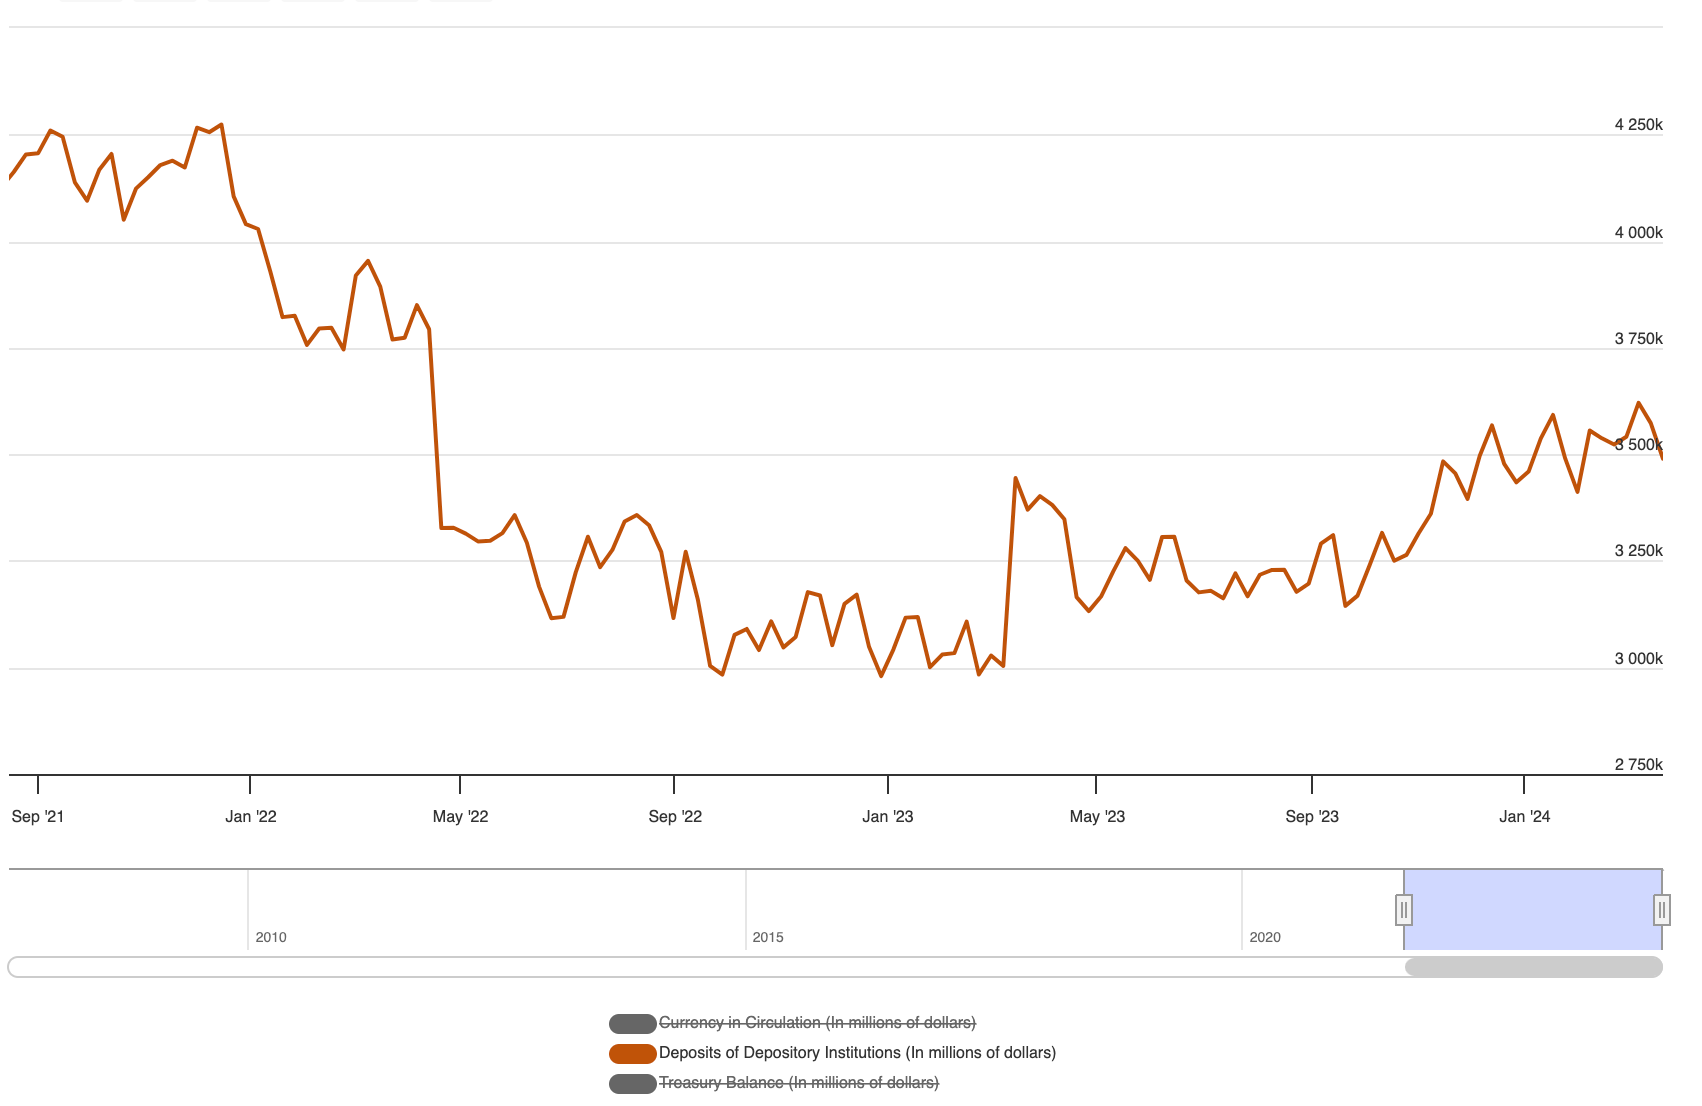
Figure 6 shows the Fed’s balance sheet liabilities. As a rule of thumb, on a bank’s balance sheet, they have assets (treasuries, gold etc) and they have liabilities (customer bank deposits). The same applies to the Federal Reserve, the difference is, that customer bank deposits become commercial bank deposits.
So a simple equation to help understand is this:
Fed liabilities = Bank deposits (reserves) = Liquidity
It’s important to know that banks use reserves solely to transact with each other, purchase bonds and fund repo transactions, these reserves never enter the real economy.
So, during QT, the Fed will sell/allow bond holdings to mature, draining the reserves (liquidity) within the financial system which would therefore increase the credit risk of borrowers and the yield spread between fixed-income securities and risk-free US treasuries.
As it stands, the Fed is set to cut rates by June/July, however, with the onset of strong data from the economy, the activation energy for the Fed to cut rates is becoming greater as said by Michael Kao. US GDP for Q4 was revised higher to 3.4% vs 3.2% previously stated. Yields fell after the release but have since recovered with the 2-year still yielding 4.600% with the 10-year 40bps lower.
EM FX Carry
I always enjoy analysing the interconnectedness of monetary policy, particularly U.S monetary policy and its ripple effects on the RoW, namely EM.
My love for EM was developed whilst working within an EM sovereign debt research house, since then I’ve always had my eye on EM, particularly FX & FI. During the most recent Fed hiking cycle, it should come as no surprise that EM central banks, particularly those in the LatAm region hiked fiercely ahead of the Federal Reserve. Past episodes of monetary policy tightening cycles led by the Fed, illustrate how EM currencies & debt suffered. The oil crisis of 1973-74 where oil prices rose from $3 p/b to $12 p/b, a 300% increase, and 1979 where prices doubled EM suffered as a result of the Fed hiking aggressively to tame inflation.
Dollar-denominated bonds represent c.18% of the total EM bond universe, meaning, that when the US dollar is strong as seen in 2022 servicing debt becomes increasingly difficult because of the dollar’s strength vs EM currencies.
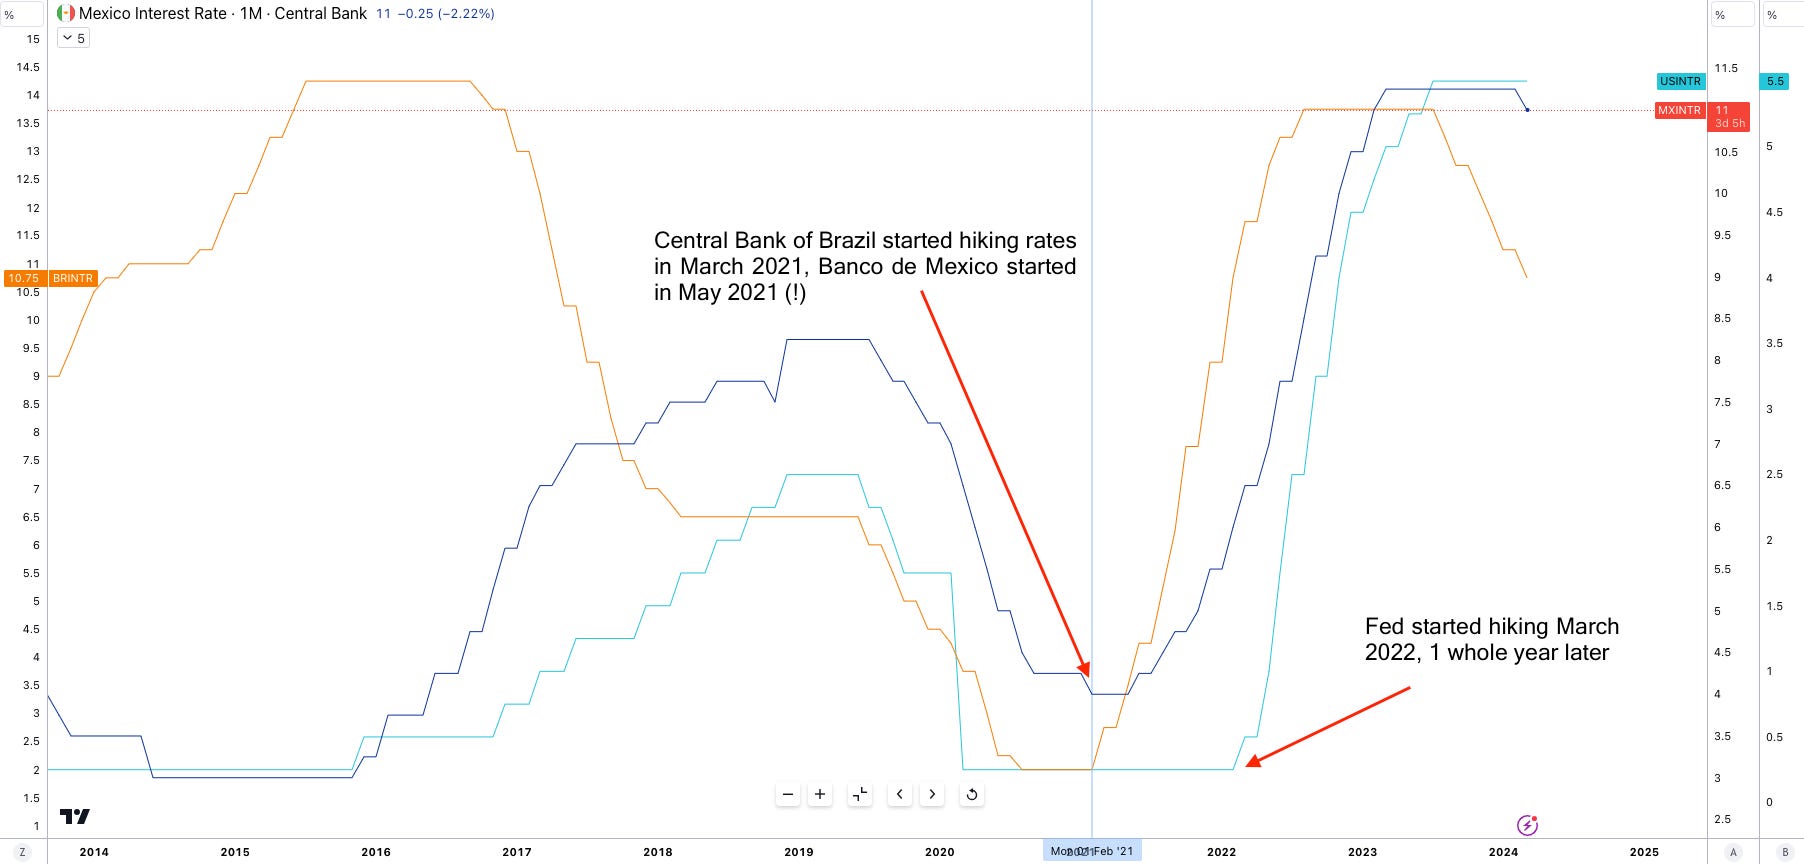
Many EM central banks, particularly in Latin America (LatAm), started raising interest rates 9-13 months before the Federal Reserve. This "frontrunning" strategy aims to insulate their currencies from capital flow volatility that can disrupt both fiscal and monetary policy goals.
The positive side to frontrunning the Fed is the opportunities this creates, particularly, in the carry trade. With some EM countries like Turkey holding rates at 45% it’s no-brainer to capitalise on the opportunity. Of course, inflation is the one factor one must consider to justify the profitability of a carry trade.
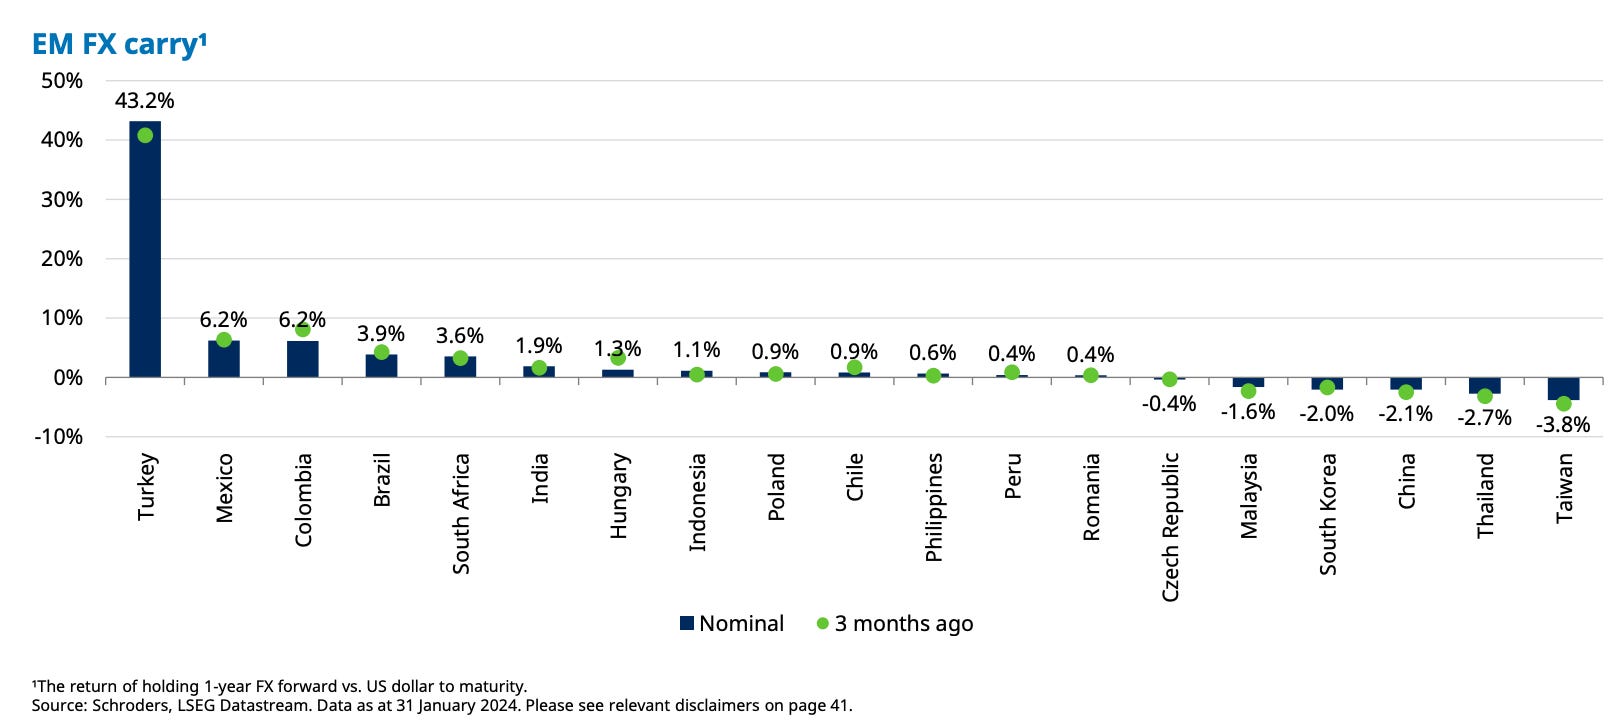
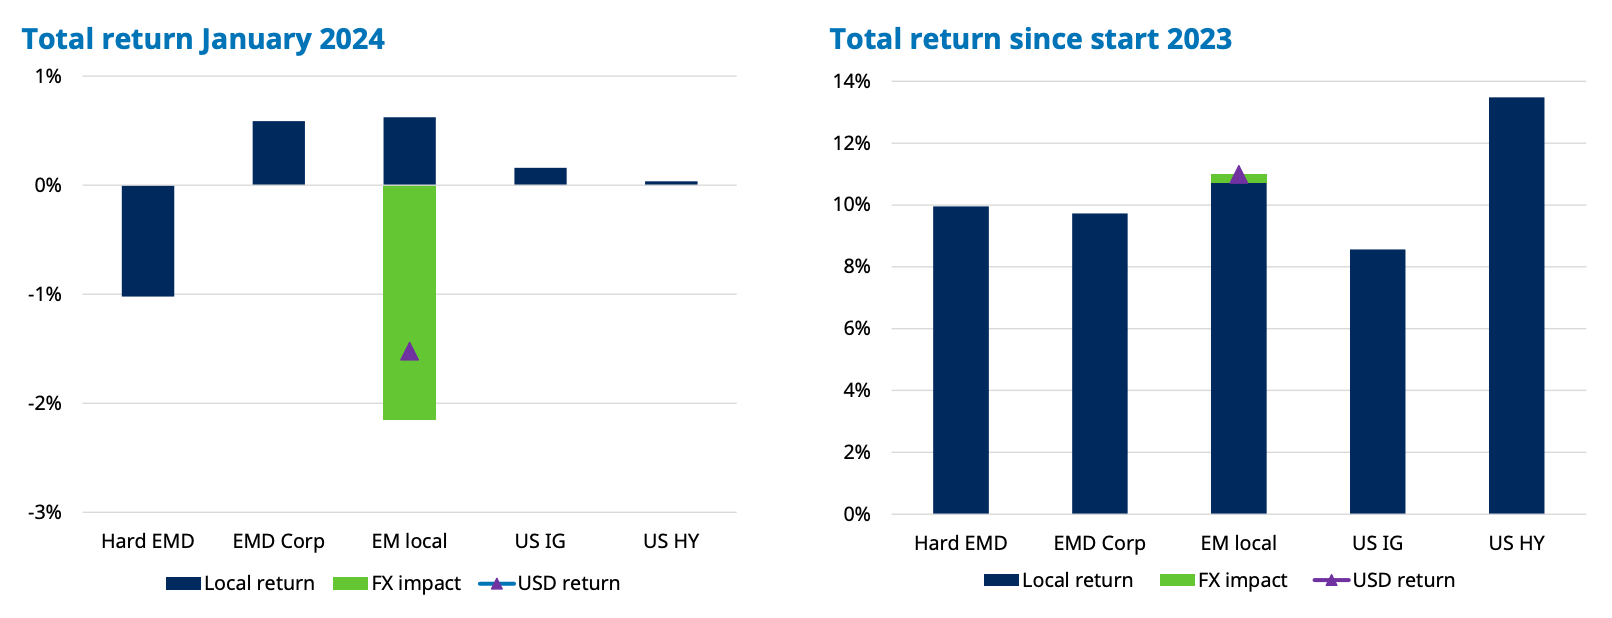
EM Carry Trade Loses Steam After Stellar 2022 (Figure 9)
While the EM carry trade enjoyed a banner year in 2022, its returns have begun to fade (Figure 9). This reversal coincides with the initiation of interest rate-cutting cycles by several EM central banks. As these central banks lower rates, the yield advantage that previously fueled the carry trade's profitability diminishes.
Next week I look to explore further trade ideas and opportunities on the horizon. As always, thank you for your readership.
nice read Joe, with EM countries front running hike prompting EM FX Carry trade and TCMB holding rates at such high level why wasn't that yield differential evident in the TRYUSD