
Yields, Yields, Yields...
Reviewing transmission of monetary policy into the world of fixed income.

Hey guys,
The only thing that’s been on everyone’s lips is the crazy move in yields.
So why not explain the transmission of monetary policy into the bond market.
So let’s dive in.
What Are Bonds Saying?
Last week I broke down the bear flattener in the US yield curve and why such moves tend to happen. To summarize, a bear flattener is when short-term bond yields rise faster than long-term bond yields, causing the front end of the curve to rally faster than the long end.
Now unless you’ve had your head underneath a rock the past 7 days, the surge in Treasury yields has taken headlines with a huge rally in the long end. This move and change in the US yield curve are showing traits of a bear steepener which as you can imagine, is when long-term interest rates rise faster than short-term interest rates. This move in the yield curve is associated with higher inflation and or tighter central bank monetary policy.
Following on from the press conference and release of the SEP material we can decipher which of the two is causing this rally in long-term yields. Whether it is anticipation of higher inflation, tighter monetary policy or both.
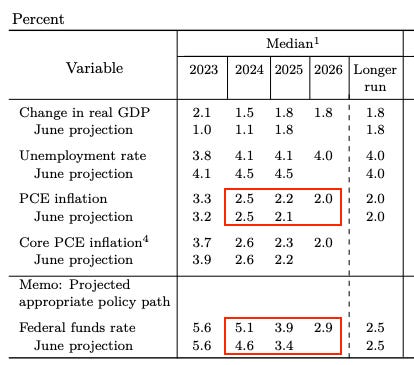
From 2024, PCE is projected to decline 50bps through 2026, with a slight increase for the year 2025. Core PCE also is expected to follow suit and settle around the 2.0% mark by 2026; so we can cancel out higher inflation expectations as the cause for this rally in the long end.
That leaves interest rates. Compared to the June SEP projections, a 50bps rate cut has been removed from the rate path in 2025. So it’s pretty clear that the long end of the yield curve is reacting to this 50bps rate cut removal.
Some of you may ask, ‘Why is the long end of the curve reacting like this? What about the short end?
Let me explain.
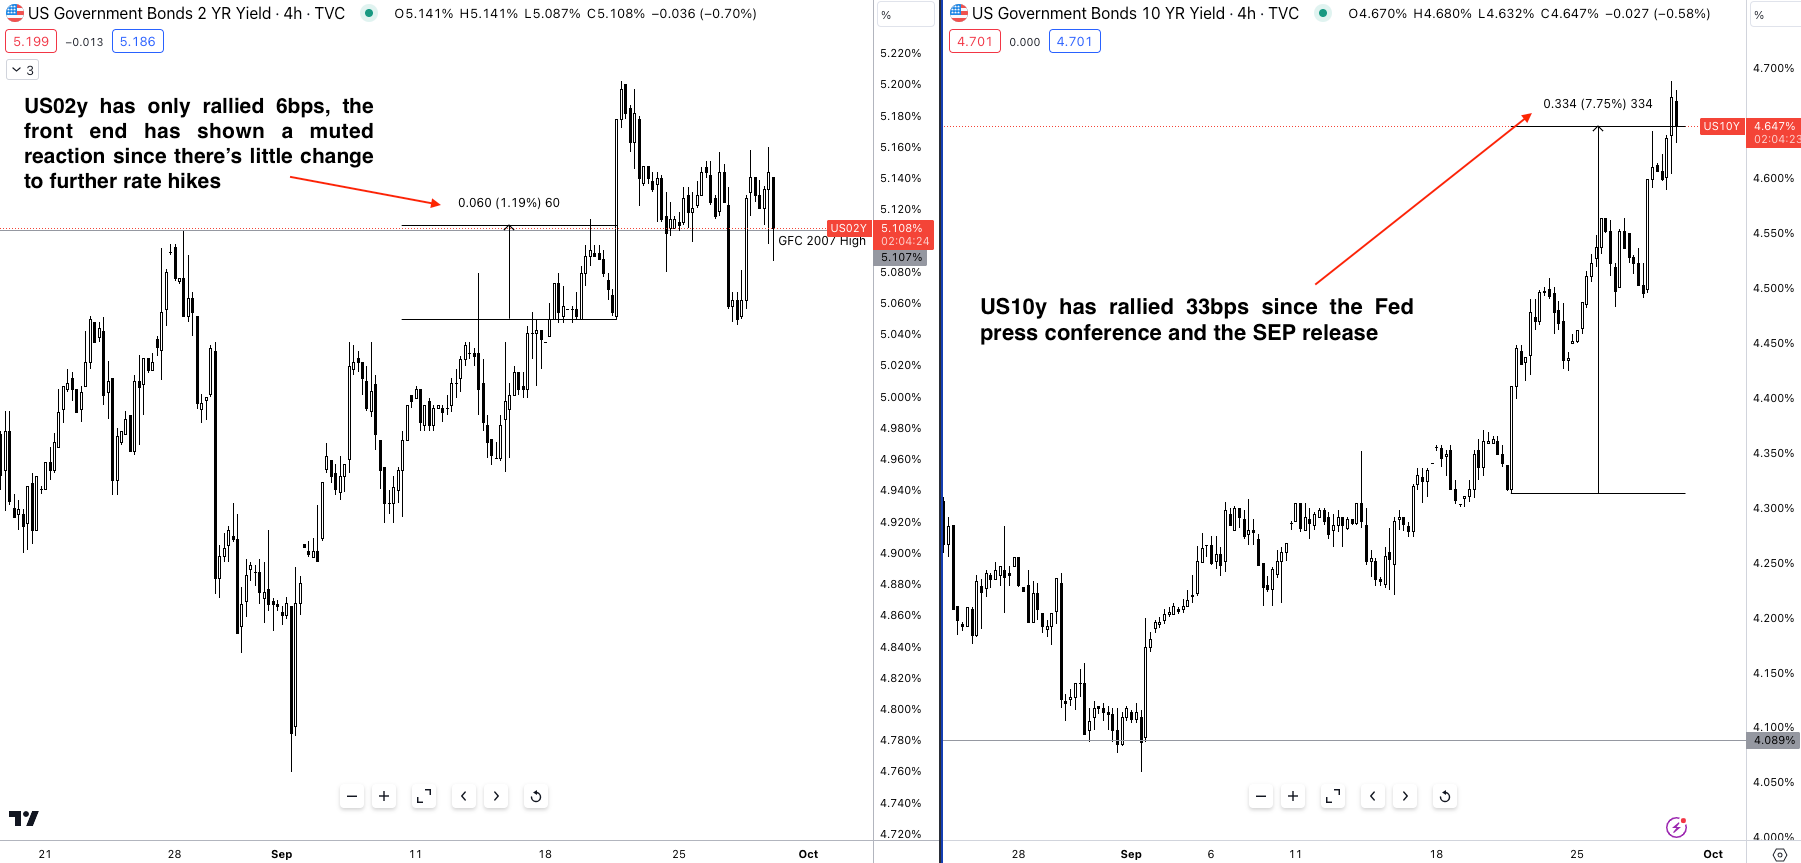
The chart above shows that the 10-year yield has rallied 33 bps since the press conference and SEP release, while the 2-year yield has shifted 6 bps higher. Further, down the curve, the reaction is greater for bonds with higher duration, with the 20-year and 30-year yields both increasing by 40 bps since September 20.
Here’s a visual look at the shift in yields for all maturities.
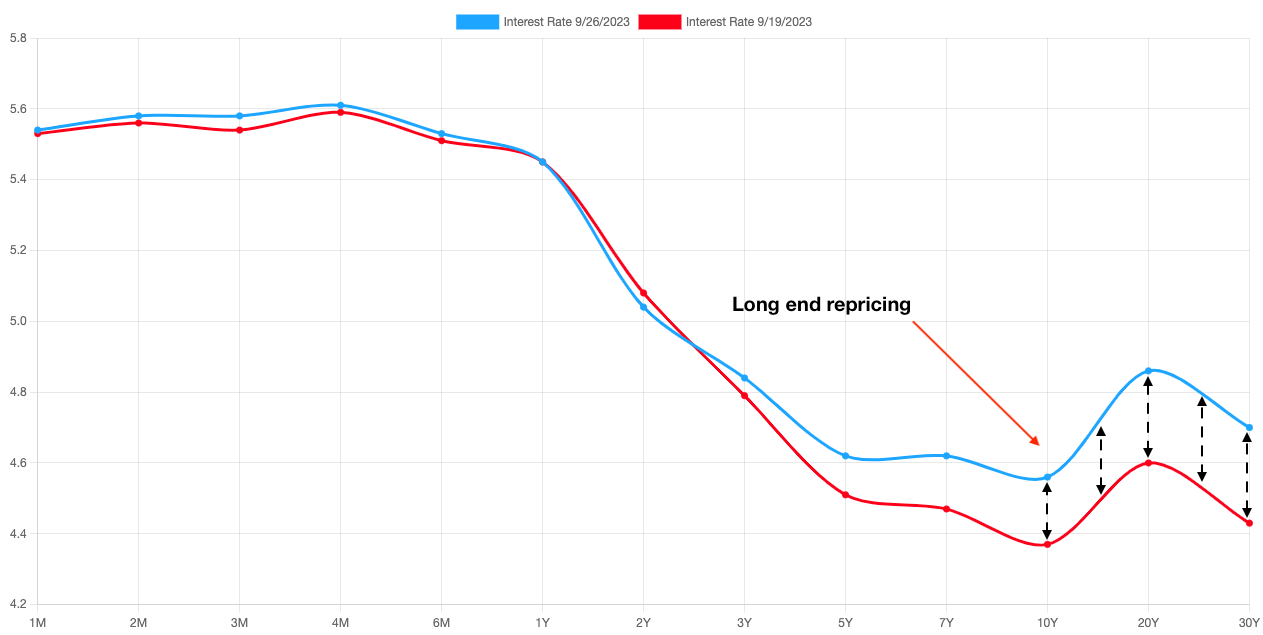
Long-end bonds are more reactive to the "higher for longer" mantra because of their higher duration. This means that a small change in interest rates has a larger impact on the value of a long-end bond than on a short-end bond. For example, a 50 basis point change in interest rates can have a multiplier effect on the value of a 20-year bond, which can be a cause for concern for some investors.
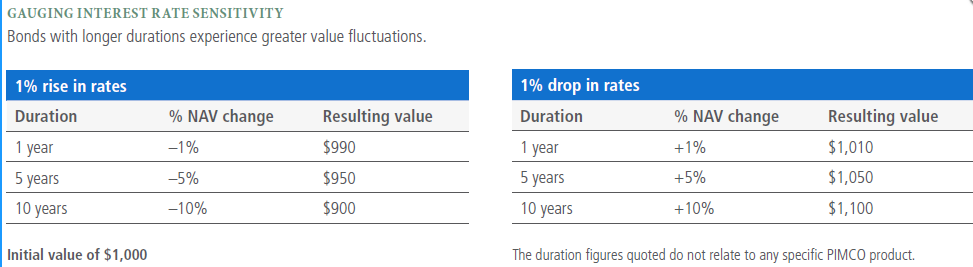
As the example shows, a 1% rise in rates has little effect on the 1-year bond due to its lower duration risk. However, when you hold a 10-year bond, the same 1% increase in rates can cause the value of that bond to trade well below its face value.
This is exactly what happened to SVB and a number of banks that were caught holding bonds that were underwater due to their long duration and the 500 bps rise in rates, which put downward pressure on bond prices.
To add to the fire, a voting member of the FOMC, Neel Kashkari, the president of the Federal Reserve Bank of Minneapolis stated that he was open to the possibility of more than one additional rate hike. Essentially frontloading the short end of the curve.
Such a move in the bond market forces one to take a look at bond vol within Treasuries.
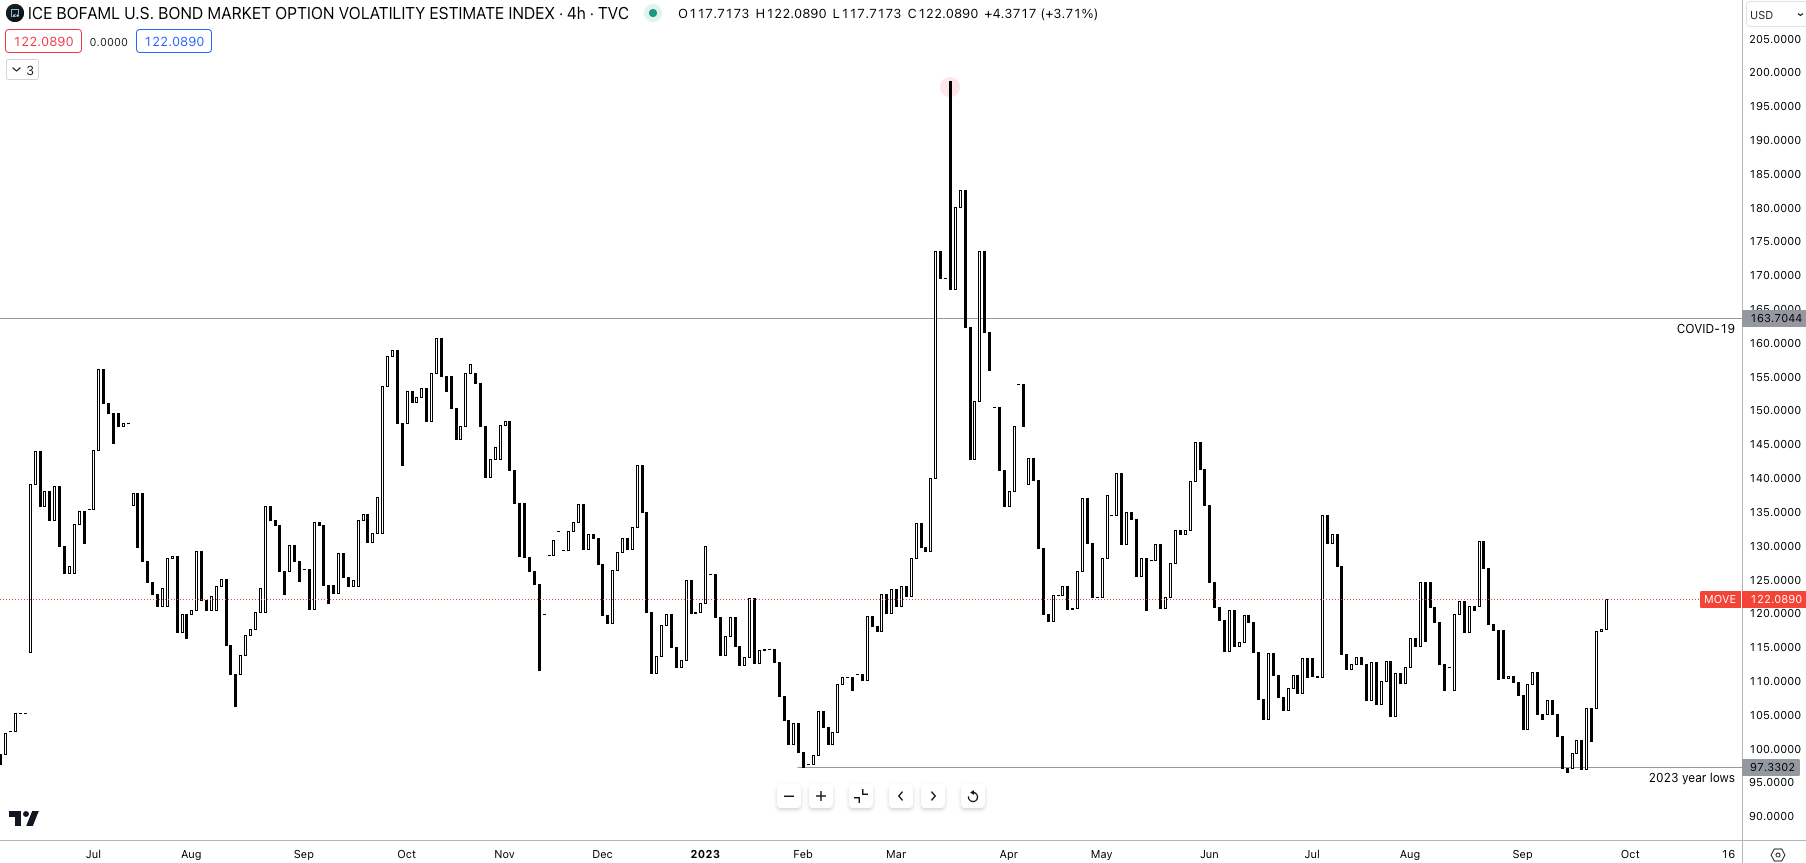
As a benchmark, since inception the average value of the MOVE index is 103.00, as of now the index has just surpassed 122.00 moving towards 130.00. This rebound comes after the index settled near the lows of 2023 before rebounding post the FOMC meeting.
The reason I’m exploring this is to show you the true transmission of monetary policy decisions in real time; there’s no better example than what we’ve seen the past week.
The current bond market is premised on the assumption of a soft landing for the US economy, with no recession or large increase in unemployment. However, government spending has propped up GDP by encouraging private sector spending and investment. For example, the CHIPS Act provided $280 billion in new funding for domestic semiconductor research and manufacturing, and the Inflation Reduction Act has contributed additional fiscal dry powder to the economy, translating to US GDP figures.
Today, US GDP YoY came out at 2.1% in line with expectations, but once again, the question to ask oneself is what happens when the government’s fiscal spending slows down and we see the expected contraction in US consumer consumption as student fees resume this month?
It’s inevitable that there will be a void within the US economy once the fiscal spending dominance subdues and the effect of the hiking cycle materialises. If the US begins to print large job losses and lower-than-expected GDP data, we would see a reversal of the huge rally in long-end yields as the Fed aim to steer policy back to a neutral/accommodative rate.
To wrap this report up the recent surge in Treasury yields is a sign the bond market is reacting to the new hawkish projections from the Fed, and as always, duration matters. The bond market is in turmoil as this policy framework has the potential to significantly slow economic growth in the upcoming 12-24 months.
Overall, the bond market is sending a clear message, risks remain elevated as rates remain higher across the US.
Until next time