
US Cracks, China Sparks: Betting Against the Crowd
Snapshot View: Dovish BoE, TLT Long Update, HSI Plays & Persistent Inflation Concerns

Hey MMH crew,
This report was a detailed one so I took slightly longer to get this wrapped up.
As always, thanks for your patience.
Today’s report is centred around trade ideas (a primer), trade updates/lessons in macro, and as always a snapshot of the current macro environment and action we’ve seen this week from the BoE and markets.
Lend me your attention:
Macro Snapshot
Last week Friday non-farm payroll data was released which showed the US economy added 175,000 jobs, 45k lower than the expected 220k. Over February and March, there was a net downward revision of 22k jobs for the economy. This soft print gave traders a reason to bring forward rate-cut expectations, as yields caught a bid post the data release.
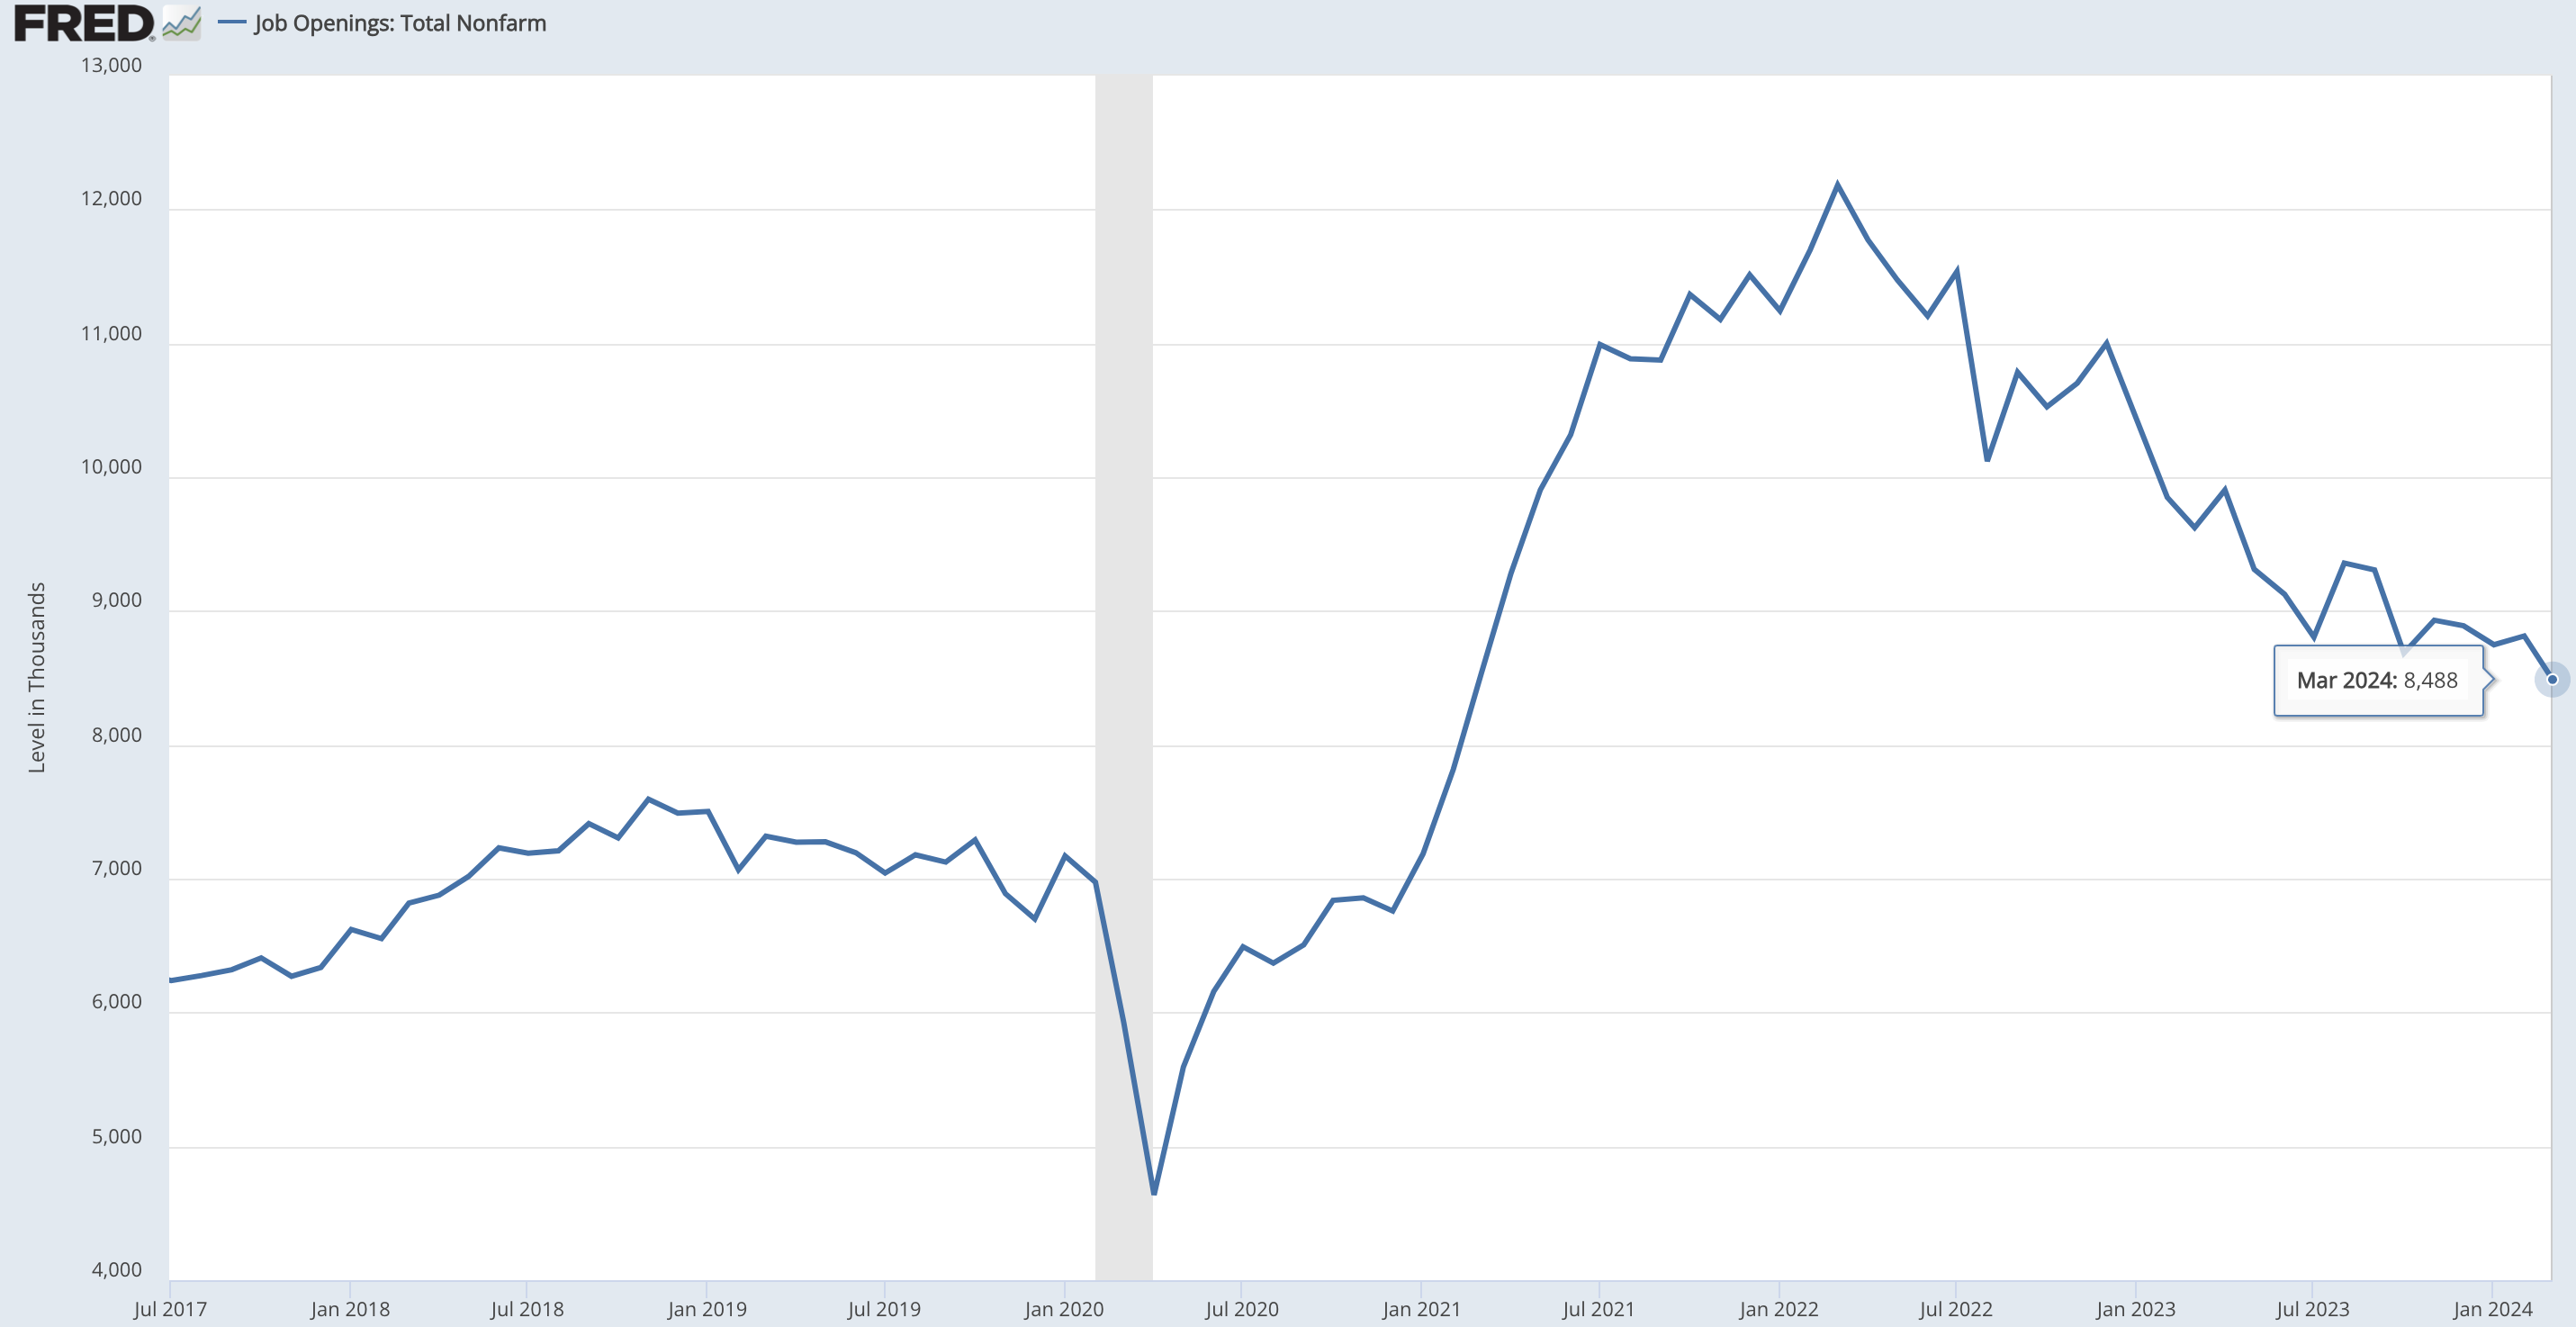
Non-farm data has gone from exceptional to acceptable, JOLTS data shows that there are fewer job openings in the economy resulting in continued cooling in the labour market.
The QUITS data shows a similar trend in the US labour market.
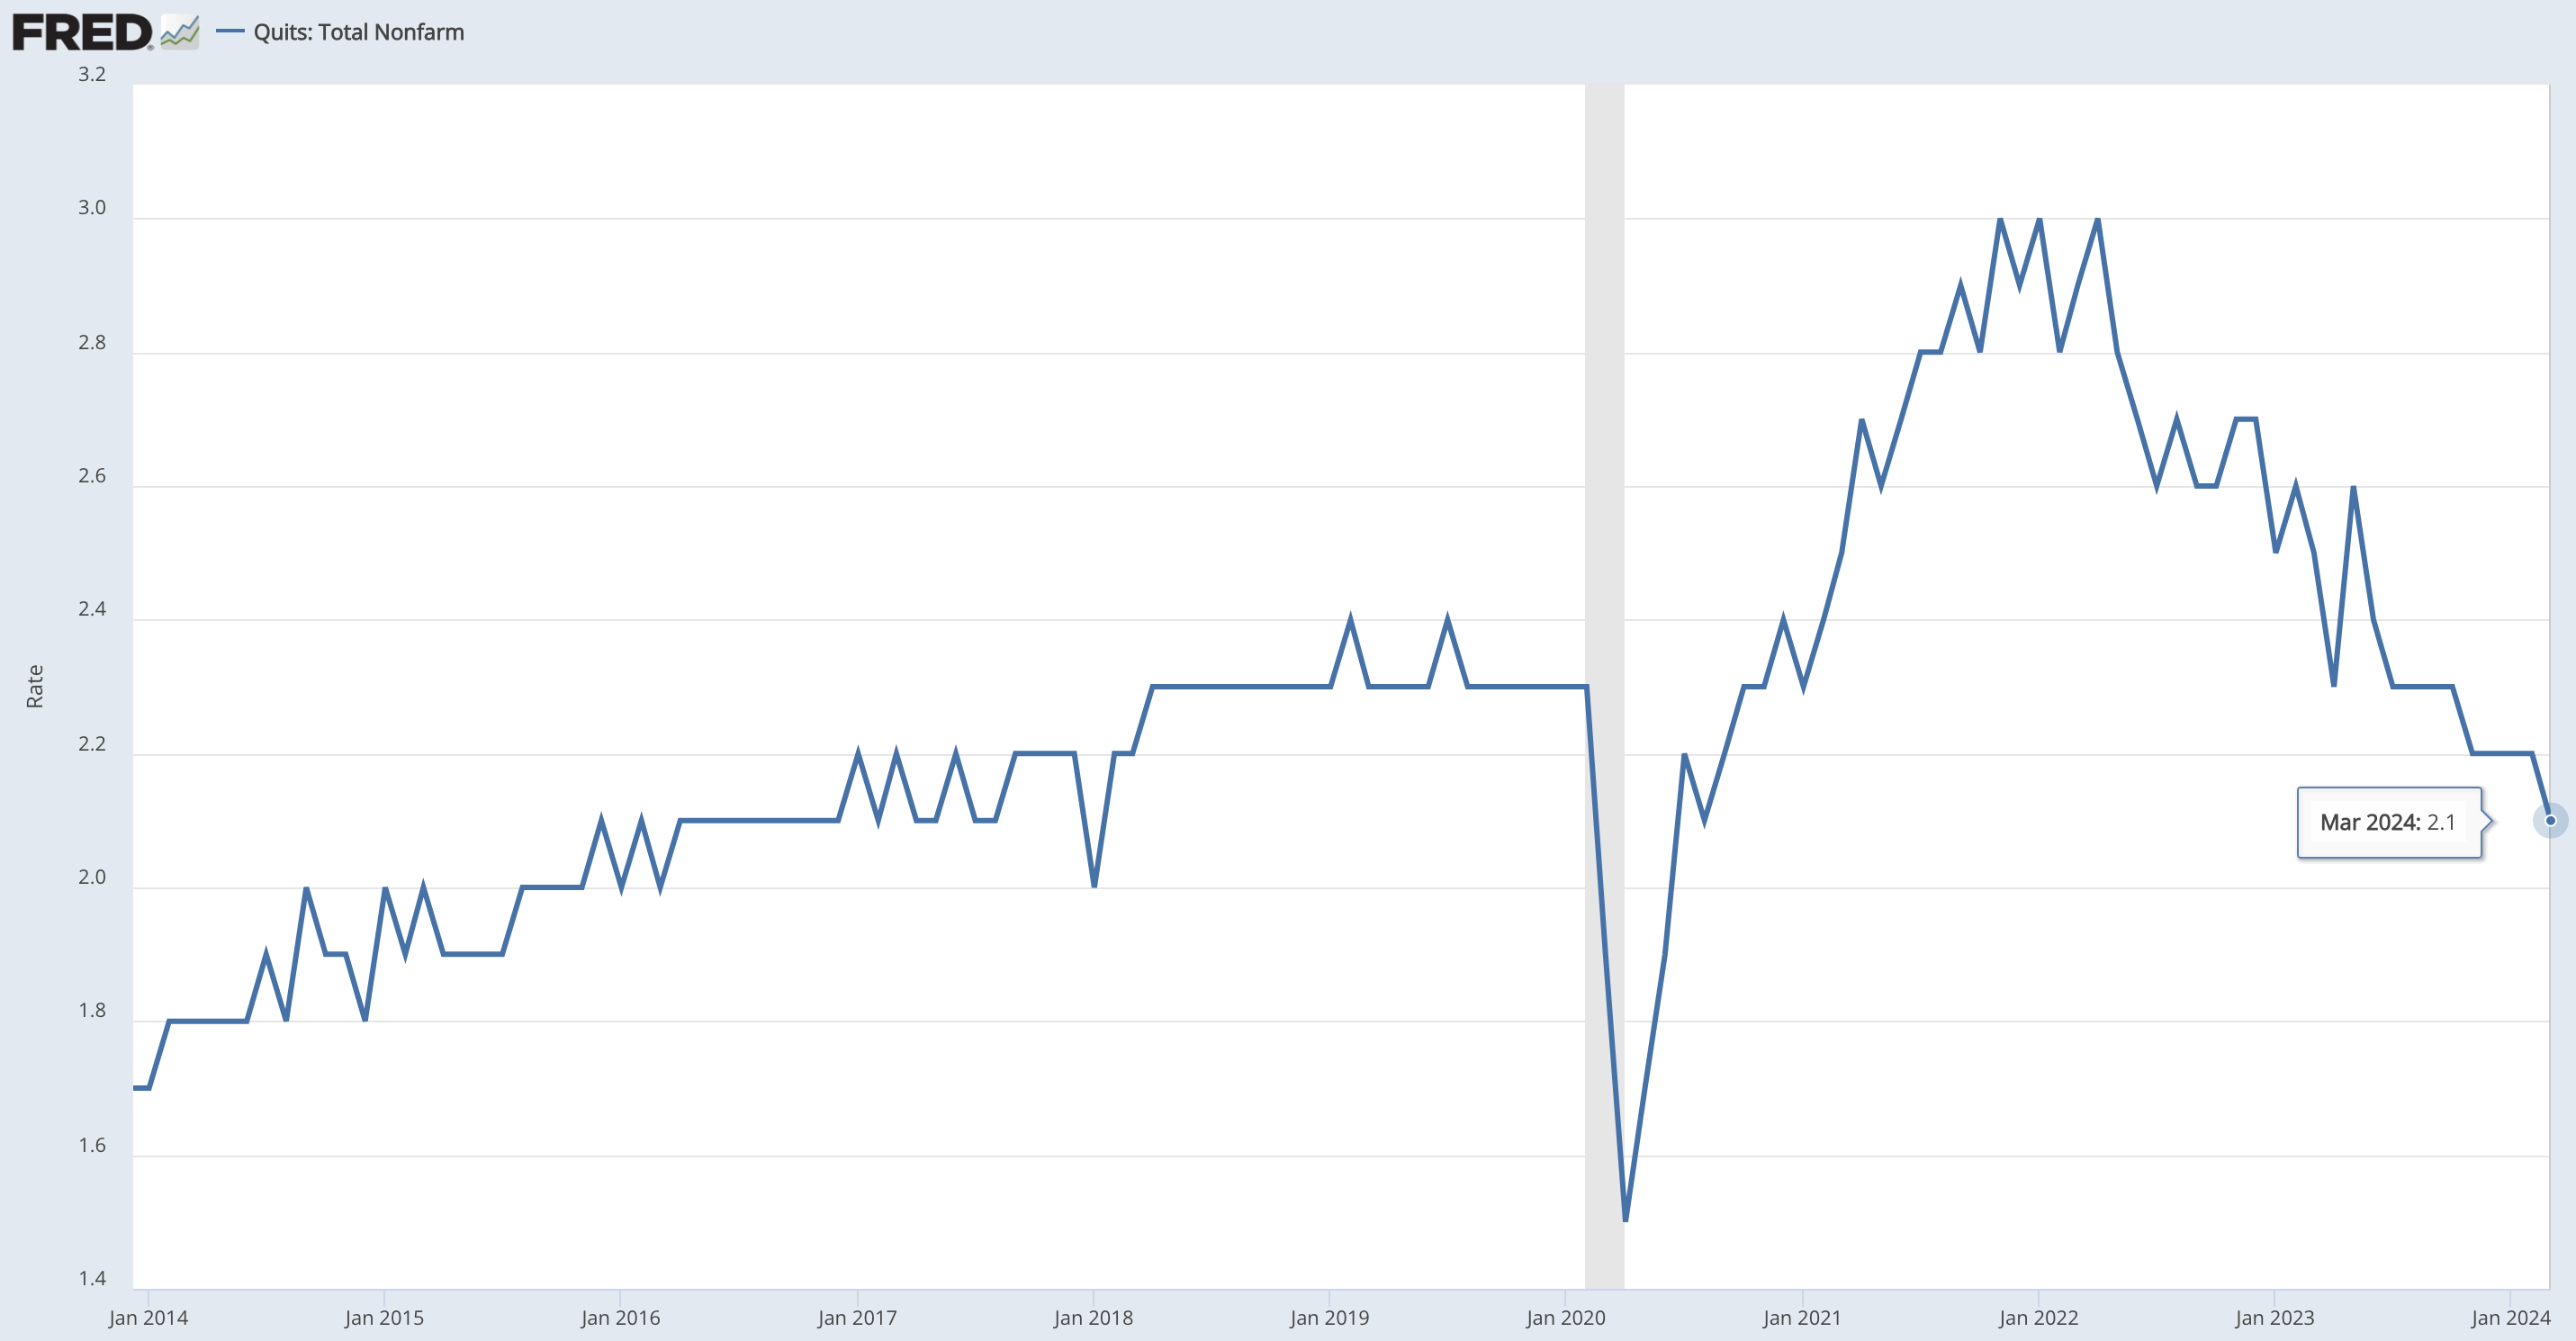
As a recap, the Quits rate indicates how comfortable employees are to voluntarily leave their jobs, to pursue other opportunities, usually other jobs. In a strong jobs market as seen at the peak of 2022, Quits rates are high, since workers feel confident in finding new positions elsewhere and are incentivised to move by higher wages. Now we’re seeing the quits rate drop to levels not seen since January 2016.
This begs the question: “Are we overly optimistic about the U.S economy?”
The simple answer, is yes.
As I’ve mentioned in many reports, the “US dominance” has not been driven by US exceptionalism, but rather fiscal largesse, take away all the dry powder injected by the Biden Administration and we’re looking at a much weaker economy and a Federal Reserve embarking on rate cuts next month.
Thought of the Week
The best traders are rewarded for seeking opportunity in calamity.
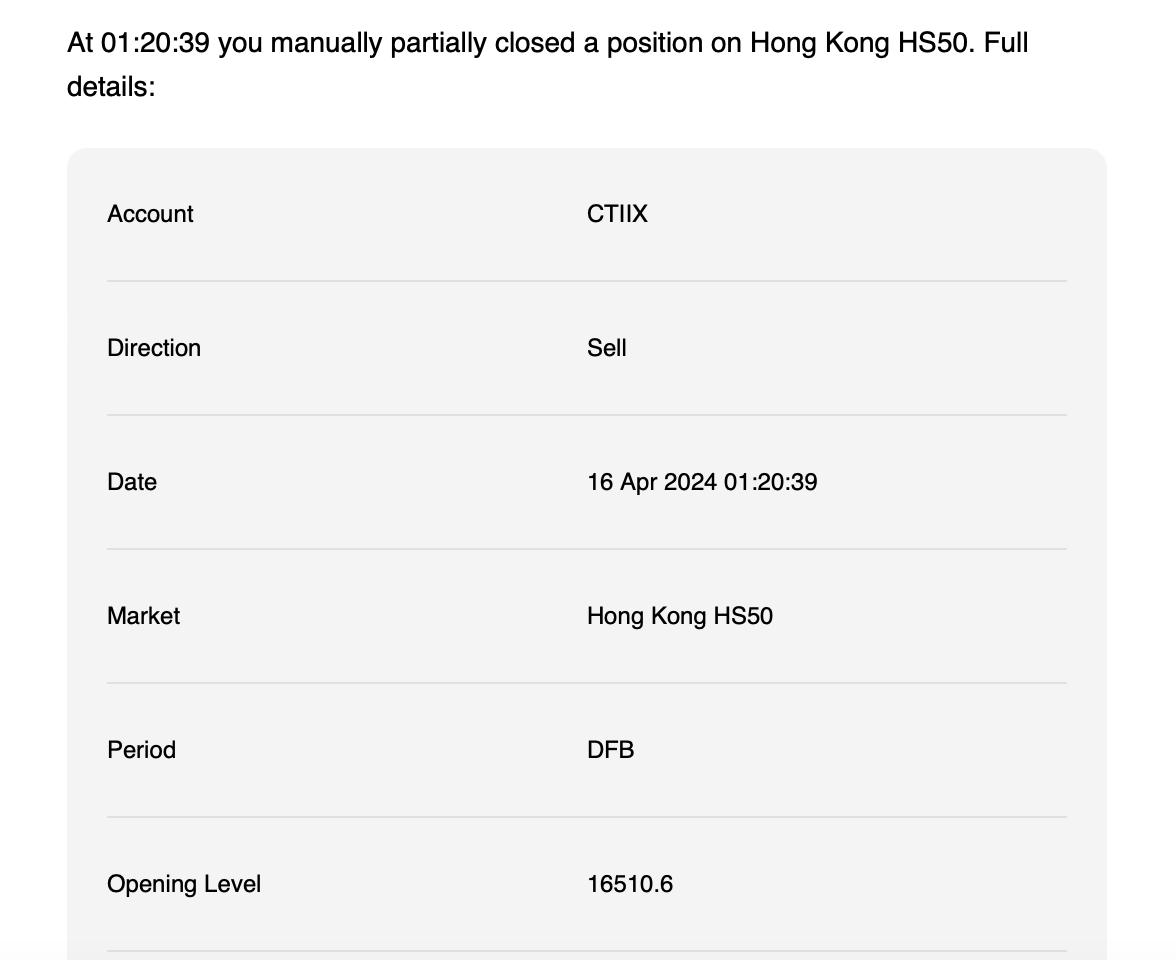
That’s what I was telling myself a month back when I entered a long position on the HSI Index.
When everyone is looking away from a market, there’s greater risk-reward looking into it. China for the longest while has been under a heap of financial media scrutiny, from its weak FDI flows to the deflationary prints, and concerns surrounding shocking trade data, there’s almost been nothing positive to say about China, until now.
Whilst I wasn’t able to realise gains from this position, it re-emphasised a great lesson which is to continually go against the crowd and trust your intuition. Independent thinking is a rarity amongst market participants, everyone wants confirmation that they’re right, so much that when they’re doing analysis they’re simply looking for bias confirmation. Don’t be afraid to go against the popular view.
My long play came from a simple understanding, markets are almost always more pessimistic than the situation warrants. The HSI is comprised mainly of tech companies, making c.28% of the index, whilst there’s real reason to be concerned about China over the long run, the levels Chinese equities were trading at, were as close to distressed levels as you can get in public markets.
I entered this position earlier in March and after a month of sitting on my hands waiting for the upside to happen, I later exited on the 16th of April. Lack of patience on my part, nevertheless another macro trading lesson I won’t forget. “Set and forget”.
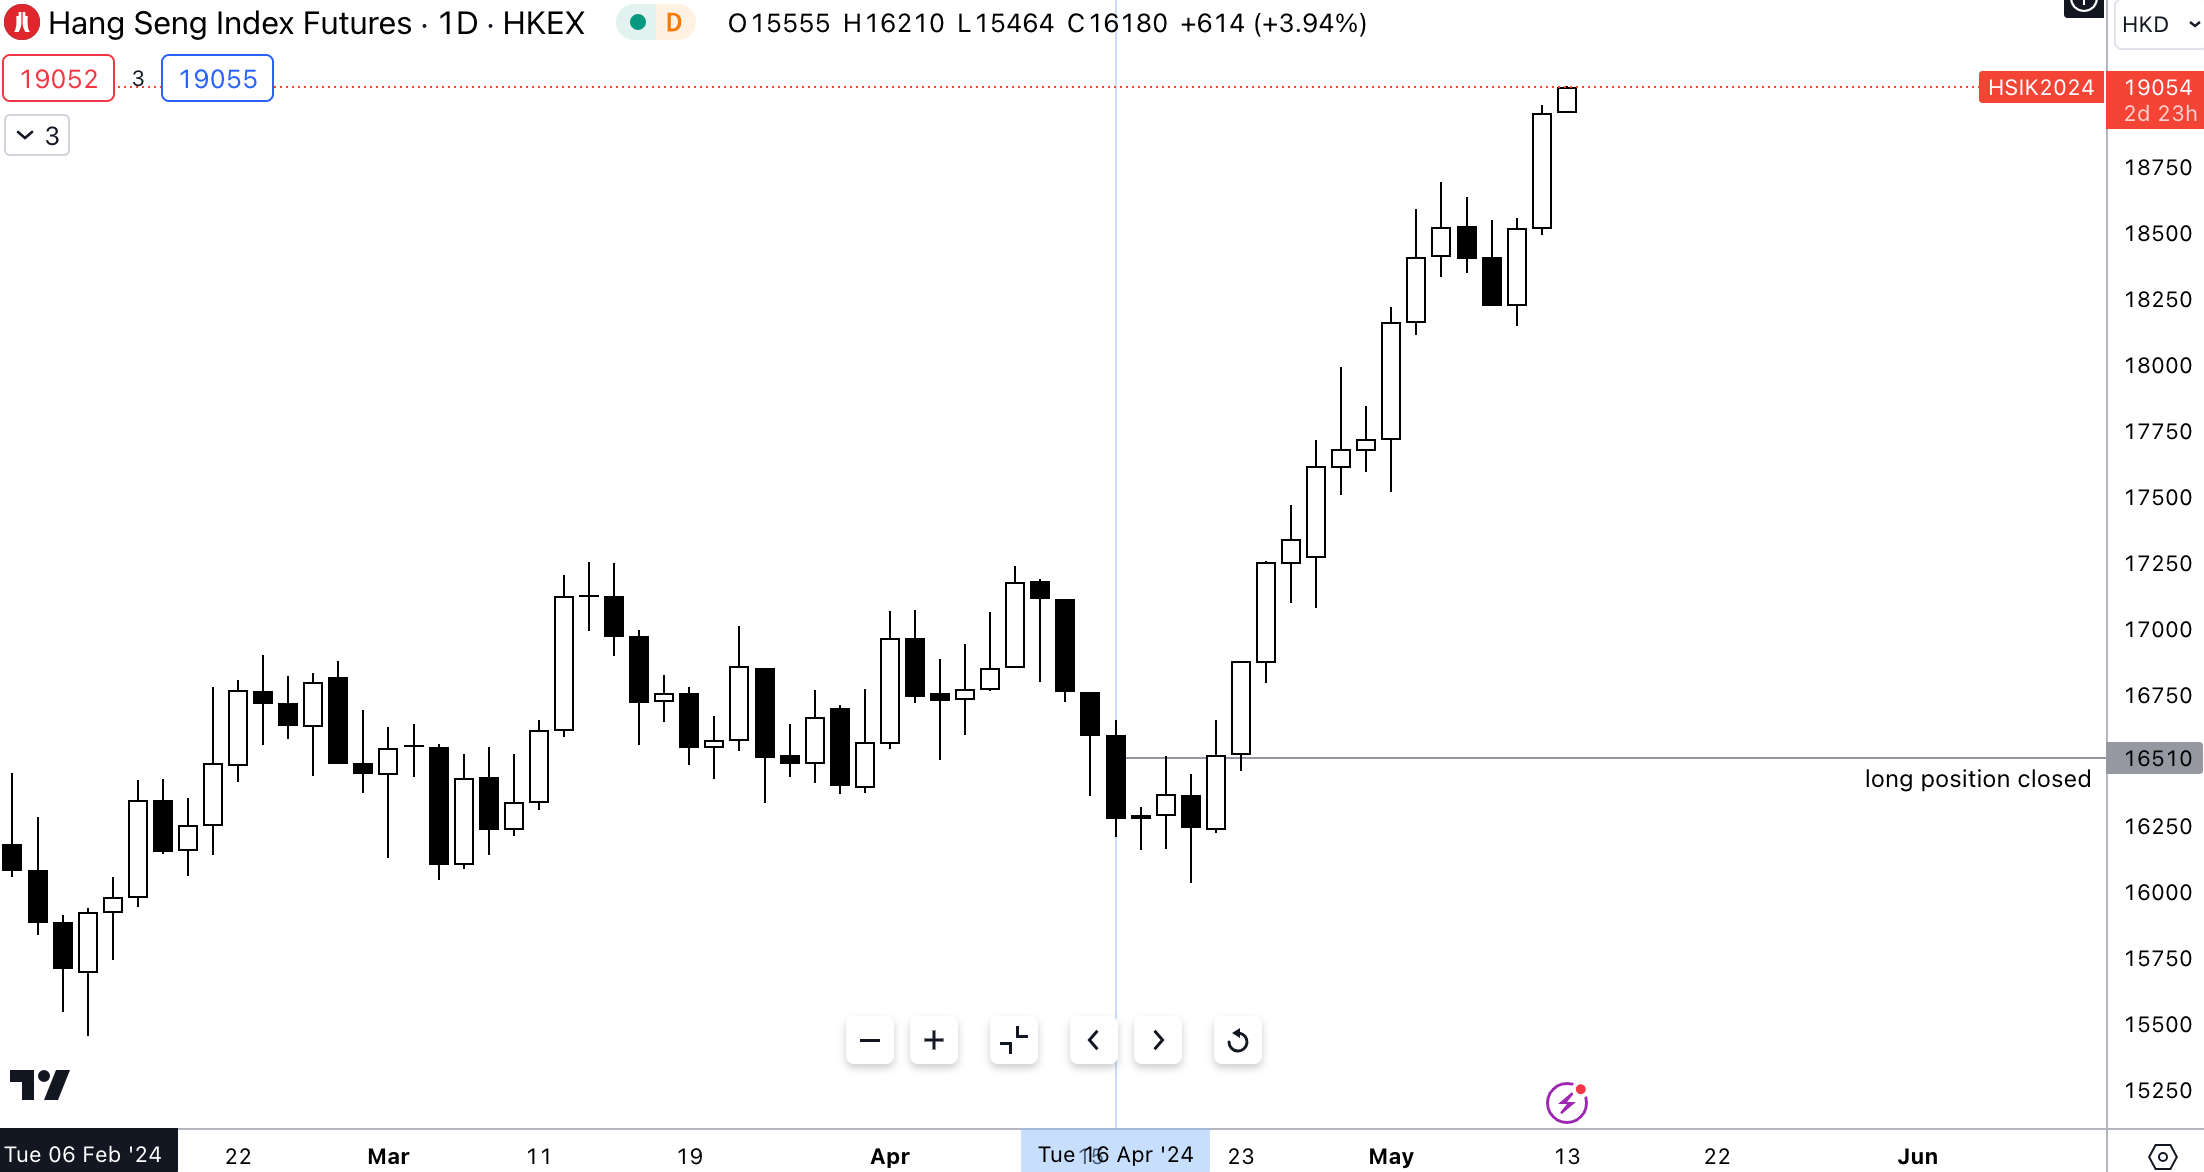
Chart of the Week
US Economic Surprise Index
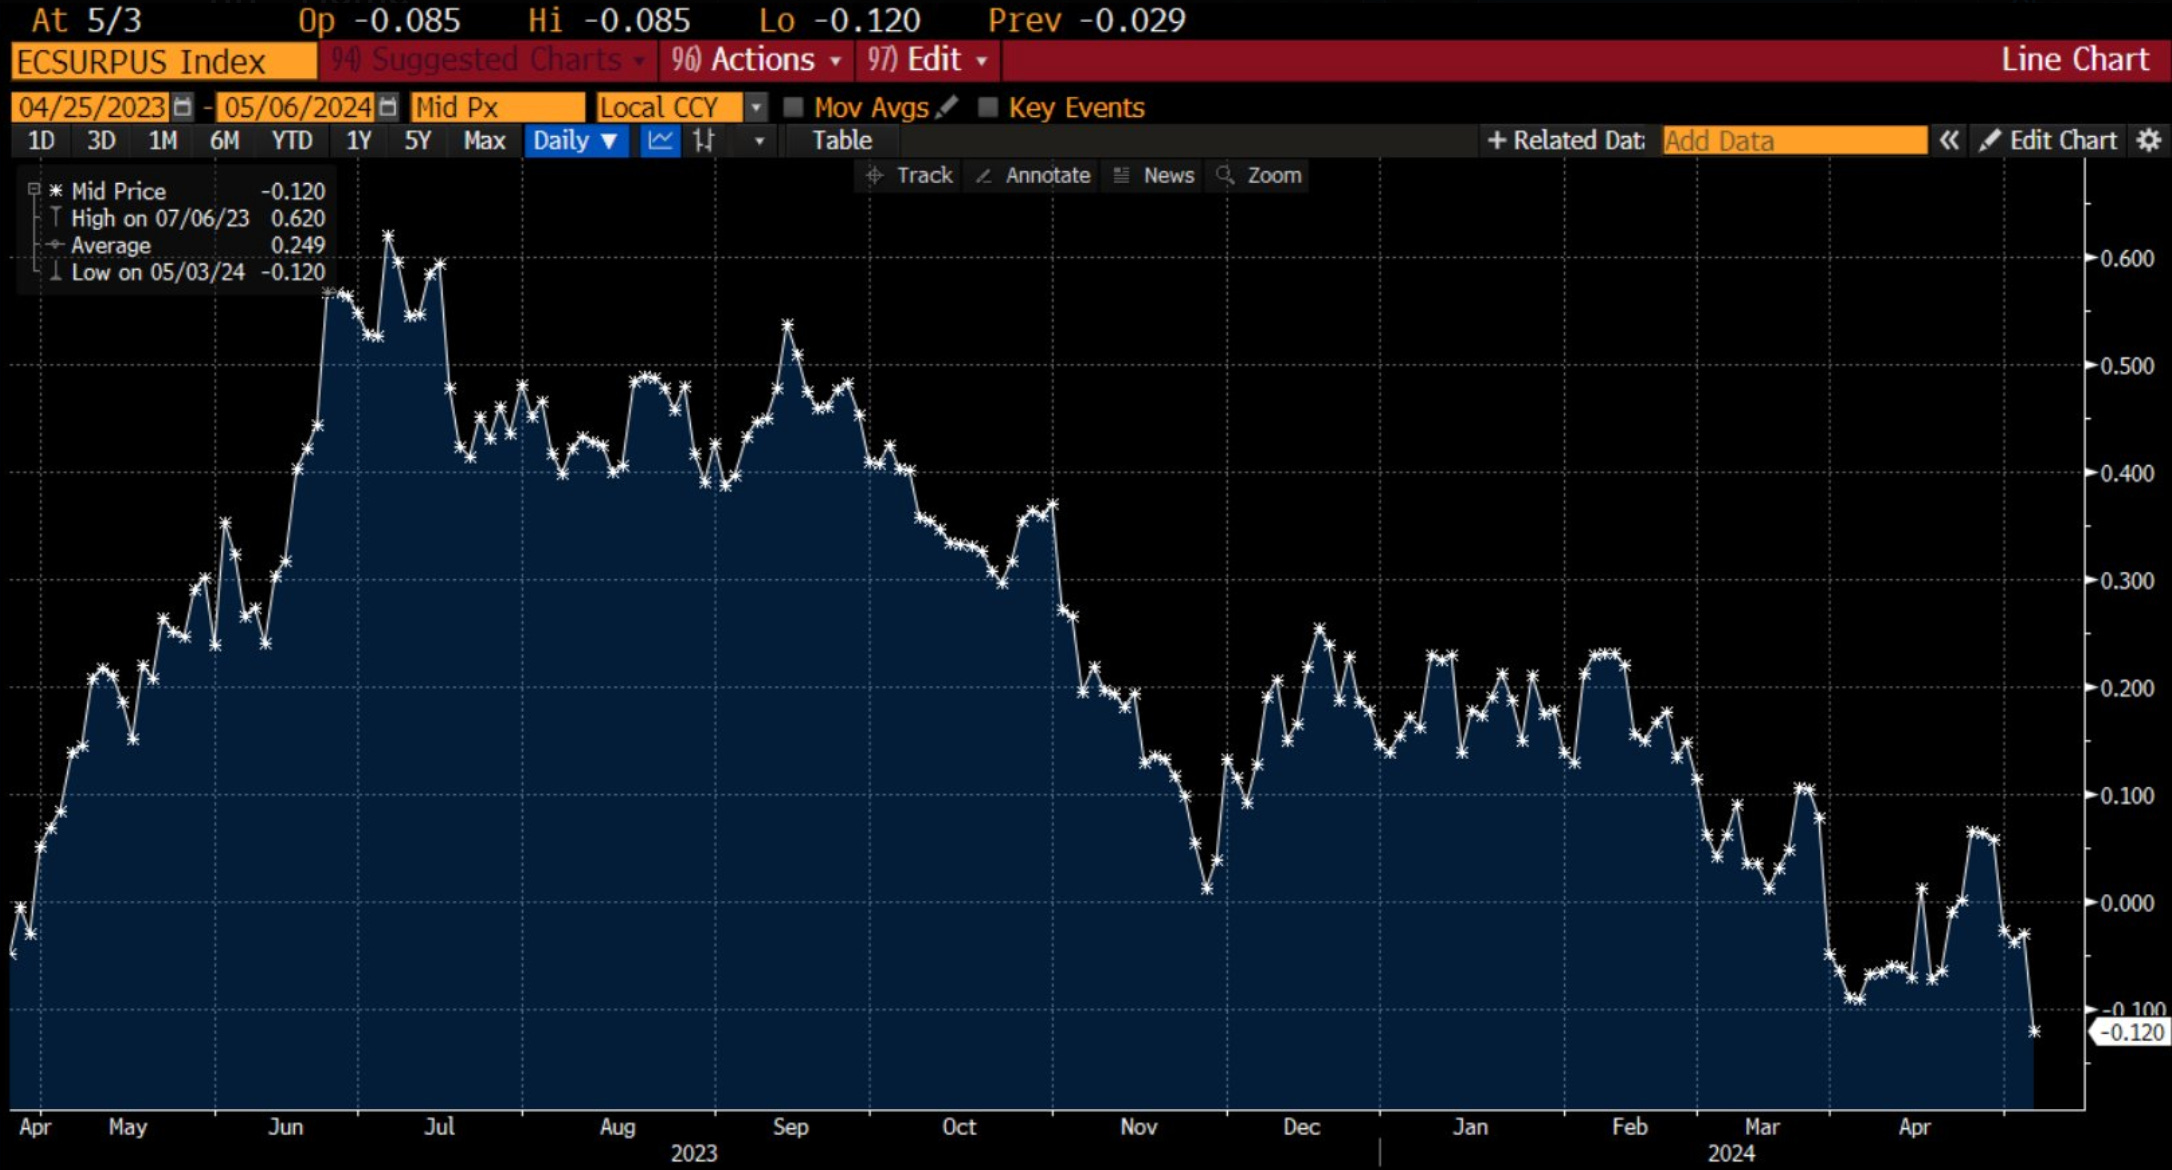
For any readers seeing this chart for the first time, I’ll briefly explain what this means:
Simply put, the Economic Surprise Index measures the data surprises in the U.S. economy relative to market expectations. A positive index reading indicates that economic data has been stronger than expected on average (positive surprises). A negative reading suggests data came in weaker than anticipated (negative surprises).
The index extended into negative territory for the first time since early 2023.
In a macro regime where nearly everything coming from the US has been “exceptional,” we might just be approaching an inflection point in U.S data. Weaker jobs data and weaker economic data relative to expectations bring forward the Fed cut which should allow us to experience bullish rates (lower yields) across the curve.
BoE - June Here We Come (unofficially)
Yesterday the MPC voted to keep rates unchanged at 5.25% with a 7-2 split between MPC members.
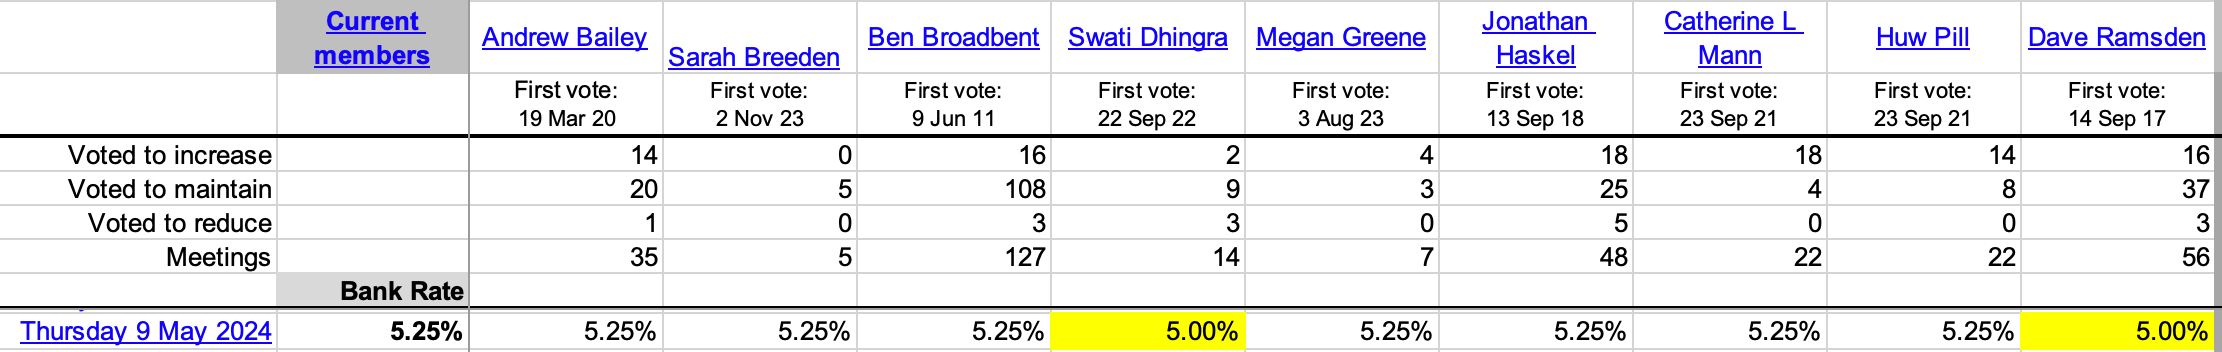
Dave Ramsden and Swait Dhingra, the two dovish members of the MPC voted for a 25bps reduction to 5.00% as seen above.
Here’s what you need to know from the meeting:
Inflation is the focal point.
The biggest concern for the central bank remains the risk of a secondary inflation spiral.
Although headline CPI has fallen to 3.2% YoY, certain components of the inflation reading like the services inflation remain elevated at 6.0% reaffirming their wait-and-react stance.
The sensitivity of UK rates to US economic data has begun to subside as a divergence in the economic outlook for the US and UK continues to widen. Meaning the MPC would be less influenced by Fed policy decisions and unilateral policy movements.
Implied rate cut expectations for 2024 are 75bps.
The BoE see inflation at 1.9% in Q2 2026 if rate cuts start this year.
With all that said, it’s safe to say that provided inflation continues its disinflationary trend, we can expect a cut in June from the BoE.
FX View
Short bias GBP/USD
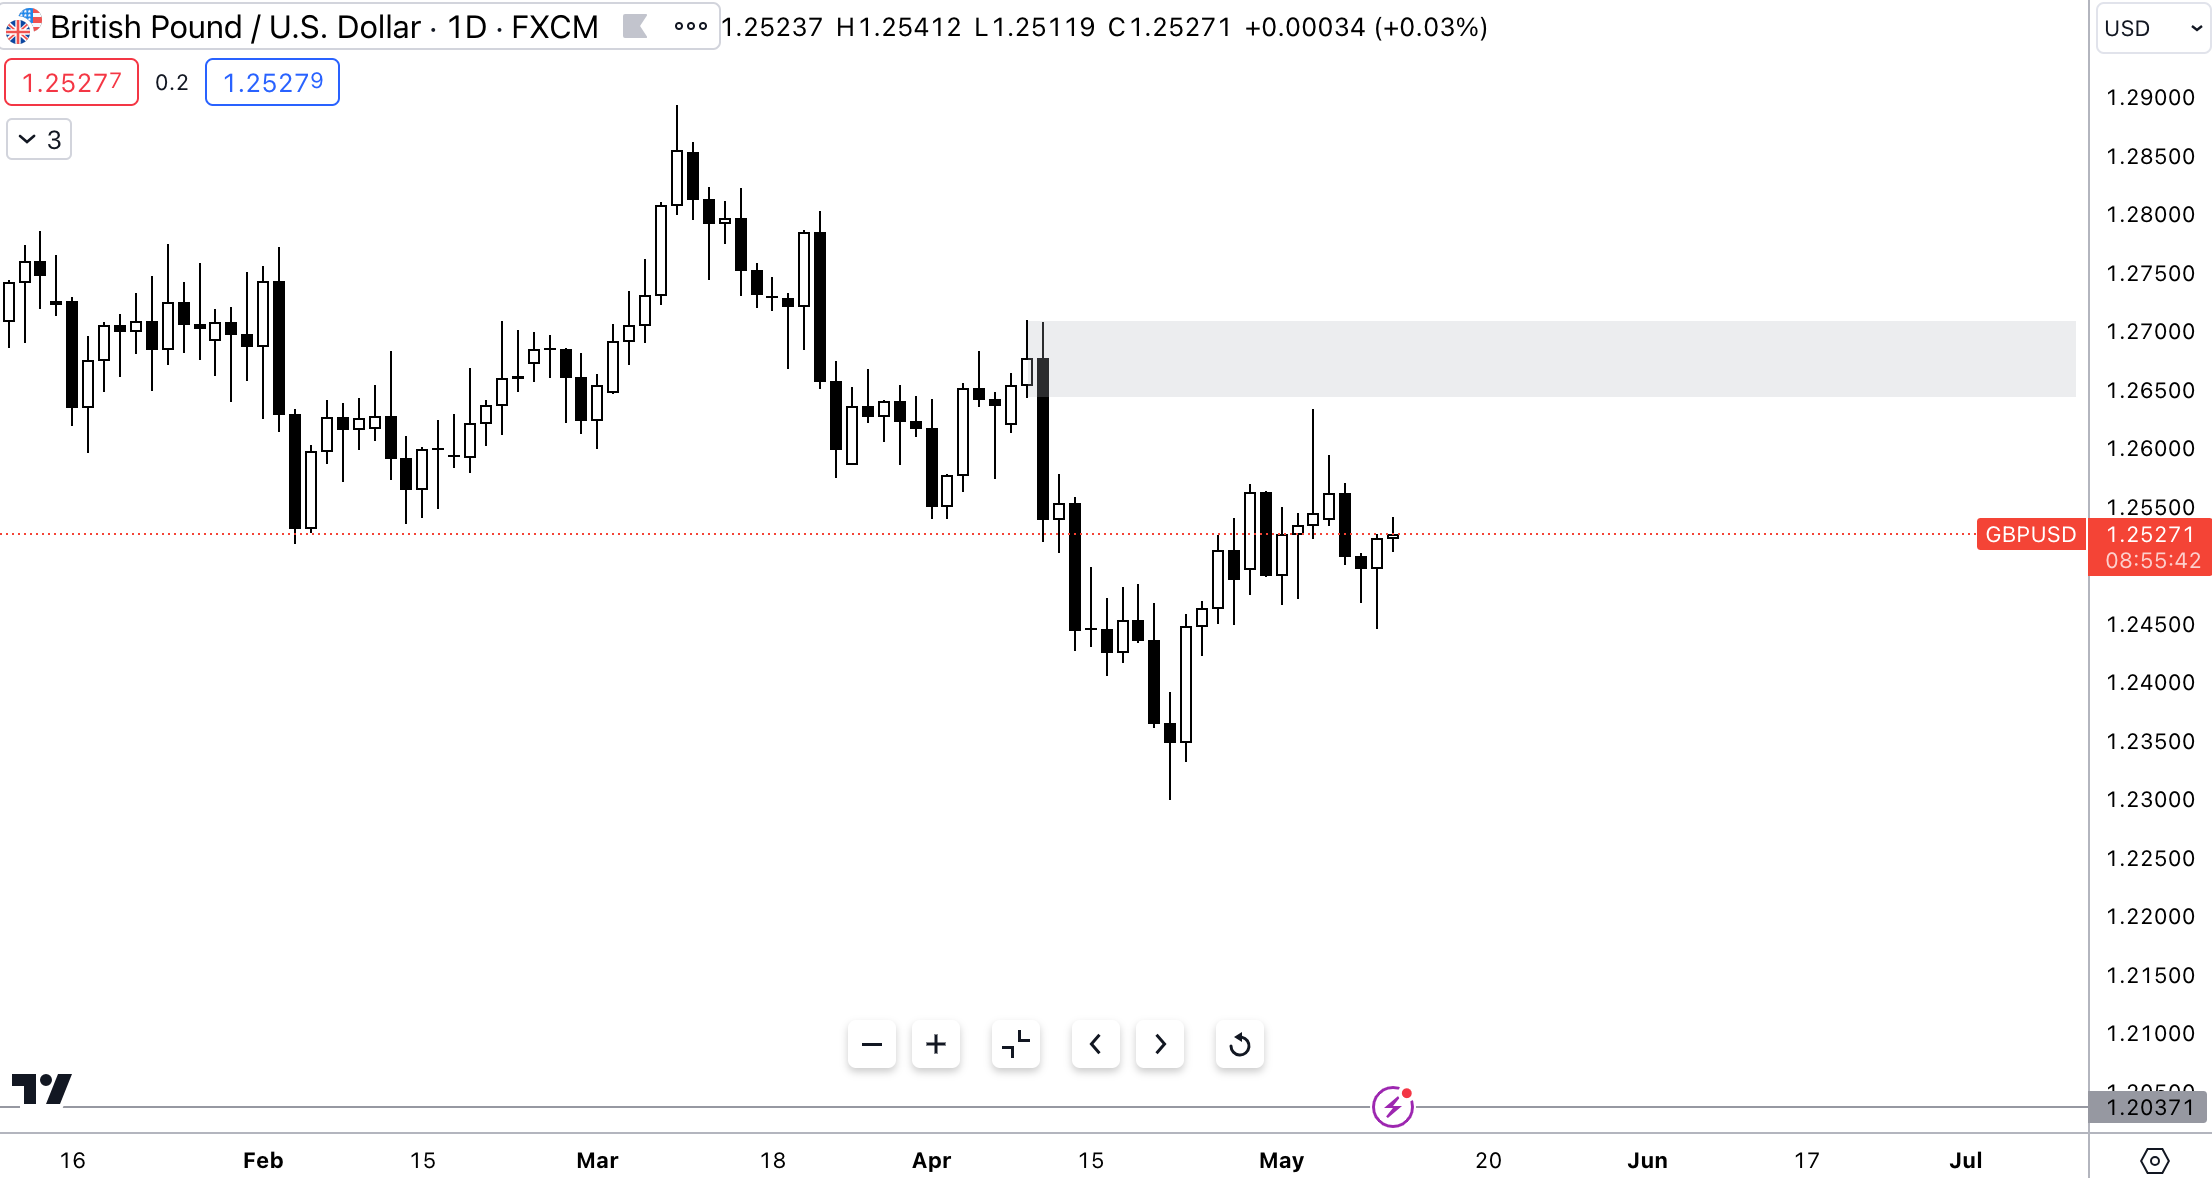
As such, my views on sterling remain poised to the downside. With the U.S experiencing waves of mixed data both from inflation and their labour market, I perceive the USD to remain bullish due to a combination of external geopolitical factors and its role as an inflation hedge putting the dollar in focus. Shorts around the 1.25500-1.2600 mark look attractive to me and maybe an active position I’ll look to put on; I’ll keep you all updated on this trade idea.
Treasury Play Still in Play
As many of you may recall I realised a trade idea on April 25, titled TLT Trade Idea (below):
TLT Trade Idea

Hey guys, It’s been another one of those busy weeks. Markets, updates, and a few in-person conferences as well— nevertheless I made sure to get this report across on time. We’ll be going into the recent PCE data, the rising liquidity concerns and how that plays well into our long TLT trade idea.
In this report, I expressed how an upcoming tapering of QT to minimise the risk of a liquidity shock amongst banks (through the reverse repo channel), accompanied by lower energy costs feeding into lower CPI readings could cause yields to compress.
Yields on April 25th were as follows, the 2s were 4.995% and the 10s were at 4.70%. At the time of writing this report, the 2s are at 4.832% whilst the 10s are at 4.473%.
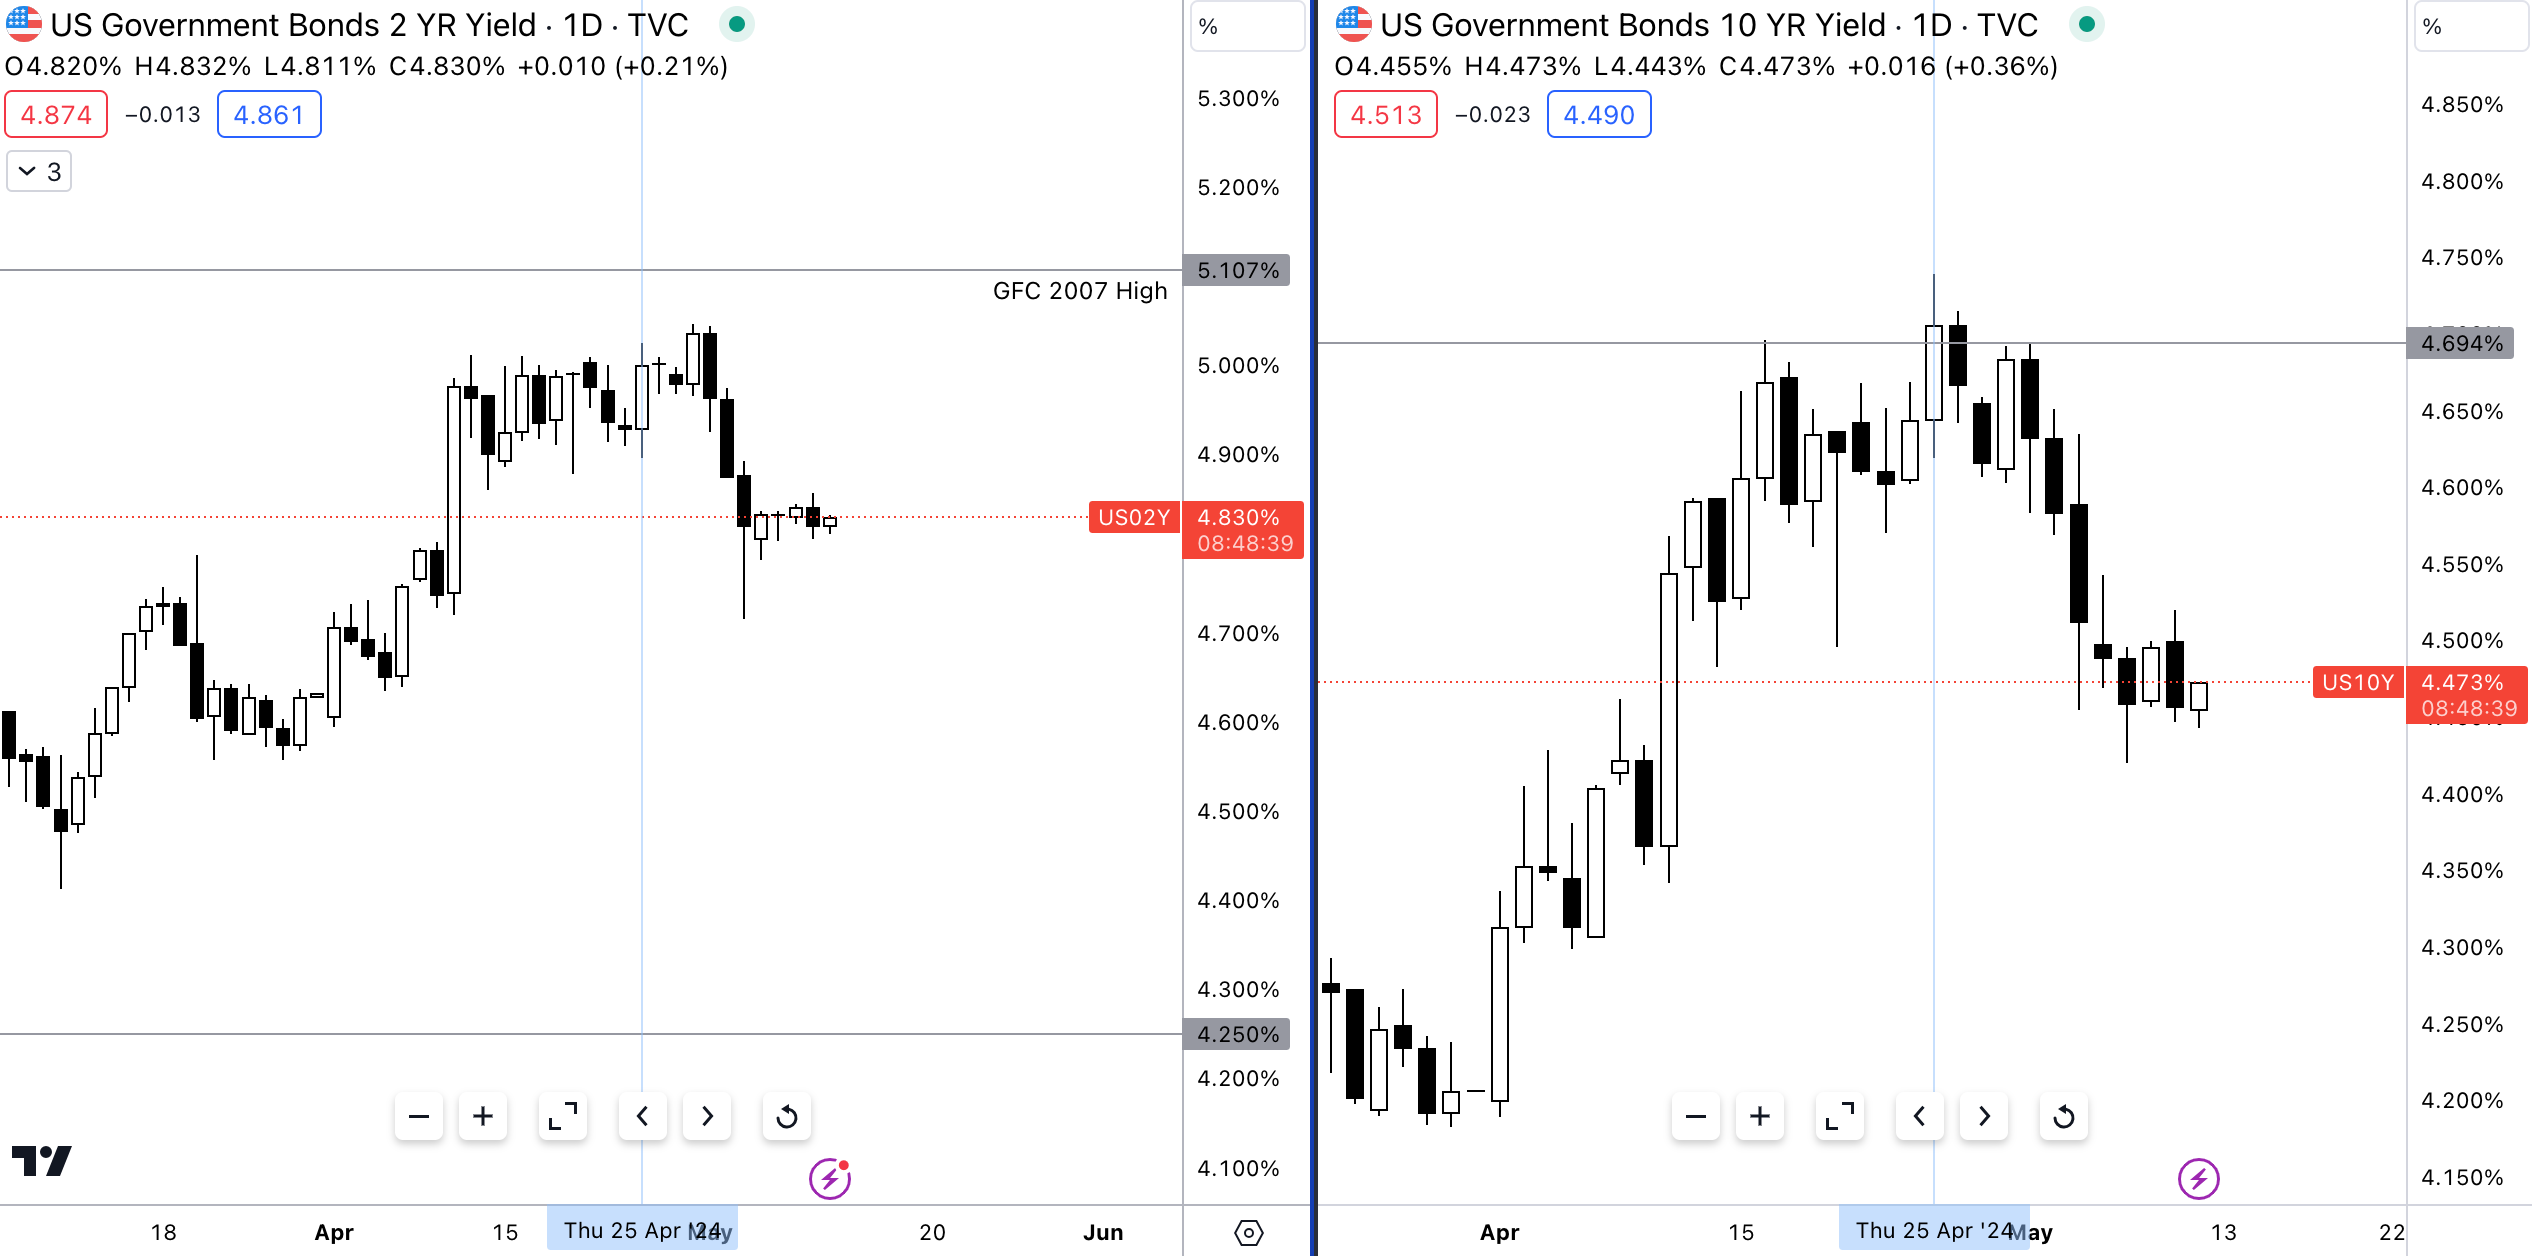
Let’s see what sort of move we’ve seen since releasing this report.
2Y Note (Current yield - previous yield = 4.995 - 4.832 = 16.3bps)

10Y Note (Current yield - previous yield = 4.70 - 4.473 = 22.7bps)
So, we’ve seen bullish rates across the curve— but more specifically a bull flattener move across the curve.
A bull flattener is a market move where investors buy more long-term bonds than short-term bonds, causing long-term yields to fall more sharply. This flattens the yield curve and can signal expectations of lower future interest rates or economic slowdown.
For full transparency, I’m not in this trade yet, however, I will look to construct a trade based on continued bullish rates across the curve. With the Fed expected to hold out at least until Q3 the bull flattener trade presents the best timely opportunity for me across FI, so putting this position on would be a conviction play.
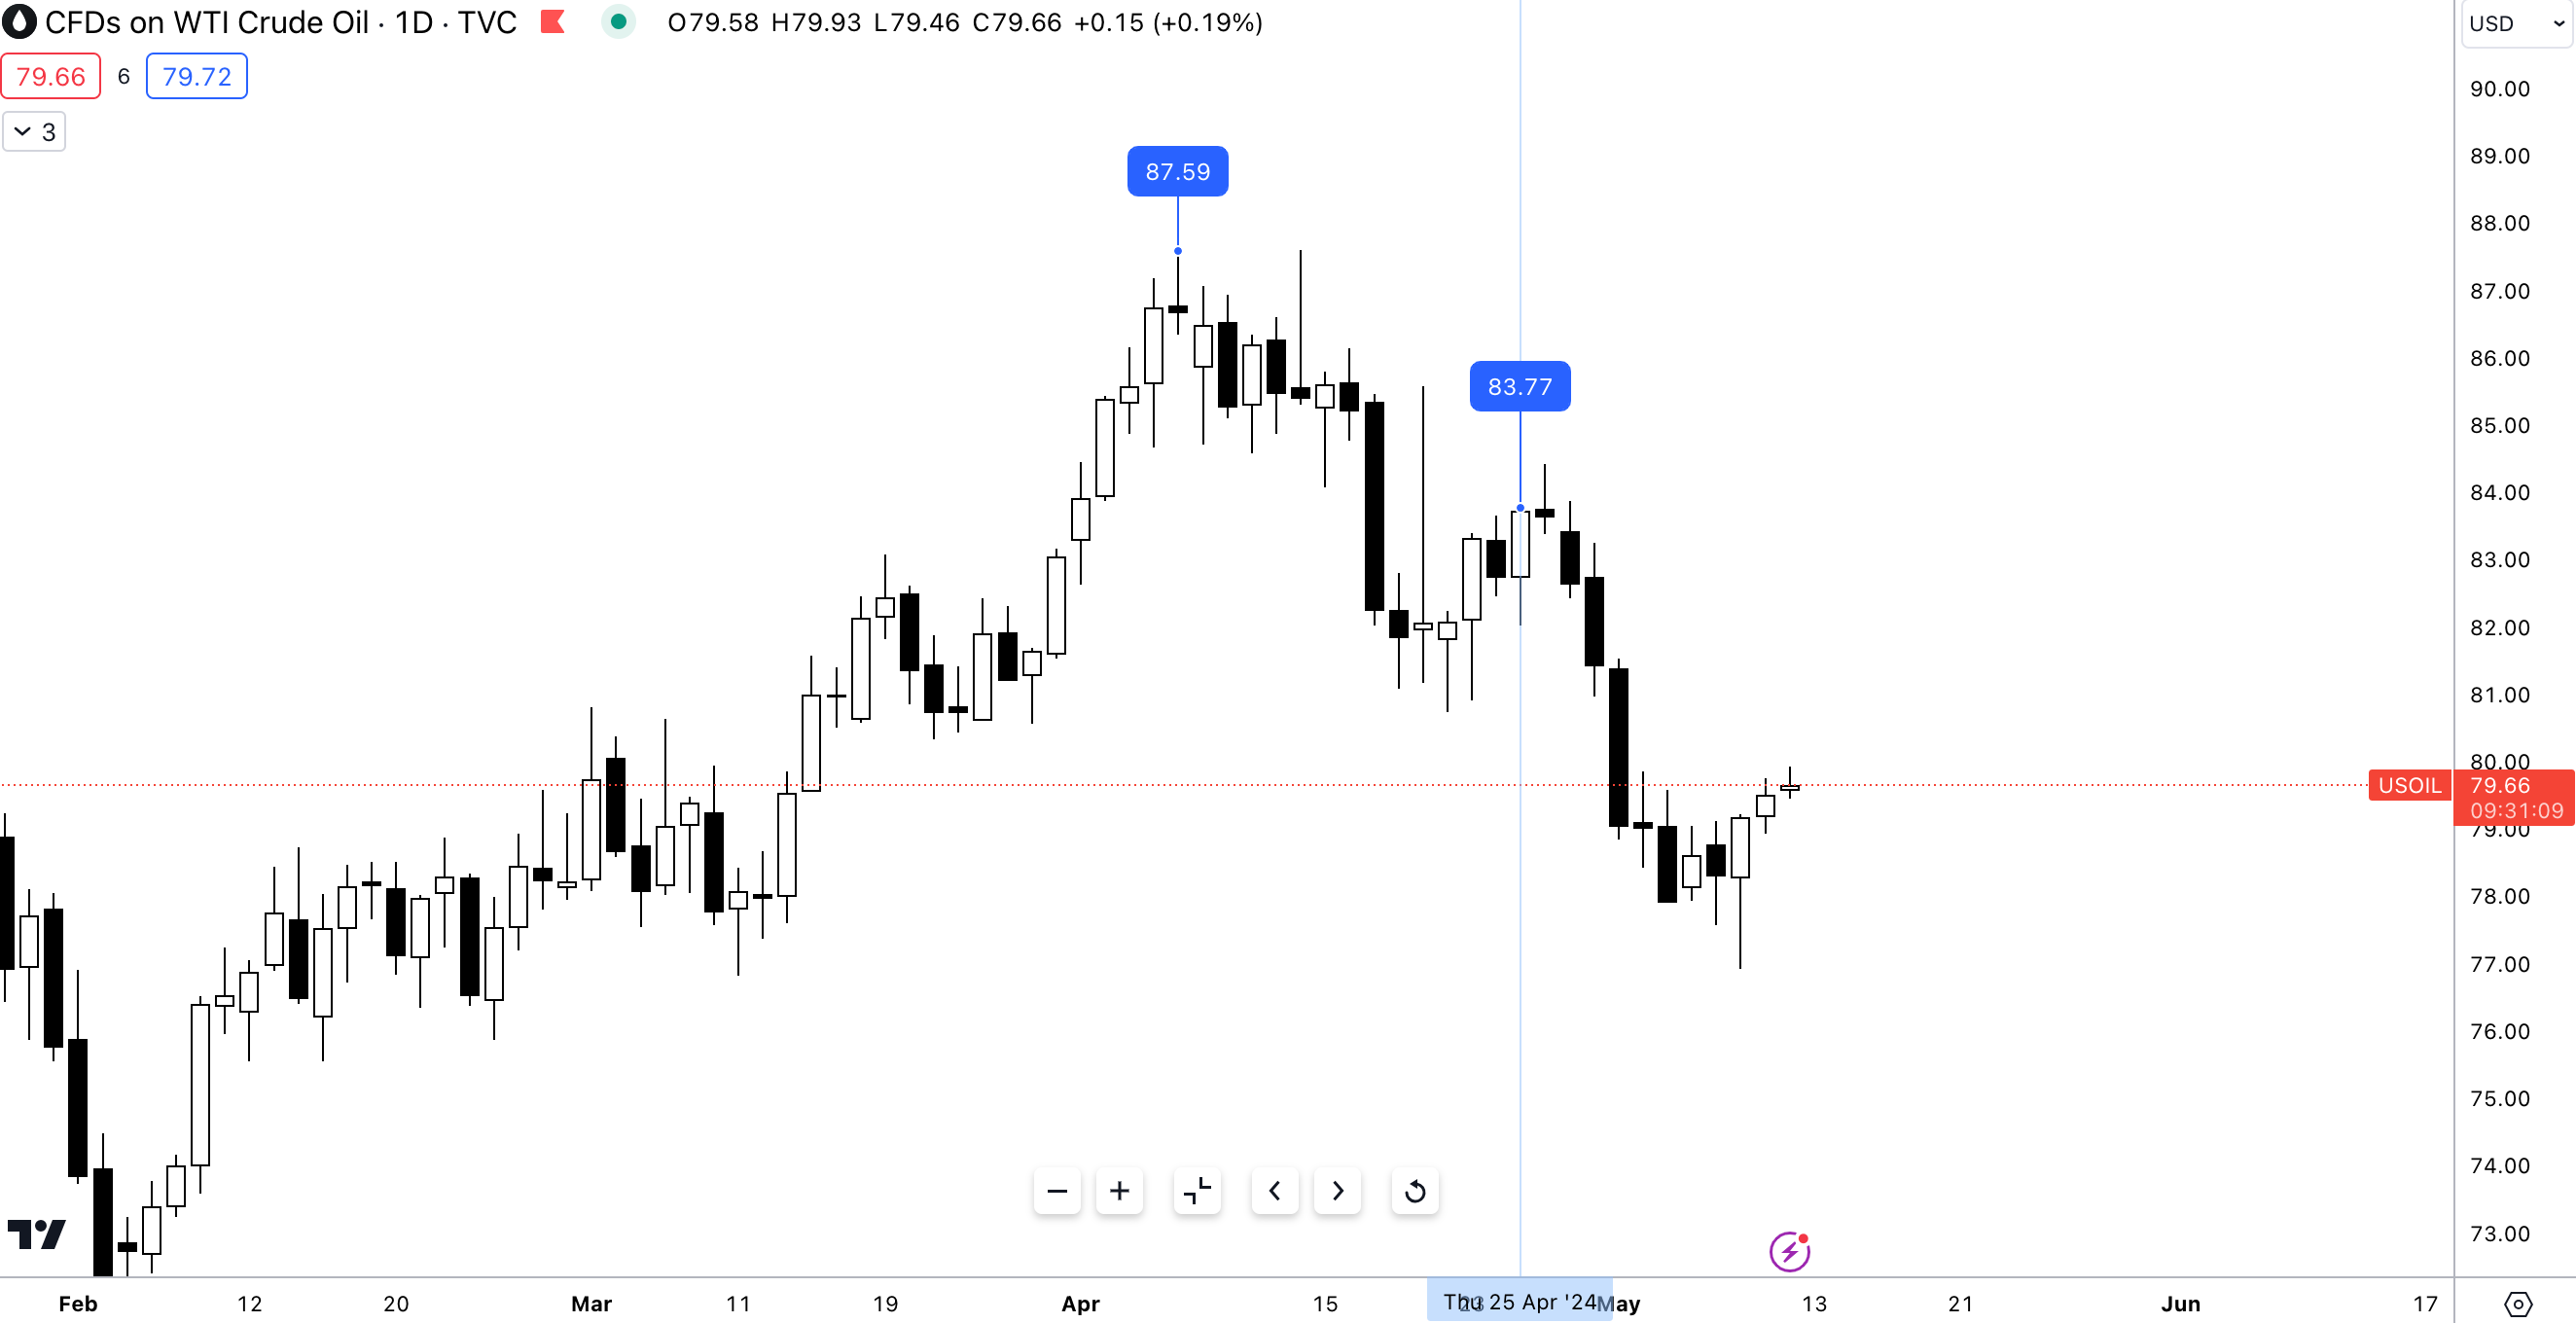
Following my point on energy costs, we can see that much of the geopolitical risk premium has significantly decreased as crude prices have fallen from highs of $87pb to $83 and now sitting above $79.
This price region is an important one as the Biden Administration has made it clear their price target to replenish the SPR sits at $79p/b or less. As promised the Biden Administration has stepped up purchases of WTI to replenish the SPR.
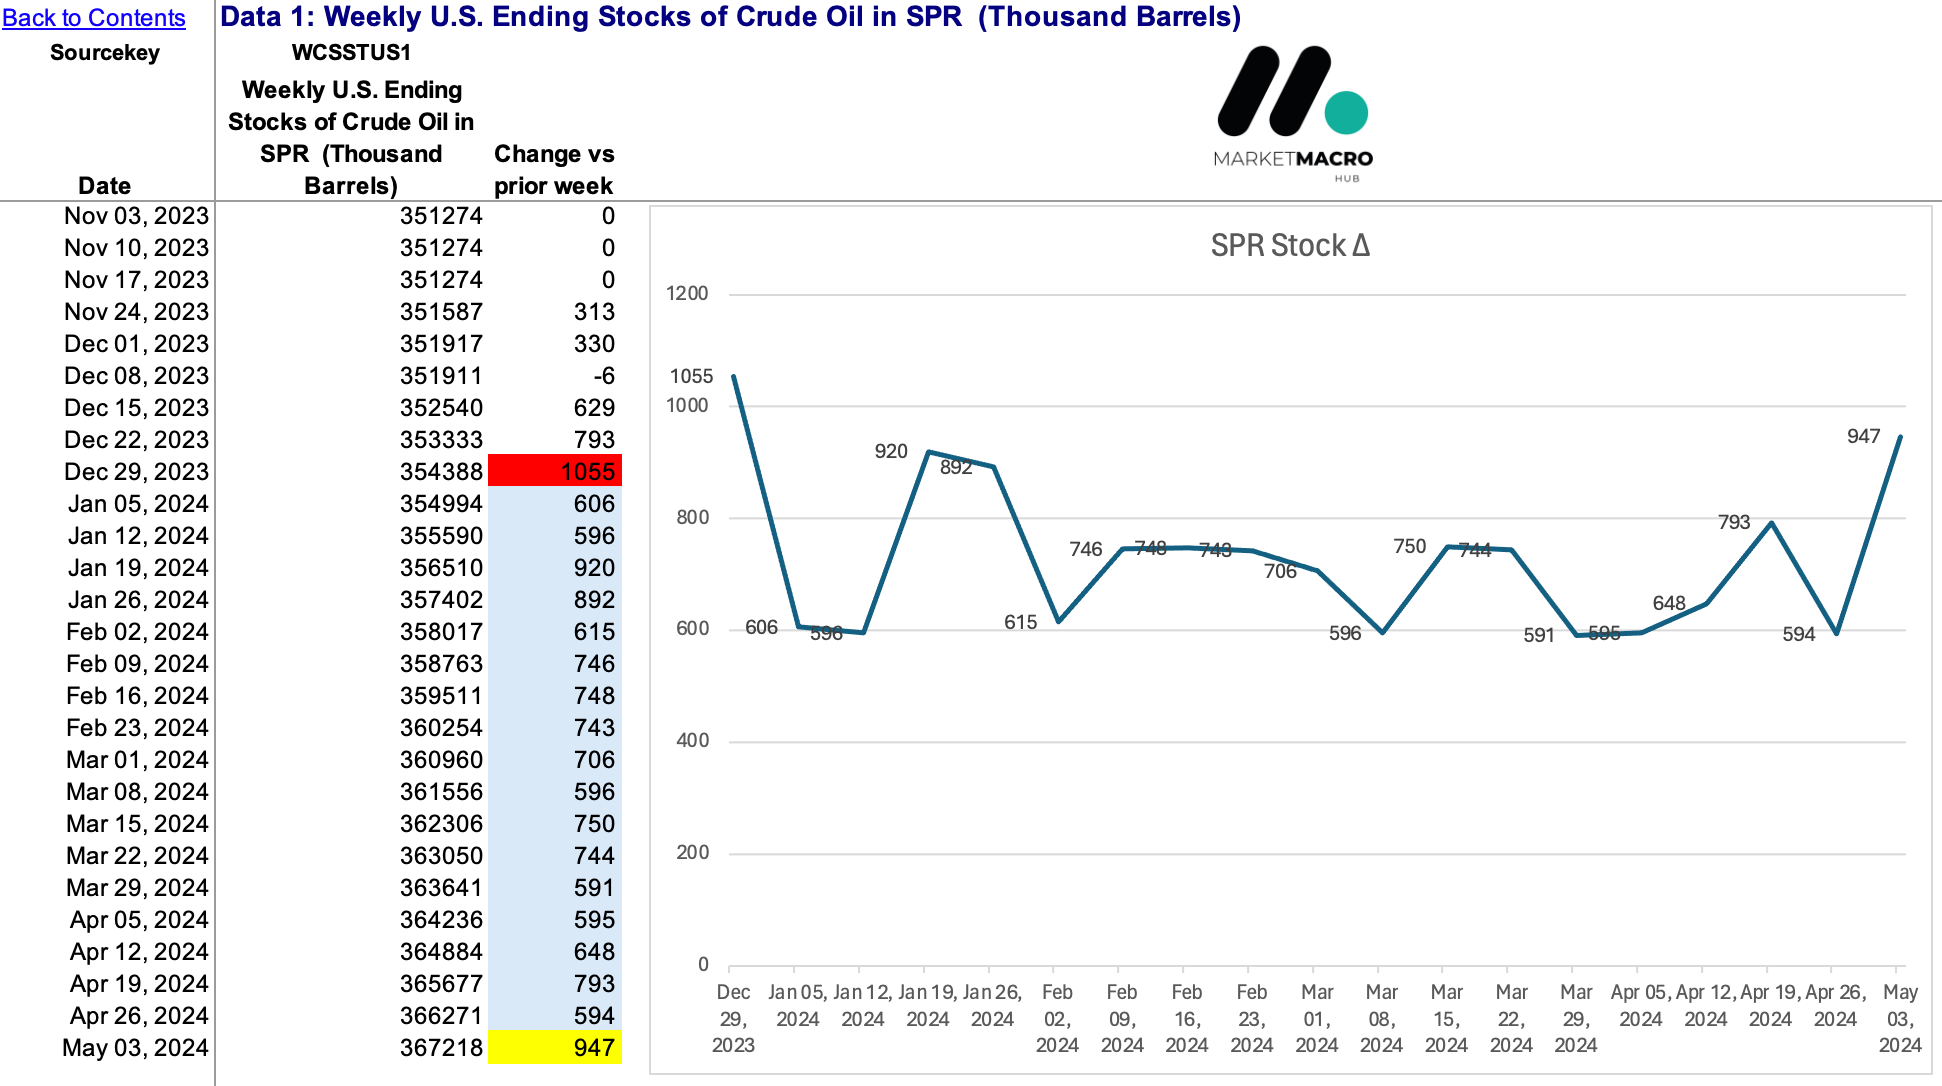
Looking into the data we can confirm just that, last week the Biden Administration added 947,000 barrels of crude to the SPR, the largest single-week increase since the week of December 29, 2023, when crude was trading at $71.
Next week I’ll be doing a piece focused solely on trade ideas; some of you guessed it already—yes, WTI longs look to be another long play as lower prices attract greater bids from the Biden Administration.
That’s a wrap for now, stay tuned for next week’s trade updates.
I hope this was another insightful read for you MMH crew— as always, I appreciate your readership.
If you have any questions or thoughts I enjoy interacting with you all in the comments!
Until next time