
TLT Trade Idea
PCE Heats Up, Long TLT Trade in Play: Macro Snapshot

Hey guys,
It’s been another one of those busy weeks.
Markets, updates, and a few in-person conferences as well— nevertheless I made sure to get this report across on time.
We’ll be going into the recent PCE data, the rising liquidity concerns and how that plays well into our long TLT trade idea.
Before we do that, let’s run through our macro snapshot, thought of the week and chart of the week.
Enjoy ;)
The Macro Snapshot
It’s already on everyone’s mind so I’ll just say it…
More of this PCE data and we’ll be having conversations about the potential return of the Fed hike— we’re not yet there, but a consistent flurry of hot CPI print will eventually raise this question at future FOMC press conferences.
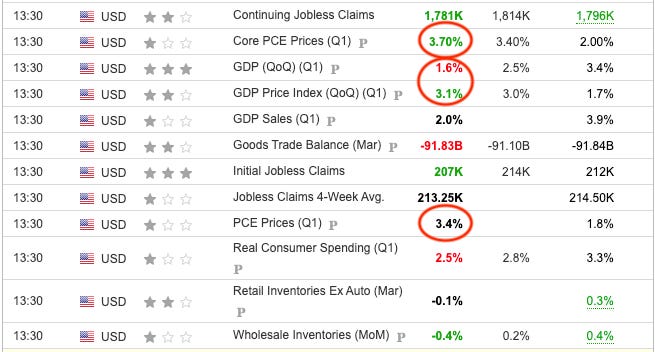
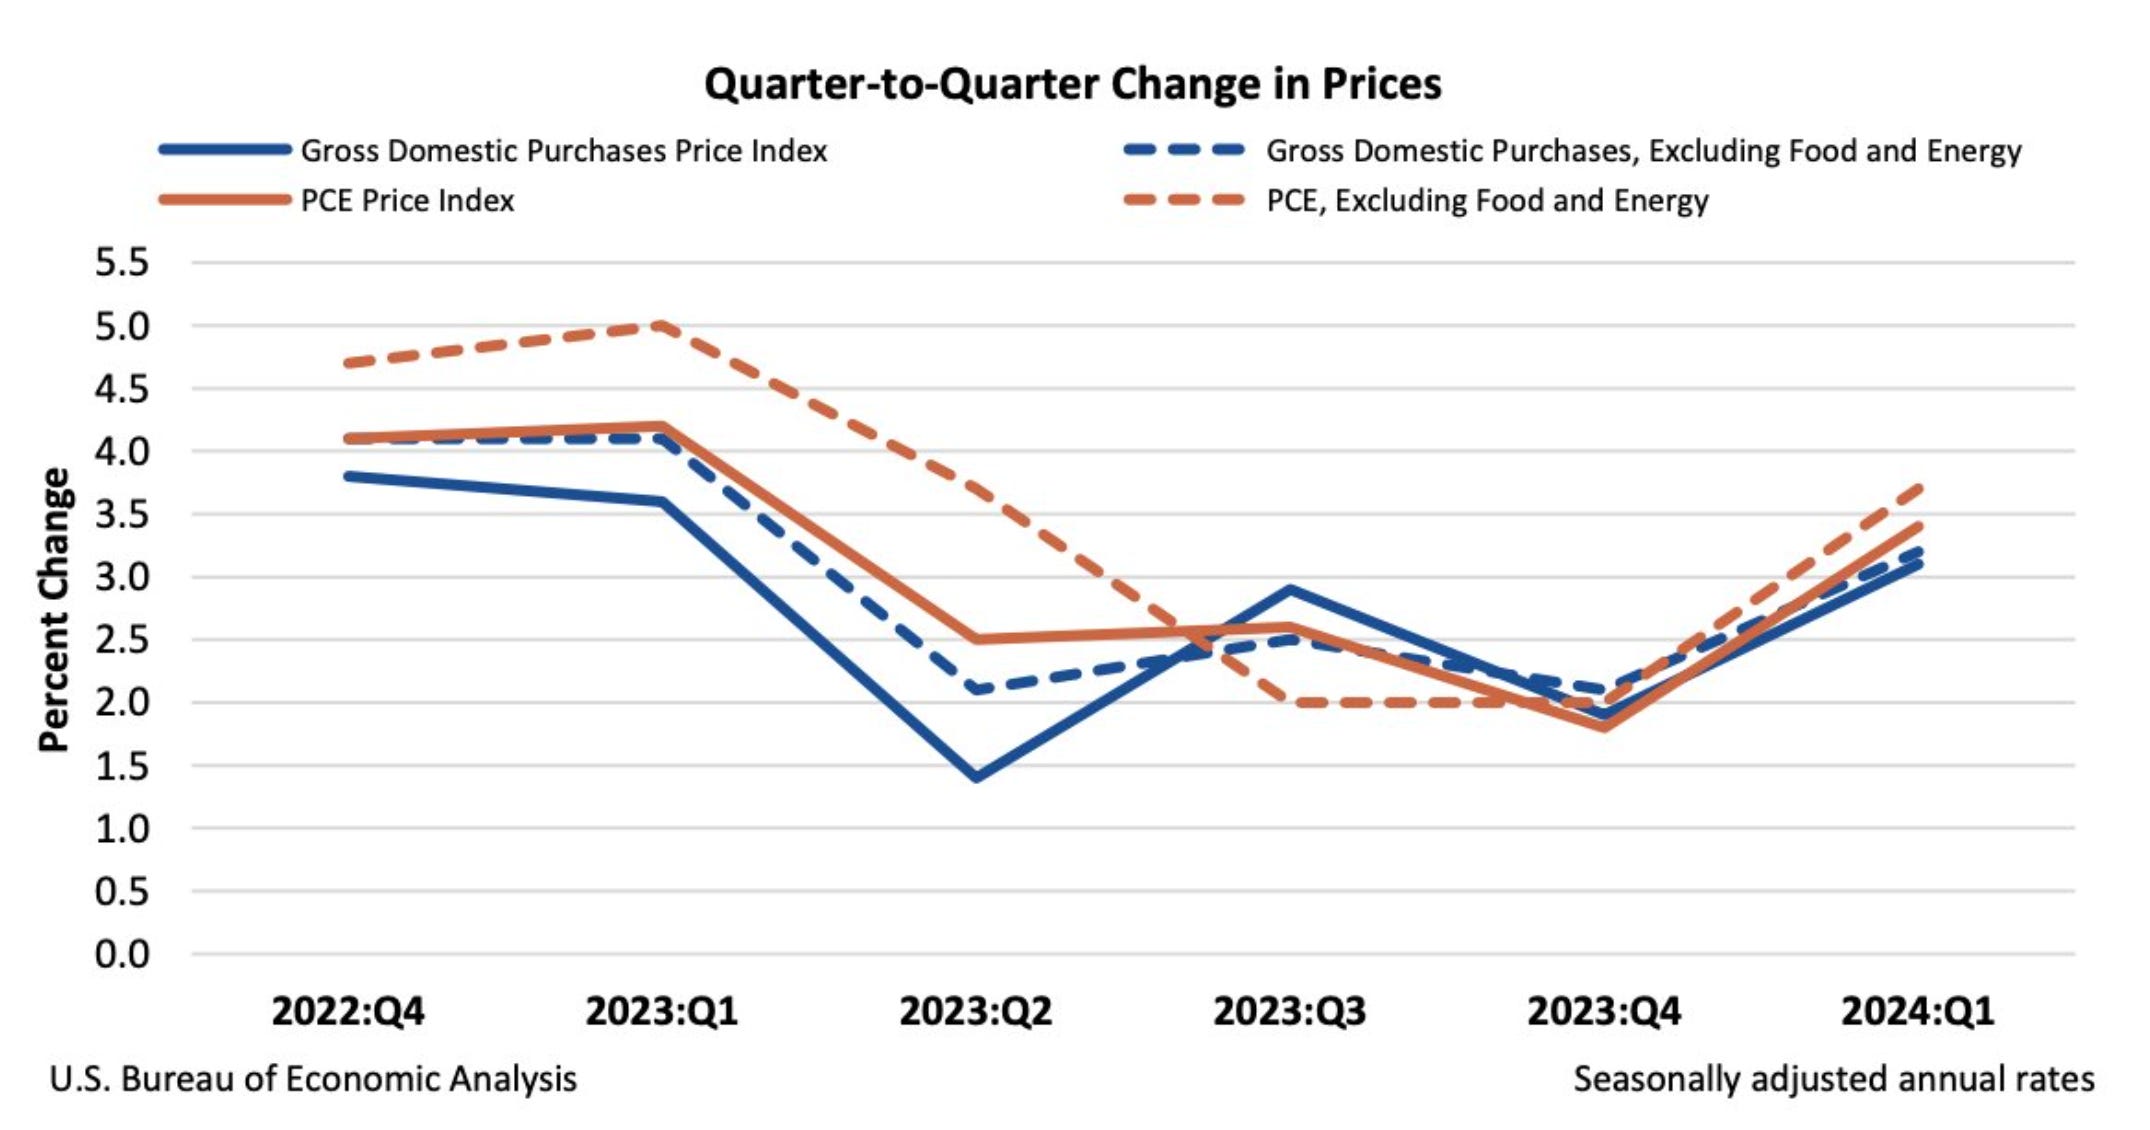
Highly anticipated GDP & PCE data for Q1 was released this afternoon and it’s safe to say that markets weren’t too pleased with the print. Core PCE rose 3.70% in Q1 vs forecasts of 3.40%, whilst GDP slowed to 1.6% vs 2.5% expected. This was the slowest pace of growth in 2 years, on the other hand, PCE inflation accelerated back to Q2 ’23 levels.
Market’s result?
Sell-off across bonds (bearish rates), equities and a firm reaction in Fed cut expectations which we’ll touch upon below.
Thought of the Week
A tapering in the Fed balance sheet runoff means one thing.
Reduced selling pressure on rates resulting in a yield compression (lower rates), that presents strong treasury opportunities, particularly on the 2s and 10s. Rates on the 2s are yielding 4.995% whilst 10s are at 4.70%.
Post-PCE rates have experienced further selling pressure, this improves the overall risk/reward balance of a short treasury position.
Chart of the Week
Financial Flow of the April Tax Week
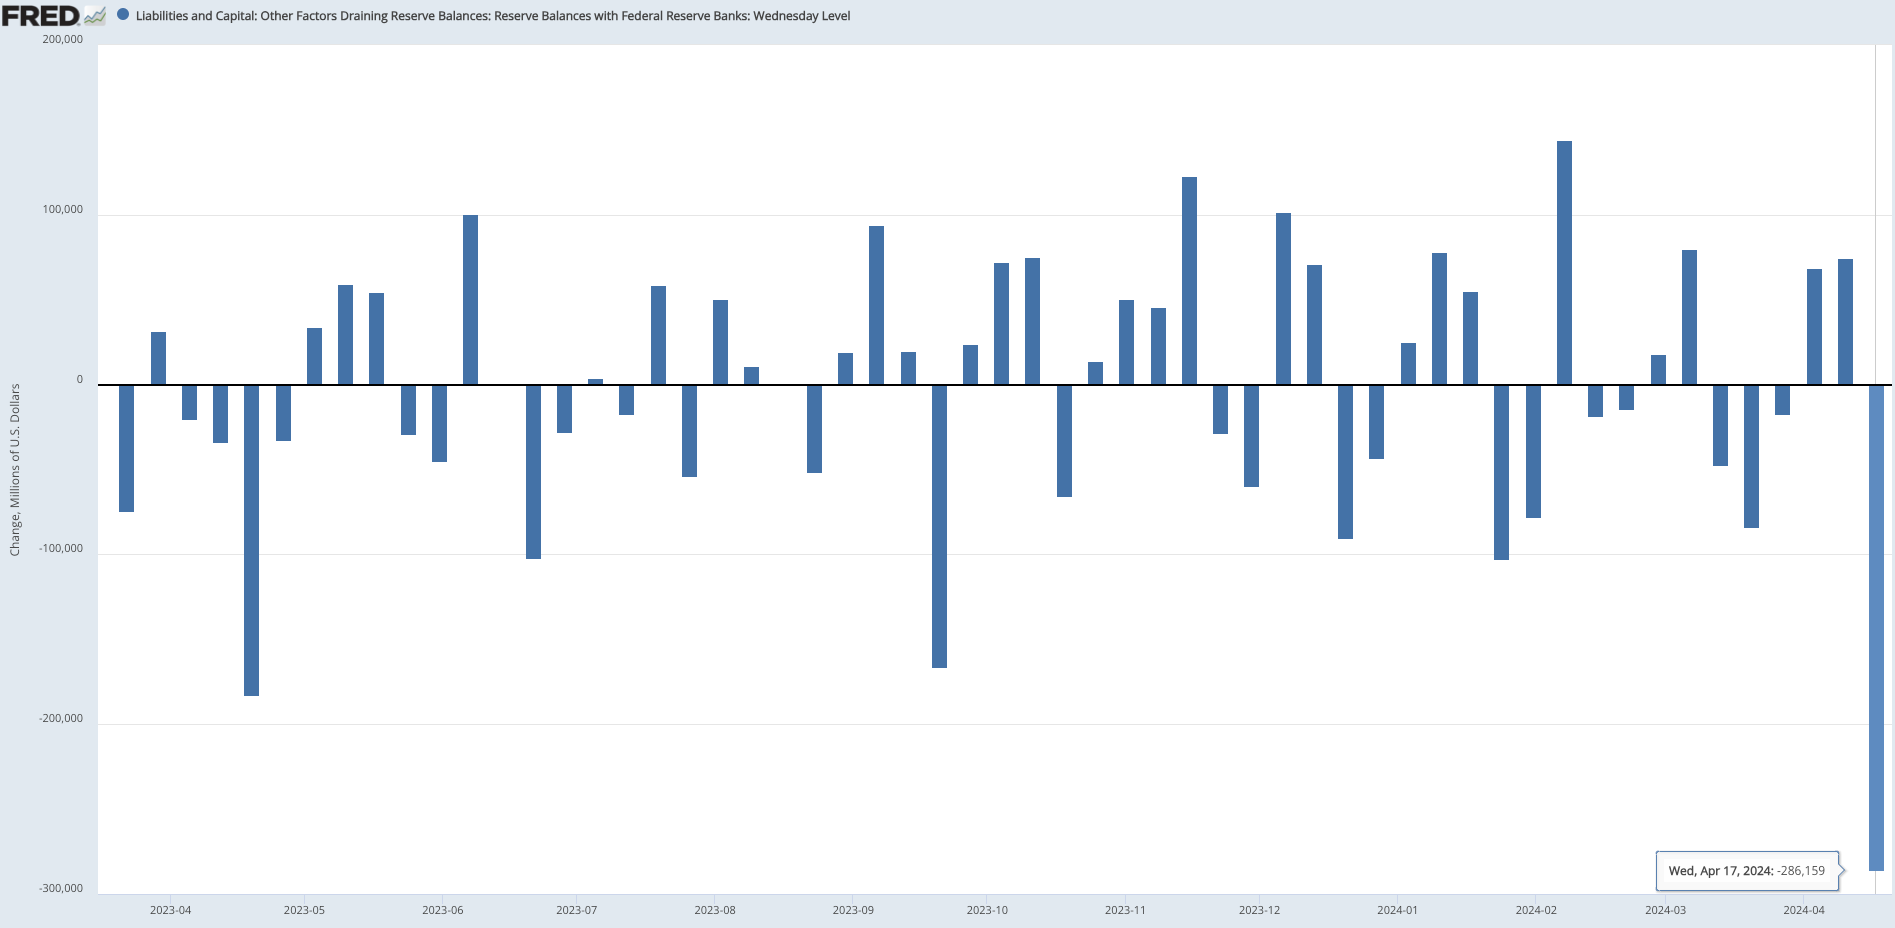
Last week was tax week in the U.S— and roughly $300b in reserves left the banking system as taxpayers made tax payments to the Treasury, which resulted in a boost in the TGA (Treasury General Account) which if you’re unaware, is basically the bank account for the U.S government (seen below).
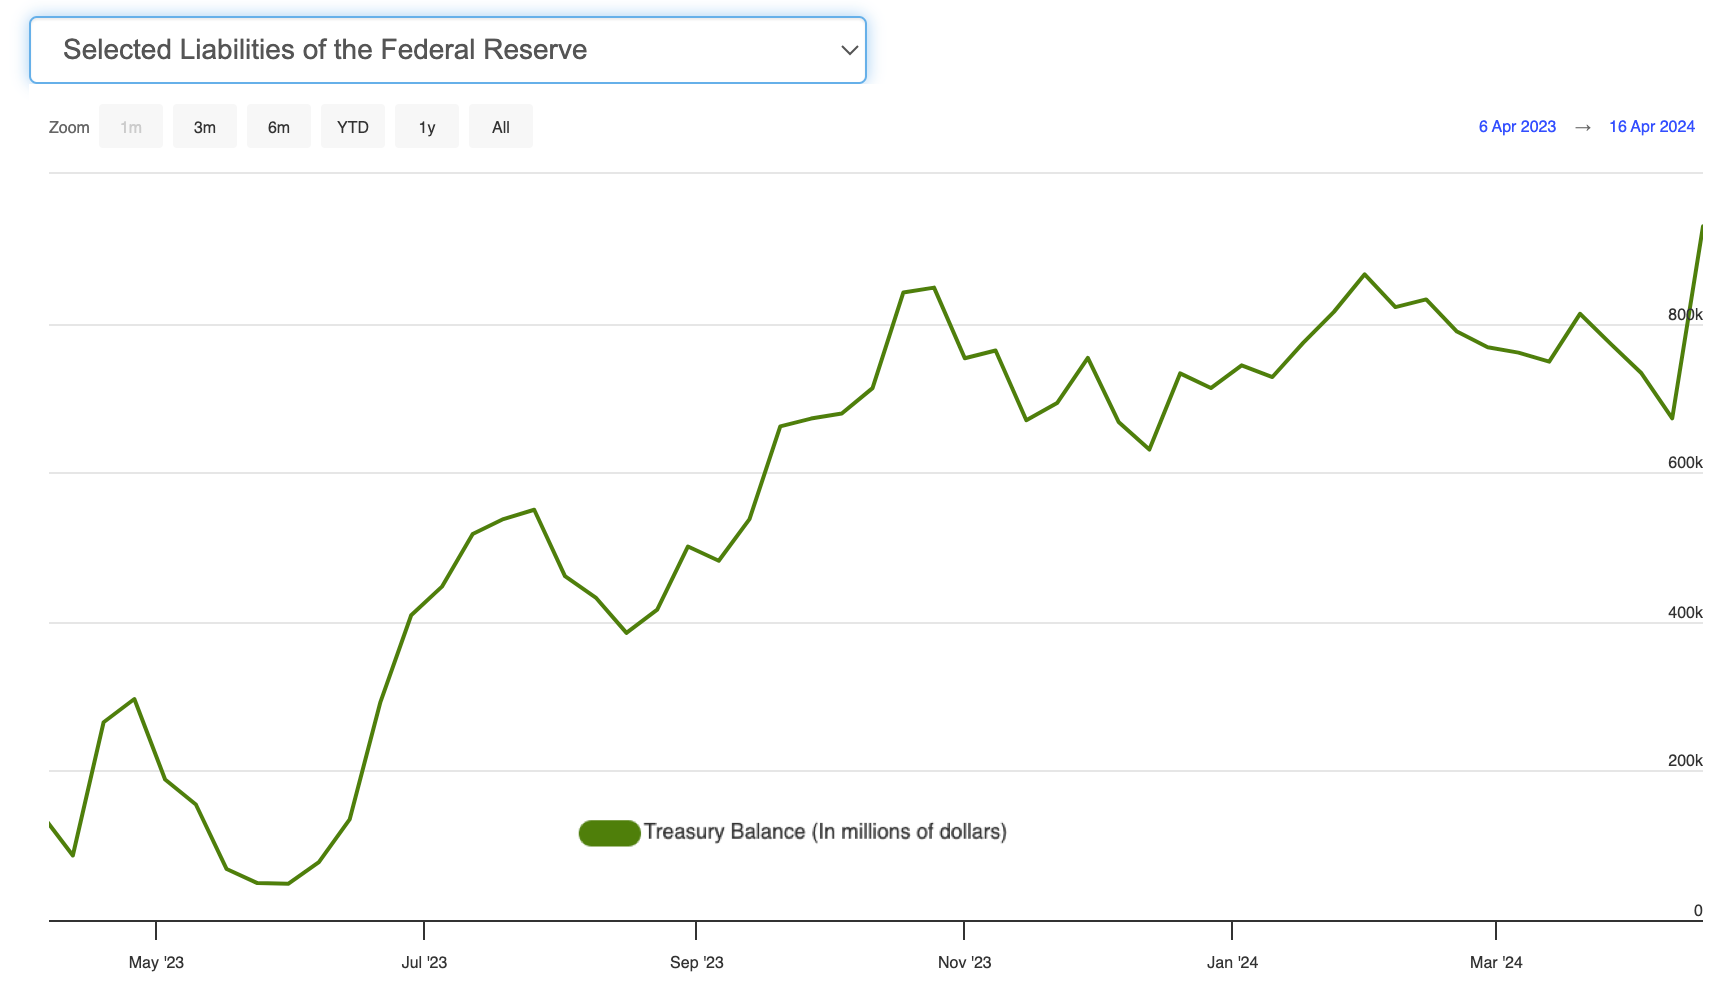
This shift in capital, although widely anticipated, can have vital impacts on financial markets. The main factor at risk here is liquidity.
Reduced liquidity has a number of implications, we’ll look at the two main channels:
Unwanted tightening of credit conditions: With lower reserve balances, banks instantly become more cautious about lending capital. This reservation is expressed through tighter interbank market credit conditions.
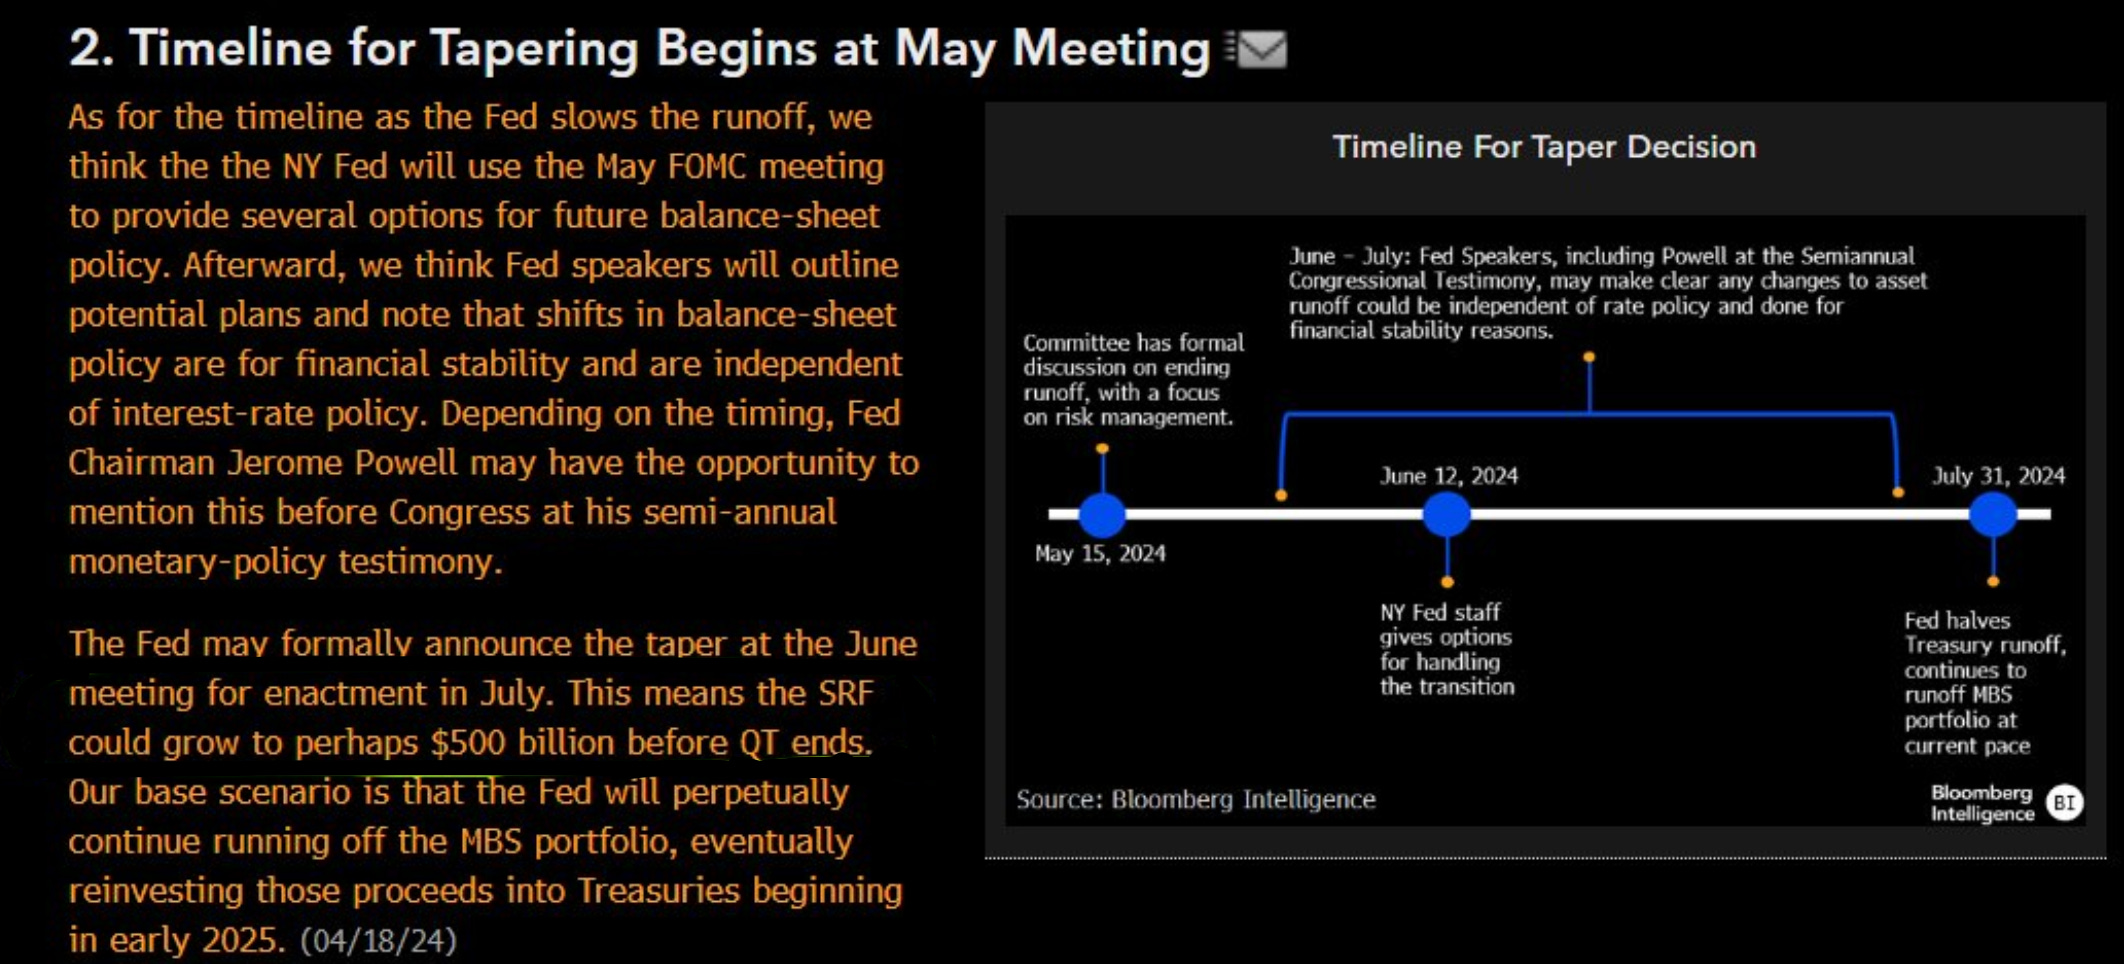
Repo operations: The Fed may look to utilise its repo operations (repurchase agreements) to temporarily provide reserves to banks, or instead of using this channel they may look to expedite the process of tapering their bond runoff program.
Long TLT Trade Idea
Time Horizon: 6 months
Rates have been bearish since the start of the year despite the dovish narrative of a Fed cut dominating mainstream media throughout the early part of January.
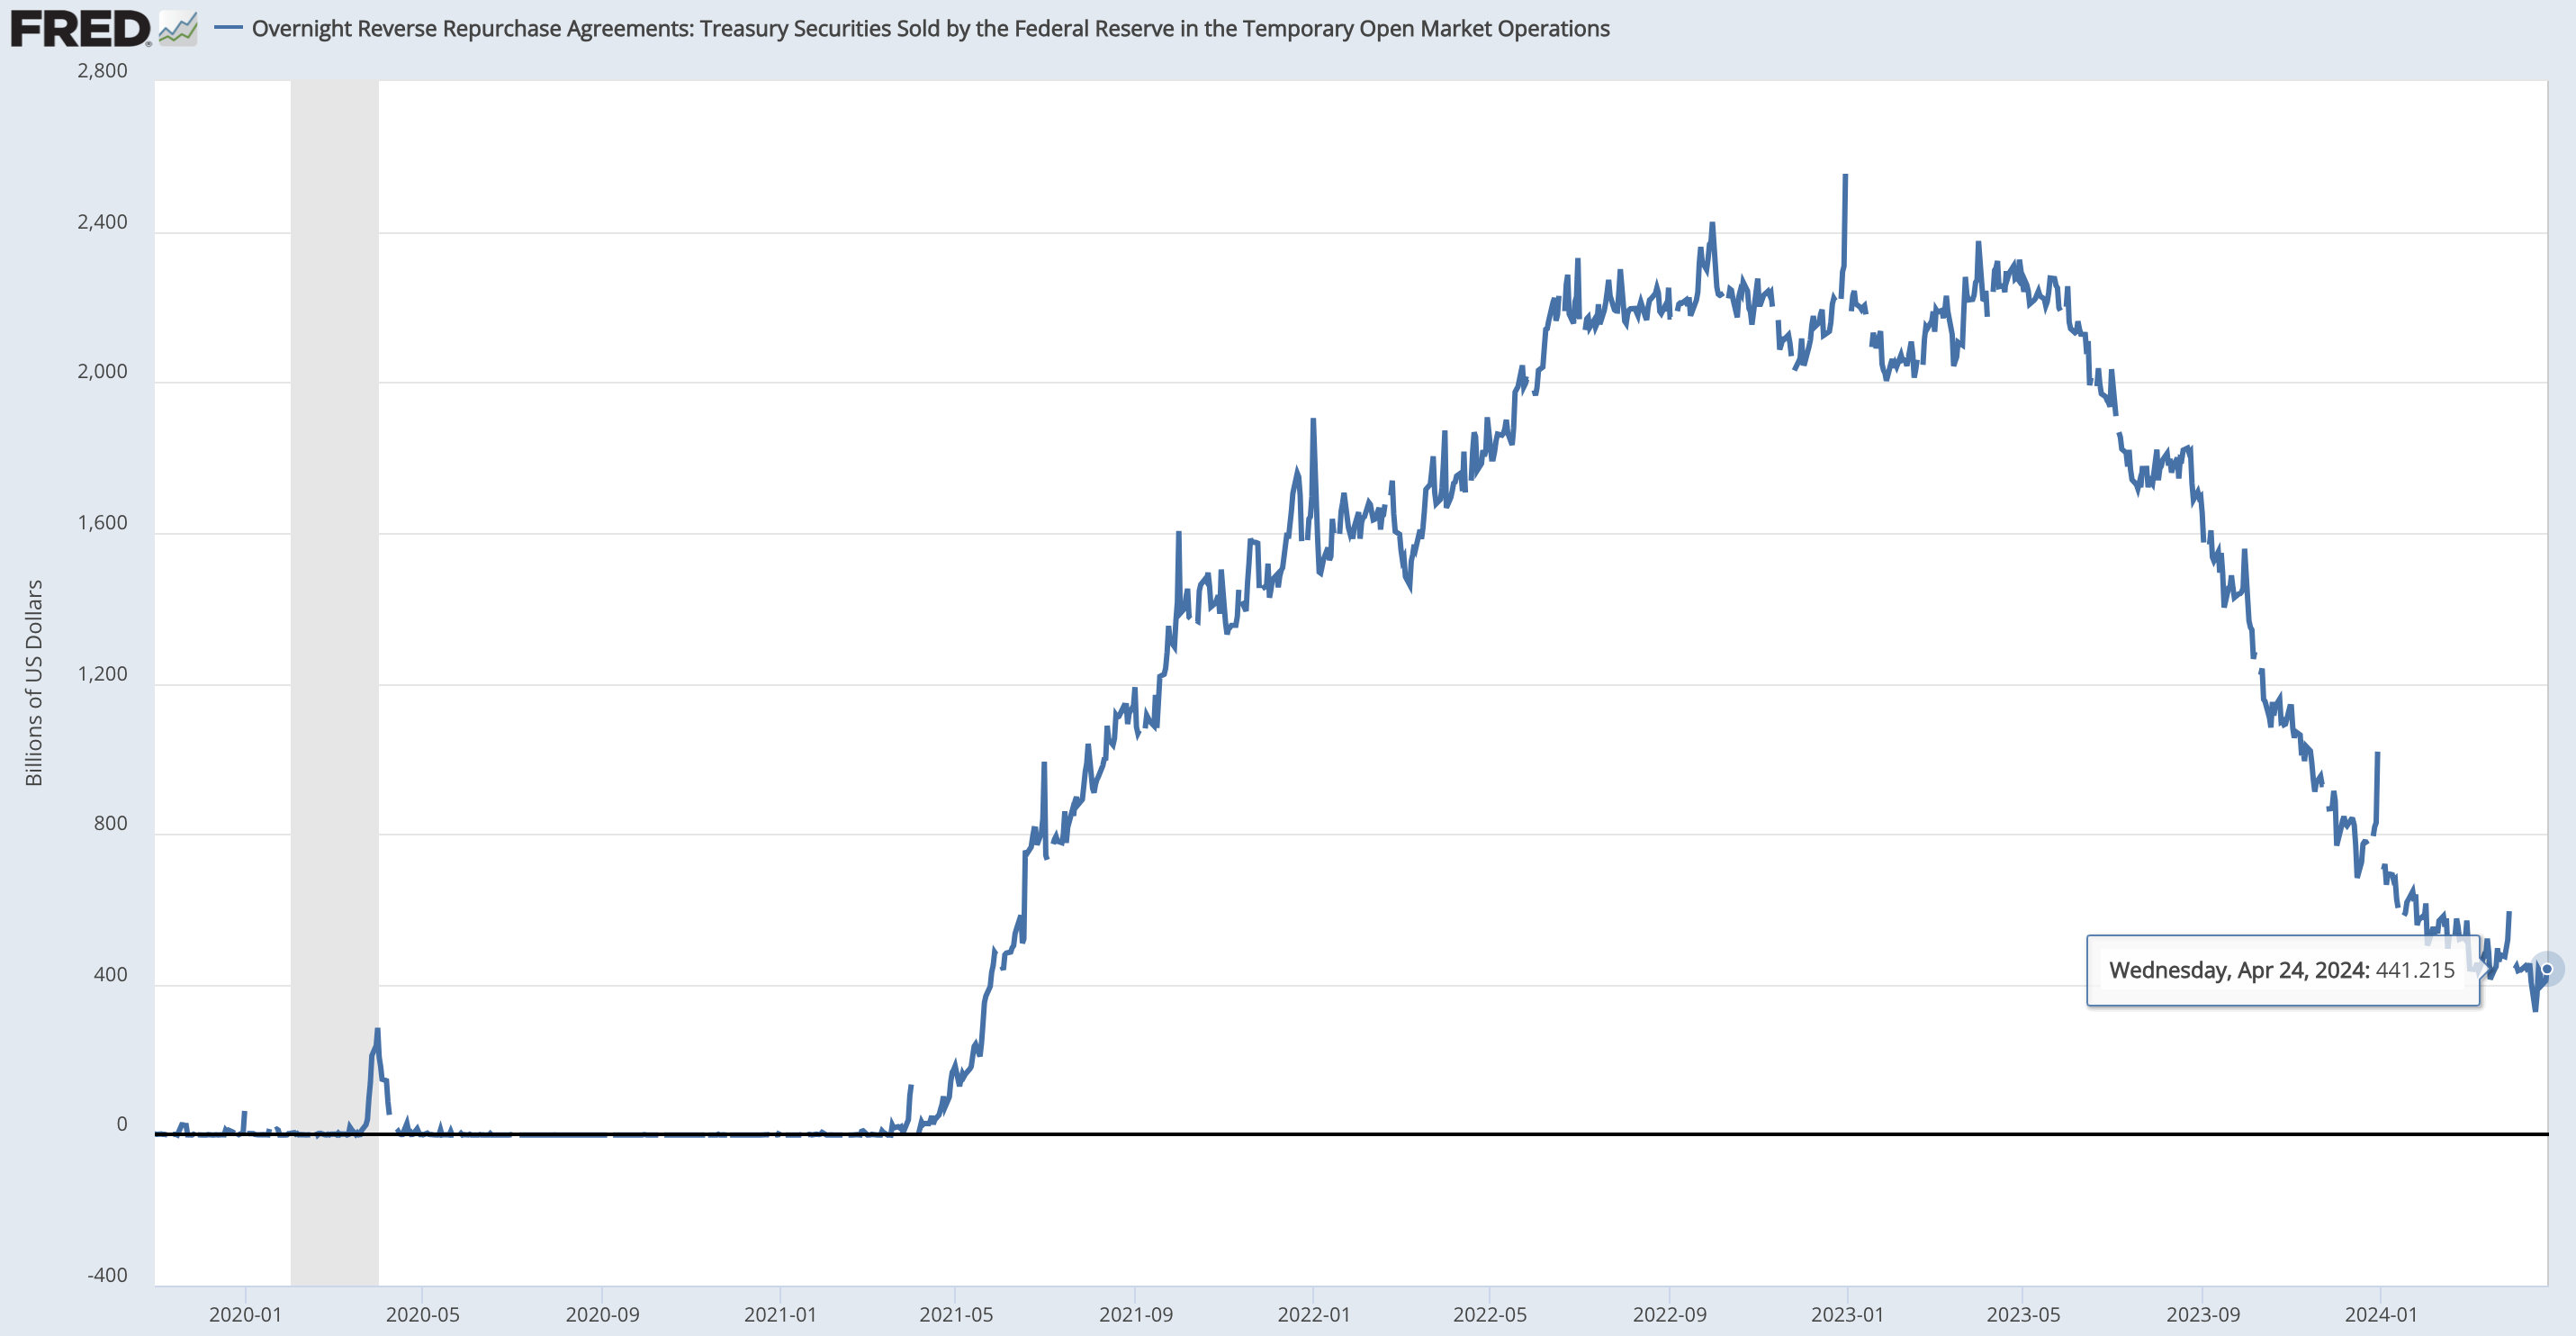
The Fed is set to announce a slowing of their QT, which has seen the RRP (reverse repurchase agreement) market decline from $2.2 T in April 2023, to roughly $400b in April 2024. This large reduction in the RRP raises the risk of a liquidity shock amongst banks and financial institutions which the Fed doesn’t need, especially within an election year which would further complicate things even more.
As a brief explanation, think of the RRP balance as a big bucket at the Fed. Banks and money market funds put their extra cash in this bucket overnight to earn interest.
Higher RRP = Higher amount of bank reserves
It’s often viewed as a proxy for bank reserves and liquidity in the financial system, helping the Fed guide its tightening process. A high RRP balance means there’s an excess of bank reserves parked at the Fed; conversely, a low and declining RRP balance tells us that bank reserves are being drained which has the risk of sparking some form of liquidity risk which we’ll get into below.
Wall St expect TLT reductions to slow to $30b per month (Deutsche Bank) from its current rate of $60b.
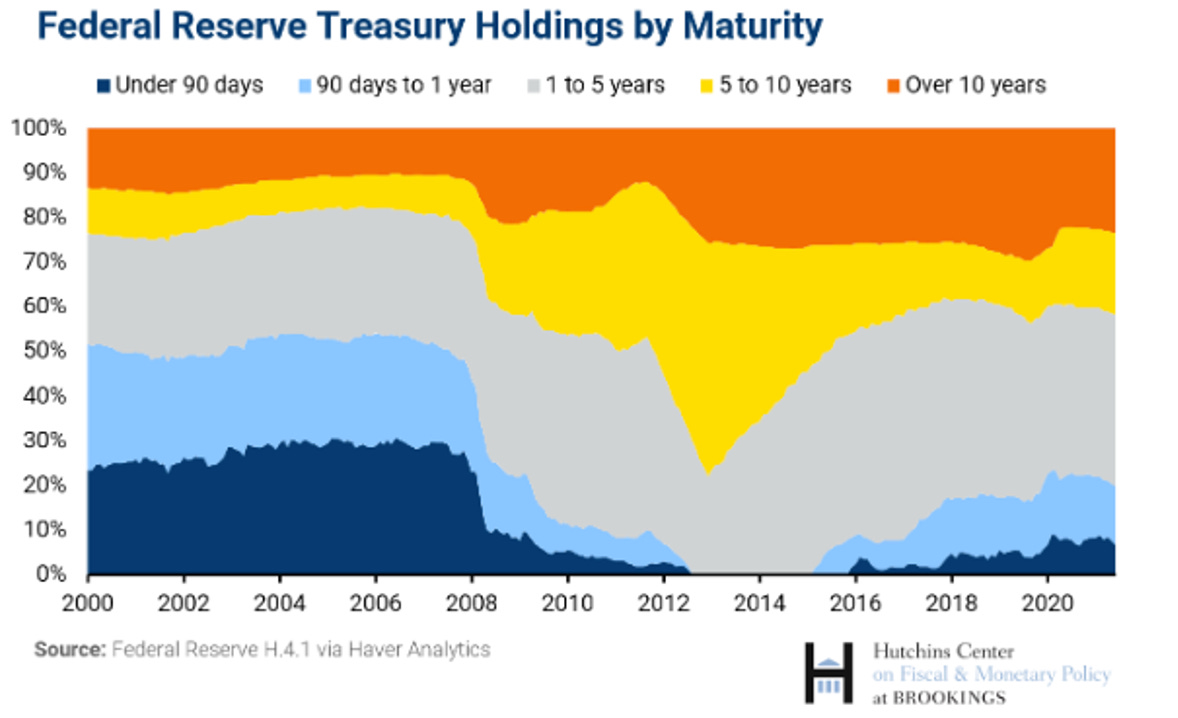
The Fed’s holding of Treasuries by maturities shows a large holding of bonds within the belly of the curve (~ 2 to 5/7 years), it would be these bonds in the belly of the curve along with 10s and potentially a lower amount of longer-term bonds that the Fed would reduce its pace of selling to mitigate the risk of said financial and liquidity crisis amongst banks.
By the Fed slowing down the rate of bond selling, we can expect to see a compression in yields and greater bids in bonds resulting in bullish rates (lower yields). Good for our trade. As discussed in a previous research report, if we’re long bonds, we’re long positive convexity, meaning the ∆ (delta/change) of our trade would result in greater monetary upside per basis point movement than downside.
The Federal Reserve has implemented a policy of allowing up to $60bn per month in Treasuries and $35bn per month in mortgage-backed securities to expire without reinvesting the proceeds.
Jay Powell said this:
“The Fed is seeking to reduce the size of its holdings in a way that will ensure the financial system has enough liquidity for the Fed to retain firm control over the federal funds rate…and to allow for normal levels of volatility in money market rates”.
The last thing the Fed wants is a repeat of September 17th 2019 where rates went from 2% to +5% overnight.
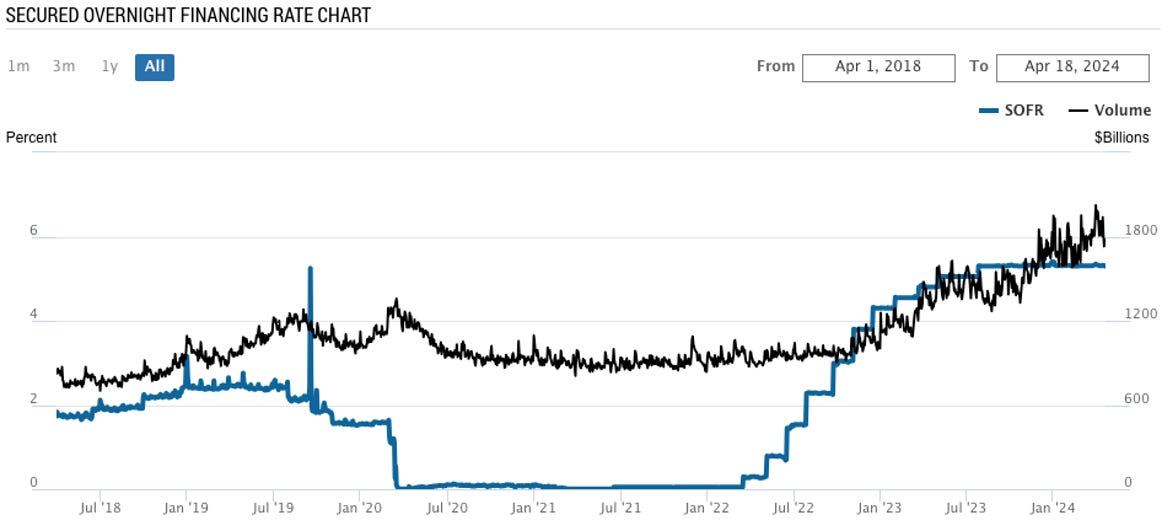
The blue line represents SOFR rates, which in layman’s terms, is the cost of collateralised borrowing. In September 2019, the overnight SOFR rate spiked due to a layered failure, and lack of liquidity in financial markets.
Demand-Supply Mismatch:
September 16th coincided with a quarterly corporate tax deadline which, as discussed above, drains cash out of the banking system, reducing the amount of reserves available to banks to lend to each other.
At the same time, the U.S. Treasury issued a large amount of new Treasury securities, increasing the demand for cash to settle these transactions which ultimately put further pressure on available reserves. These events worked in cohesion, pushing SOFR rates up 300bps intraday. It's evident that the Federal Reserve recognizes the potential for chain risks that could arise from a decline in bank liquidity.
Energy & Rates
Brent crude oil and West Texas Intermediate (WTI) typically move in tandem with 10-year Treasury yields, exhibiting a positive correlation. This means higher crude prices often lead to higher inflation expectations, which in turn can prompt the Federal Reserve to raise interest rates. Anticipation of rising rates tends to push bond yields higher, resulting in bearish rates.
Recent Oil Price Movements and the Outlook
Brent crude recently climbed above $90 per barrel. Given the ongoing geopolitical tensions and lingering uncertainties, a medium-term view on energy prices is warranted. The prevailing consensus suggests that the war in the Middle East might lose prominence in the coming months. This could alleviate the geopolitical risk premium currently baked into oil prices, potentially mitigating upward inflationary pressures.
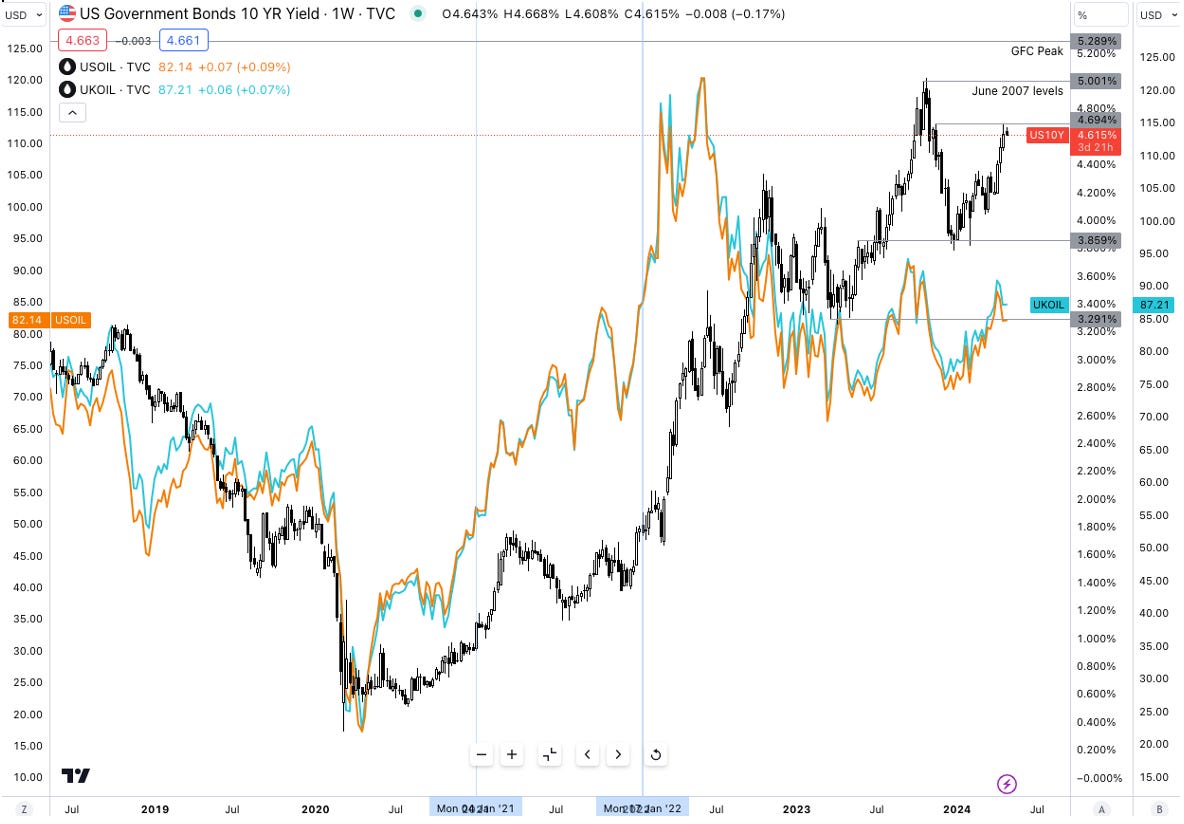
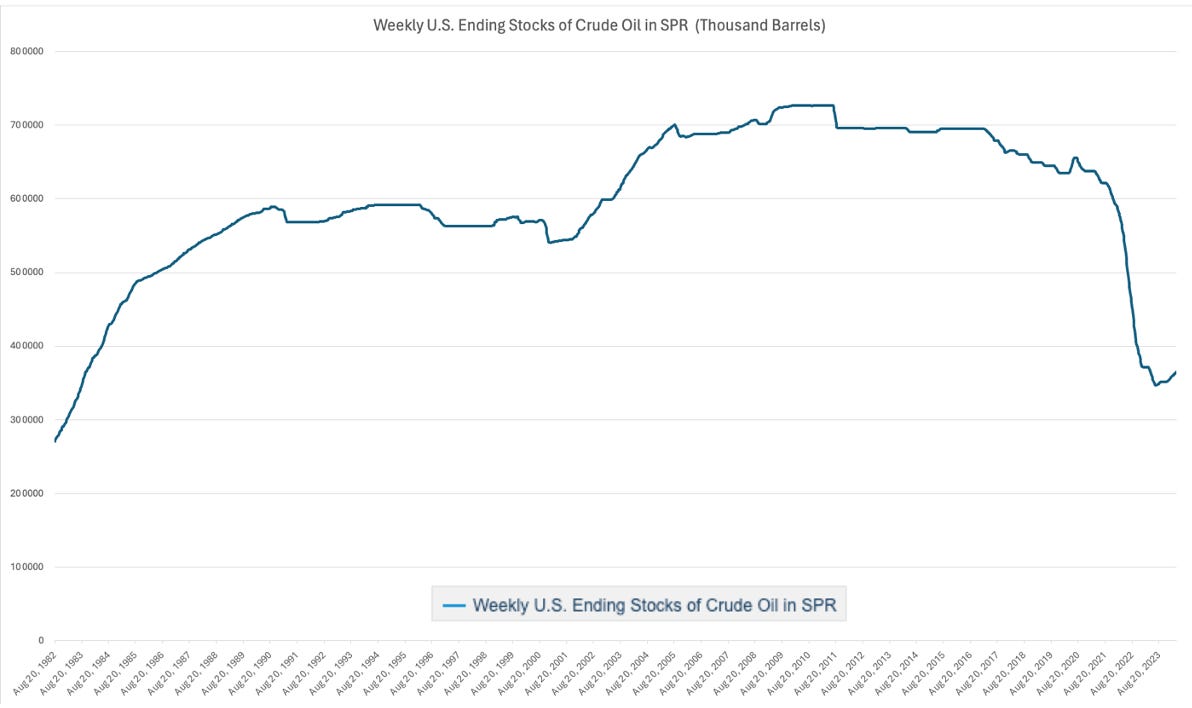
Further incentives for lower energy prices over the medium term lie within Washington. The Biden administration has drawn down the SPR (Strategic Petroleum Reserve) to a 40-year low, aiming to stabilise oil markets—helping ease a lot of the energy crisis the majority of Europe was facing. The administration plans to purchase and replenish its SPR, buying oil at $79 p/b or less, with current WTI prices sitting at $83 we have additional reason to believe the U.S will continue to flood supply to help the administration restock the SPR at it’s desired price. The final result, is lower treasury yields as we nullify energy inflationary risks.
Fed Fund Futures (Explained)
Today’s PCE figure added some difficulty to the long TLT trade, yet I remain optimistic about the trade opportunity.
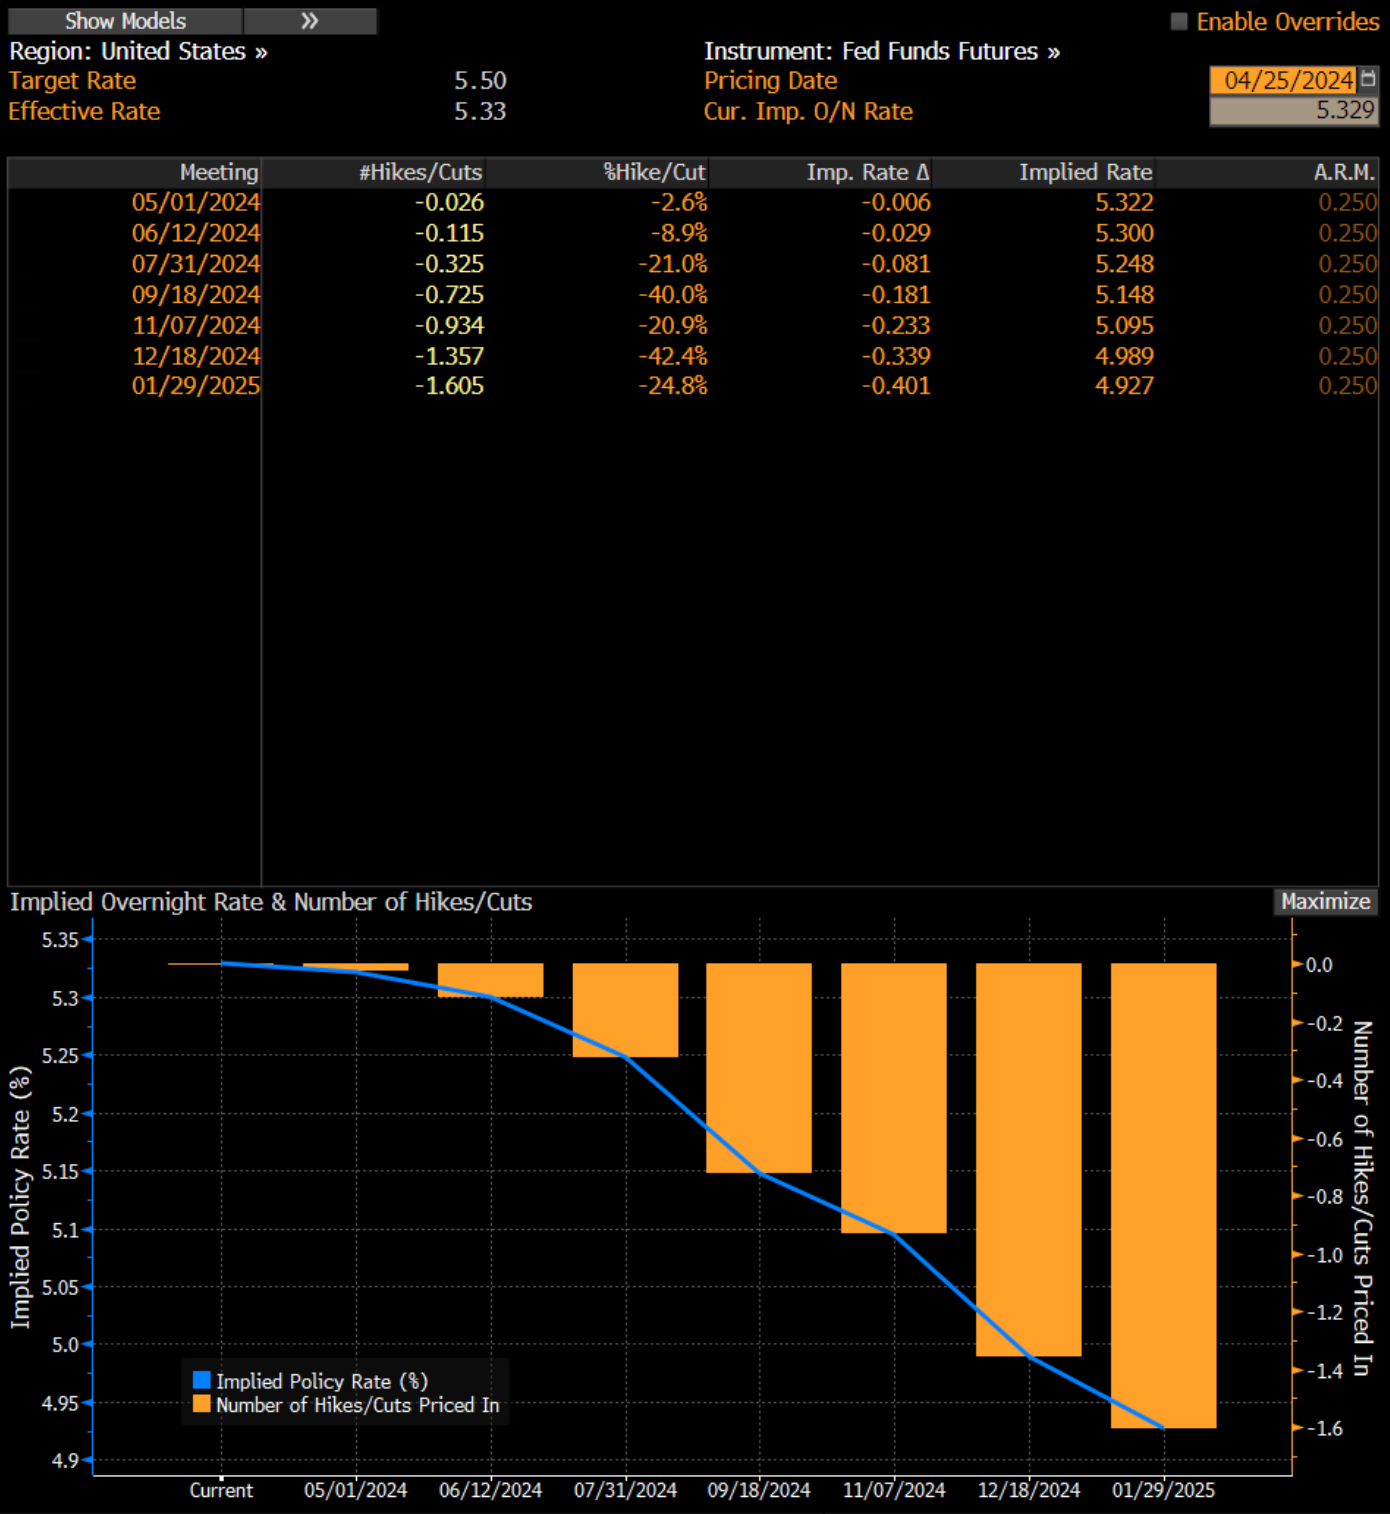
Let’s break down what we see above.
First and foremost, the market only sees one rate cut in 2024. Take a look at the #Hikes/Cuts column, this tells us the number of hikes/cuts expected and implied by the market.
The Imp. Rate ∆ simply tells us, what change in overnight rates ( fed funds) the market is expecting based on market pricing for each meeting.
So, based on the implied overnight rate curve, we can see the market is implying there will only be one rate cut by this year, with the implied policy rate expected to be 4.99%.
How did we get this figure?
You subtract the current Imp. O/N Rate from the Imp. Rate ∆ for the meeting date 12/18/2024:
Cur. Imp. O/N Rate - Imp. Rate ∆ (5.329 - 0.339 = 4.99%)Given that the Imp. O/N Rate is always lower than the Target rate (5.50%) this tells us that the Target rate will most likely sit around 5.25% by the year-end based on the current Fed Funds Futures pricing.
In conclusion, a Fed tapering of its quantitative tightening process will result in a bid for T-notes (~2y - 7/10y) suppressing yields. This is supported by elevated concerns about a liquidity crunch in the banking sector due to Tax Week and the forward expectation of lower inflationary pressures supported by lower gas and energy prices should result in bullish rates (lower yields) across the belly of the curve experiencing bullish rates. I'll be sure to share any updates on my trade execution and the evolving market outlook for this position
I hope this was another insightful read for you— as always if you could support my work by sharing this report with friends, colleagues and anyone who’d be interested, I would highly appreciate that.
Your support allows me to continue building a platform you can gain deep insights, trade ideas and quality lessons from.
Until next time