The U.S. Oil Market & Rate Cuts Historical Trends
Delving into the Outlook for Commodity Markets Amid Global Interest Rate Cuts
Hey guys,
We are pushing towards the end of the year fast, what can you do in these last months to really make a difference?
What is needed to bridge the gap between where you are VS where you want to be?
Anyway, central bank meetings are here and rates are moving bond markets.
As I always say, when there is volatility, there are opportunities.
Macro watch
Yes, it’s everywhere, but let’s discuss the elephant in the room.
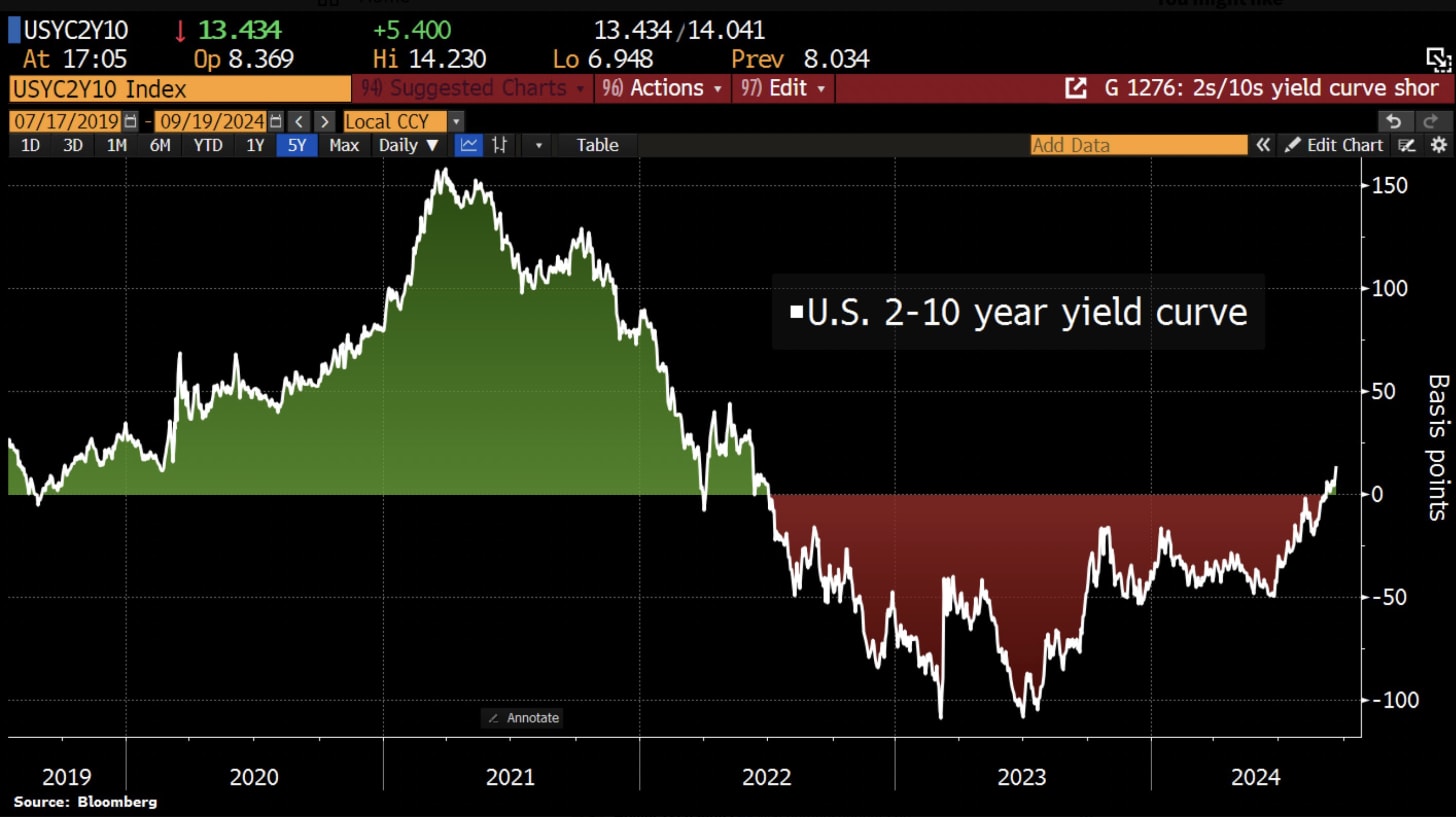
The Federal Reserve cut interest rates by 50bp in their meeting on Tuesday, which was c.63% priced into markets just moments before the meeting. Soft data made the rate cut fairly anticipated, pushing the 2s10s curve further into positive territory.
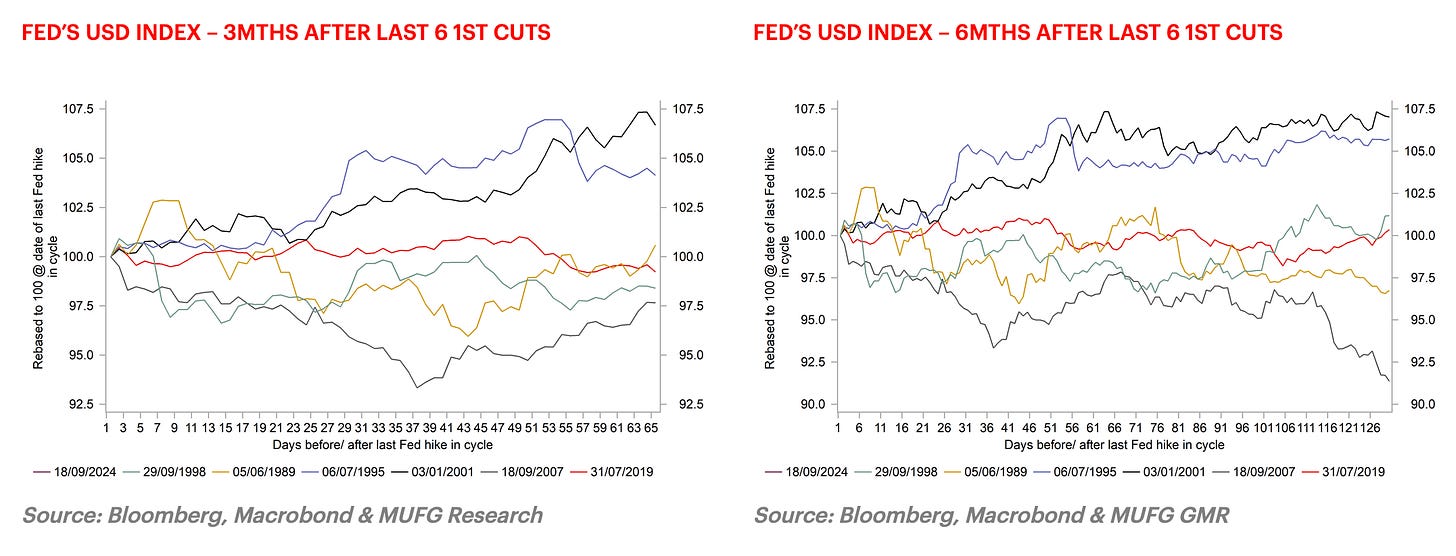
The two charts below illustrate the performance of the Fed's Advanced Economy USD Index over 3-month and 6-month periods after the initial rate cut in the last six Fed easing cycles. The Dollar's performance following the first rate cut has been mixed: in both the 3-month and 6-month intervals, the Dollar strengthened twice, remained nearly unchanged twice, and weakened twice. The reason for different outcomes is because of the different economic conditions that rates were cut in.
The Dollar saw its strongest performance over both the 3-month and 6-month periods following the first rate cuts in 1995 and 2001. Of these, 1995 stands out as the clearest example of the Fed successfully achieving a soft landing for the economy. After raising rates from 3.00% to 6.00% between February 1994 and February 1995, the FOMC quickly reversed course, implementing the first rate cut in July 1995. Two additional cuts followed, and after sluggish growth in the first half of 1995, the economy rebounded. Despite the cuts, the Fed funds rate remained relatively high, bottoming out at 5.25%.
The 2001 case was less successful than 1995 in achieving a soft landing, as the economy contracted in both Q1 and Q3 of 2001, with annual GDP growth in Q4 reaching just 0.2%. The National Bureau of Economic Research, which designates official recessions, identified the recession lasting from April to November 2001. However, it was relatively mild and ironically ended by the events of 9/11, as then-President George Bush introduced tax cuts to support the US consumer. The Fed responded with aggressive rate cuts, reducing rates by 50bp on the first five occasions, bringing the fed funds rate down from 6.00% to 1.75% by the end of the year. The economy was also struggling due to the bursting of the IT bubble the previous year. Despite these challenges, the Dollar appreciated by 7% in the first 3 months and maintained that gain over 6 months. In contrast, the ECB took a more conservative approach, cutting rates by 175 basis points between April and November. Despite the IT bubble's collapse, strong foreign demand for US securities in 2000 and 2001—up until 9/11—helped support the Dollar, along with post-9/11 USD-buying interventions by Japanese authorities to strengthen the yen.
The worst dollar performance period in both the 3 month and 6 month was in 2007 going into the GFC. The Fed cut rates by 50bp on 18th September that year which was followed by two 25bp cuts. The strains in the financial markets were emerging but in hindsight the Fed moved too slowly. On this occasion we had a clearer divergence with Europe with the ECB keeping the policy rate steady at 4.00% (after hiking from 2.00% in 18 months) from June 2007 through to July 2008 when incredibly the ECB hikes rates again to 4.25%. This helped drive the Dollar weaker by 2.5% over 3 months and by 8.5% over 6 months.
The distinction between a soft and hard landing is crucial in determining the Dollar's performance following the first Fed rate cut, with the actions of other central banks playing a significant role as well. Our current outlook assumes a continued economic slowdown, possibly leading to a mild recession, with the fed funds rate projected to fall to 3.00%-3.25% by mid-2025. This implies an additional 175bp of cuts, with another 50 basis points expected this year and 125 basis points by June next year. Even with these cuts, the Fed's monetary policy would remain somewhat restrictive.
No two economic or monetary policy cycles are the same but the message from past cycles is that there is no obvious pattern. The US presidential election is one distinct difference and none of the above examples were cycles that commenced with 3 months/6 months of a presidential election.
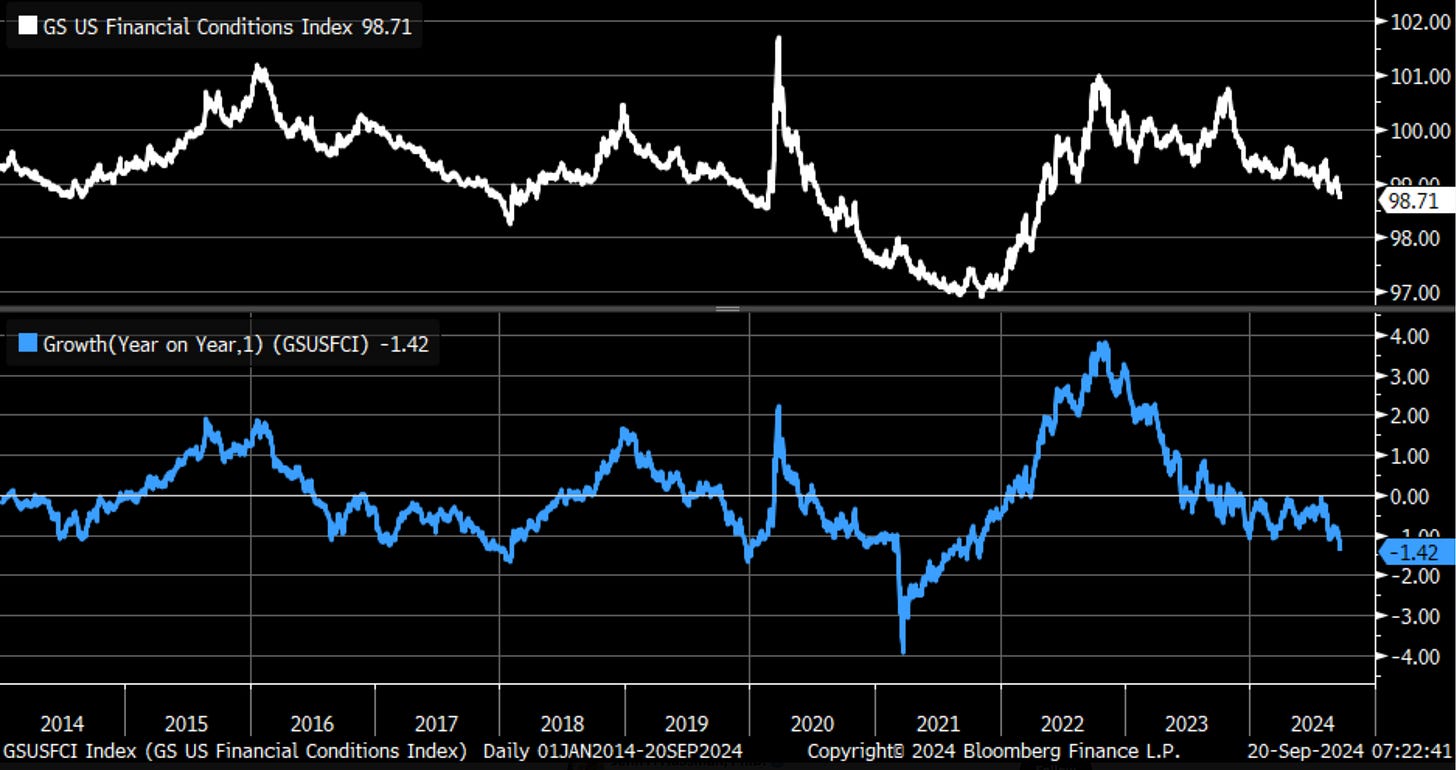
The chart below is a representation of how loose financial conditions are at current rates, which may be the reason behind a terminal rate for 3.00% (a lower rate would run the risk of conditions being too loose and potentially causing a bubble)
Market mover/Trade update
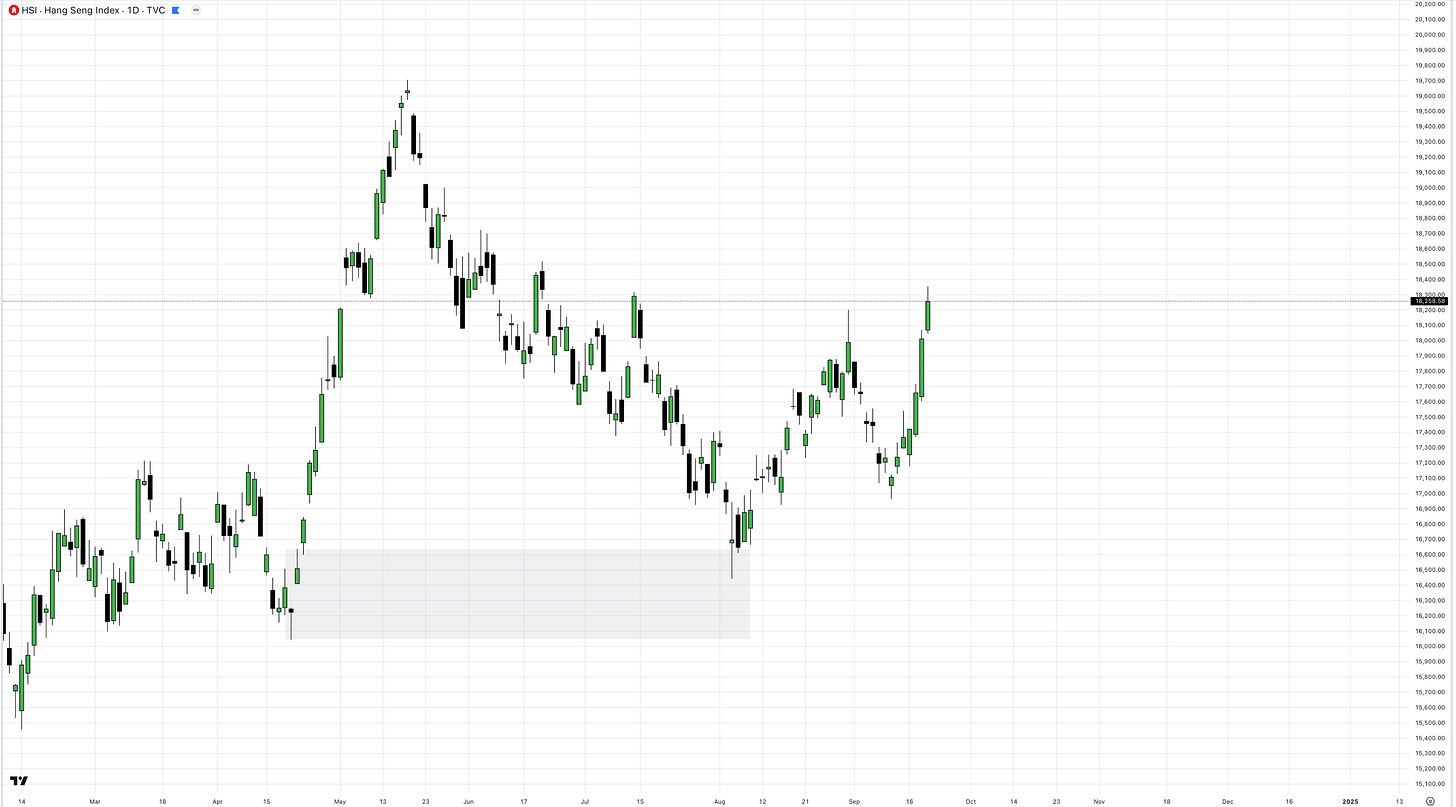
The Hang Seng Index (HSI) ran positive last week, up c.5.8%.
But I thought all was bad in China, you may ask?
There wasn’t actually any significant data during the week to really drive the move, the LPR rate was kept unchanged at 3.35% but I don’t believe this was the driving factor. The People’s Bank of China will tread carefully in lowering rates anytime soon, they may not want to promote consumer debt growth with lower rates. Also, Chinese banks rely heavily on net interest margins (the difference between loan rates and deposit rates) for profitability. Cutting the LPR further would compress these margins, reducing banks' income and potentially weakening the financial system.
Although this week has been filled with Chinese holidays, the driving factor for the HSI is most likely down to stimulus. Before the Golden Week holiday, there were signs that China’s central government might introduce more economic stimulus or supportive measures, such as cutting reserve requirements or lowering interest rates. Investors may have anticipated that after the holidays, these policies would be implemented, leading to an improved economic outlook for China.
Also, as Trump lost some favour in the US presidential election, Chinese equity investors may have seen this as a positive for the Hang Seng Index (because Trump will implement heavy tariffs on Chinese goods if we wins power).
I sent a trade on the Hang Seng Index in the report linked below, which is running c.9.7% in the green.
U.S. Oil outlook
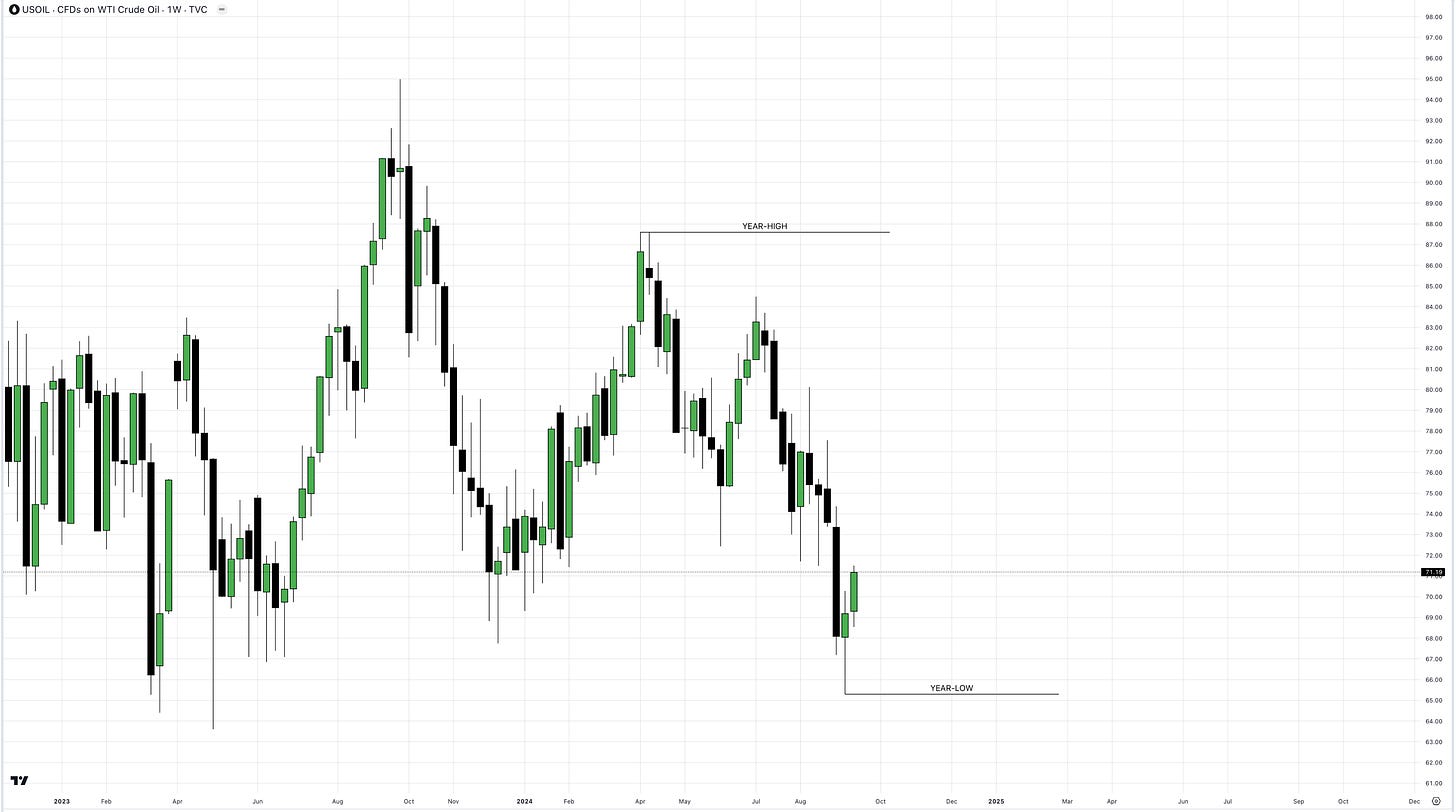
Oil prices are driven heavily by supply and demand dynamics, in very slight contrast to other assets that can be heavily influenced by global monetary policies. Of course, global monetary policies will have an impact on US oil prices, but not to the extent other markets may suffer.
Economic growth, which controls the supply and demand dynamics cause a direct impact on these oil prices. In the type of environment we’re in now, with global growth low and rates at their terminal levels, oil prices can be subdued. However, oil is also driven heavily by geopolitical factors, like the ongoing tensions in the Middle East and Russia-Ukraine war.
OPEC (Organisation of the Petroleum Exporting Countries), which consists of 13 member countries, make decisions which control the global supply of oil, like cutting or raising production. For ease, I’ve listed the countries below.
Algeria
Angola
Congo
Equatorial Guinea
Gabon
Iran
Iraq
Kuwait
Libya
Nigeria
Saudi Arabia (de facto leader of OPEC)
United Arab Emirates
Venezuela
Large growth shocks in Europe and China haven’t helped prices. The Euro area has drags from higher rates keeping growth subdued, China is also facing issues with growth but due to other reasons, which I have created a full report on:China's Economy
We all know growth is weak because of rates, so I won’t hover over that too much.
Although Saudi Arabia and OPEC+ have been cutting production to support higher prices, there are indications that global supply remains relatively balanced. The effectiveness of OPEC+ cuts is sometimes offset by higher production from non-OPEC countries, including the U.S. and other oil-producing nations like Brazil and Canada.
OPEC+ production cuts, on face value, limit the supply of oil circulating the economy, which is true, however, the real supply of oil doesn’t change. The cuts can be seen as a large stabiliser for US oil prices because the true supply (in reserves) of oil doesn’t change, but the amount distributed is reduced meaning there is actually more longer-term availability of physical oil. Some regions still have high levels of oil in storage, especially after periods of increased production or strategic reserve releases. These inventories act as a buffer, preventing prices from rising too quickly, even when OPEC+ cuts supply. As long as inventories remain sufficient to meet short-term demand, the supply reductions from OPEC+ may have a muted impact.
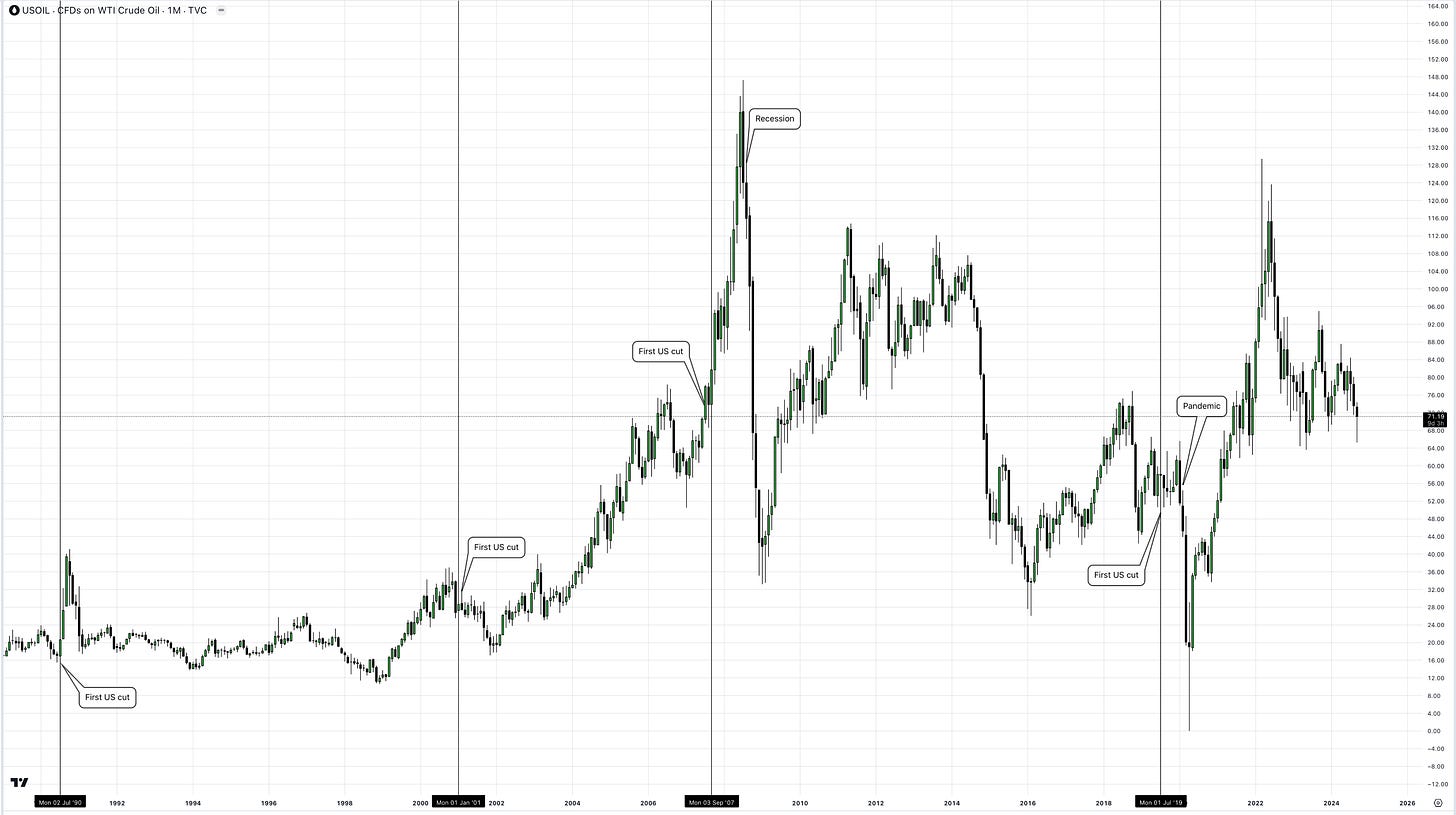
We’re moving into conditions where global rates are being cut, the relationship between oil prices and interest rates is indirect but significant, so the most accurate way to develop an outlook is to look at the history of oil prices when interest rate cutting cycles commenced. This commodity in particular is driven by such a large multitude of factors, so each historical trend can be slightly less significant if there was another reason for the move in oil prices.
As we see above, there is no evidence that a Fed cut directly lead to a particular trend. What I do notice is that the rate cutting cycle can spark something within the economy (recession or inflation/excessive liquidity), which can then create direct impact on oil prices. So, let’s draw up the conditions and potential conclusion below.
US Oil - Neutral/Bullish
Based on the current conditions, with the Federal reserve driving the trend of rate cuts, we can rely on the US to be the main country causing movements in oil prices. A soft landing is priced in at c.81% inside the US while a hard landing is c.11% and no landing is priced in around c.8% in the equities market. The likelihood of global growth slowing even more are low. GDP’s across the board in G10 countries has already seen the low, I believe. Countries such as the UK, who have already seen a technical recession, seem to have bottomed in data. Yes, there are definitely tail-risks to global demand such as the Eurozone not being able to recover (particularly Germany) and China’s stimulus once again not working. However, on a macro scale inflation is under control/stable, growth is moderate (weak in some, strong in others) and interest rate cuts will spark liquidity back into economy and ultimately bring higher demand.
That’s all for this week guys!


Very detailed explanation on what’s going on. Thanks
Cool and perfect! Thanks Alfie