
The Untold Cost of High Yields
High bond yields are great, but not when you're a foreign investor having to hedge against even higher short term rates.

Hey guys,
It’s Q4.
If there’s a time to lock in more than ever it’s now.
That’s it.
Nothing more to be said.
Go out this quarter knowing you gave it your all, that’s what I call a closer.
Treasury yields are soaring, and it’s not because of a strong US economy as much as we’d like to think, there’s selling pressure on every side, so I’ll uncover what’s going on and how this affects foreign investors.
The Great Treasury Surge
Within global capital markets, the bond market is responsible for ensuring adequate liquidity, stability and access to credit. Governments and corporations both issue bonds to raise capital through the bond market, financial institutions such as central banks, money market funds, pension funds and hedge funds all rely on bonds as collateral for short-term, usually overnight, collateralized loans referred to as repos.
The entire plumbing of the financial system revolves around the bond market.
Rewind 12 months ago and we were discussing the horrific delivery of the mini-budget which sent pension fund portfolios into uncrystalised losses after the Gilt market collapse due to the fiscal blunder Kwasi Kwarteng and Lizz Truss made. The contagion risk of a bond market collapse brought caution to the Treasury market which resulted in the inflection point we saw in October ‘22 which led to the equity bull market rally.
Now we’re seeing a bear steepening in the bond market as long-end yields rally faster than short-term rates due to the Fed’s recent revealings within their SEP material. That’s exactly what a bear steepener is when long-end rates (10Y, 20Y,30Y bonds) rise faster than short-term interest rates (<2Y).
Here’s a visual of how yields have moved over the past month.
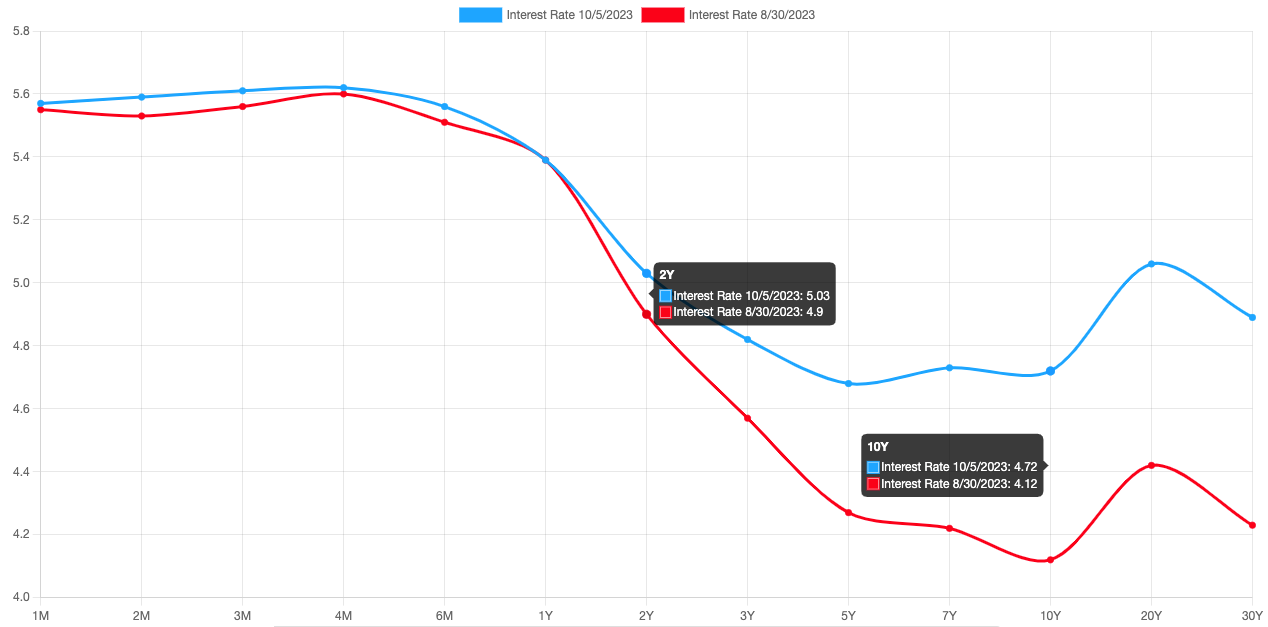
This line chart represents the US Treasury yield curve. As you can see, the x-axis shows the different maturities of each bond, and to gauge the shift in the yield curve we’ll focus on two different maturities, the 2s&10s since they represent the short and long end of the curve.
The red line represents the shape of the US yield curve at the start of September just a month ago, and the blue line is the yield curve as of yesterday. What can you see in short-end rates? Not much movement or steepening of yields, mainly due to the Fed coming to the end of the hiking cycle so additional rates aren’t being priced into the front end of the curve. On the other hand, when looking further out on the curve, the 10y, 20y and 30y there’s a huge spread between yields 1 month ago and today.
You’re probably wondering why. Here’s the breakdown.
When the Fed adjusts interest rates, it is important to consider which part of the yield curve is most affected. In most cases, it is the short end of the curve, which includes T-bills maturing in 3, 6, 12 months, and 2-year notes. However, it is also important to be aware of duration risk, which increases as the maturity of a bond increases.
Blackrock has a great infographic to show this.
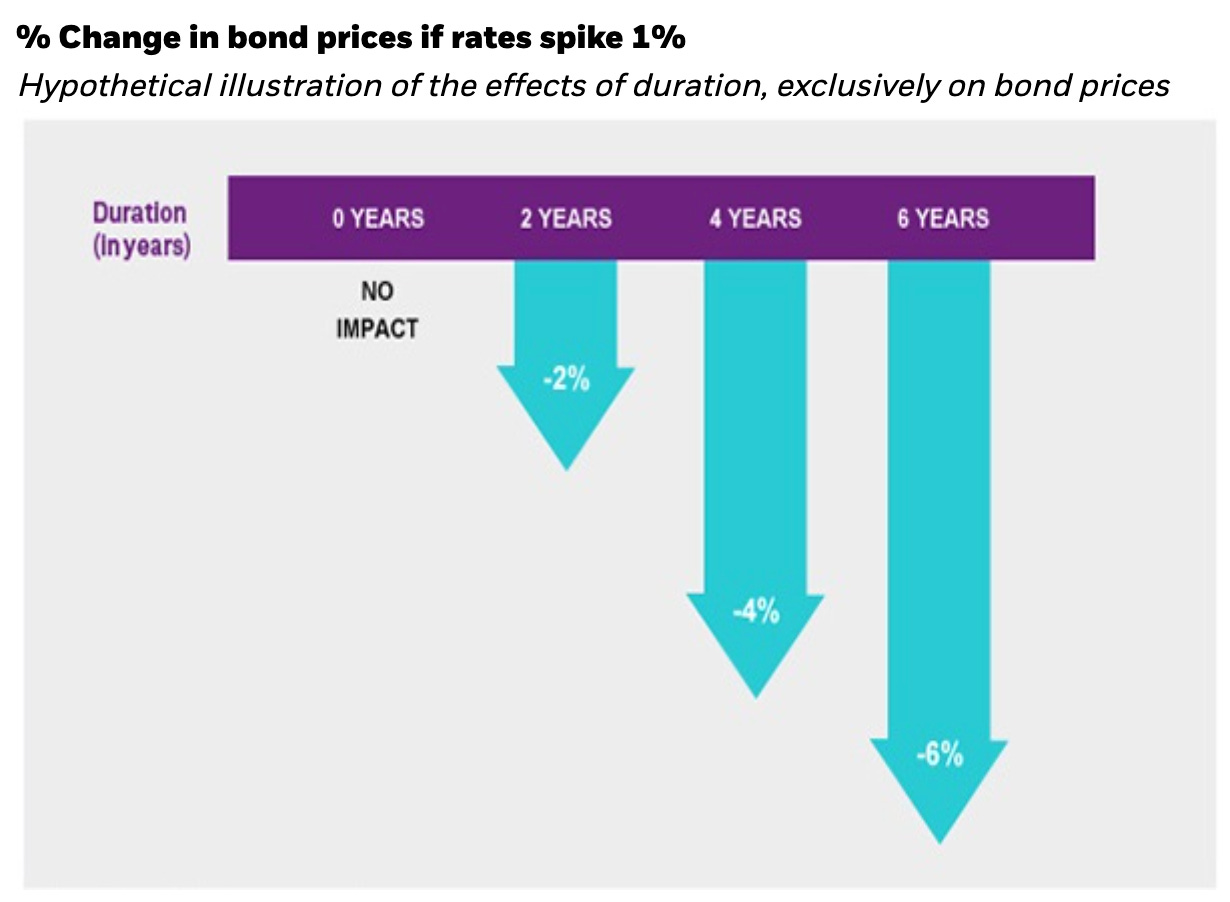
Over the past 18 months rates have increased 525 bps, for the short end, there’s almost no duration risk, but when you look out to the 20y & 30y treasury notes the duration risk is multiplied drastically.
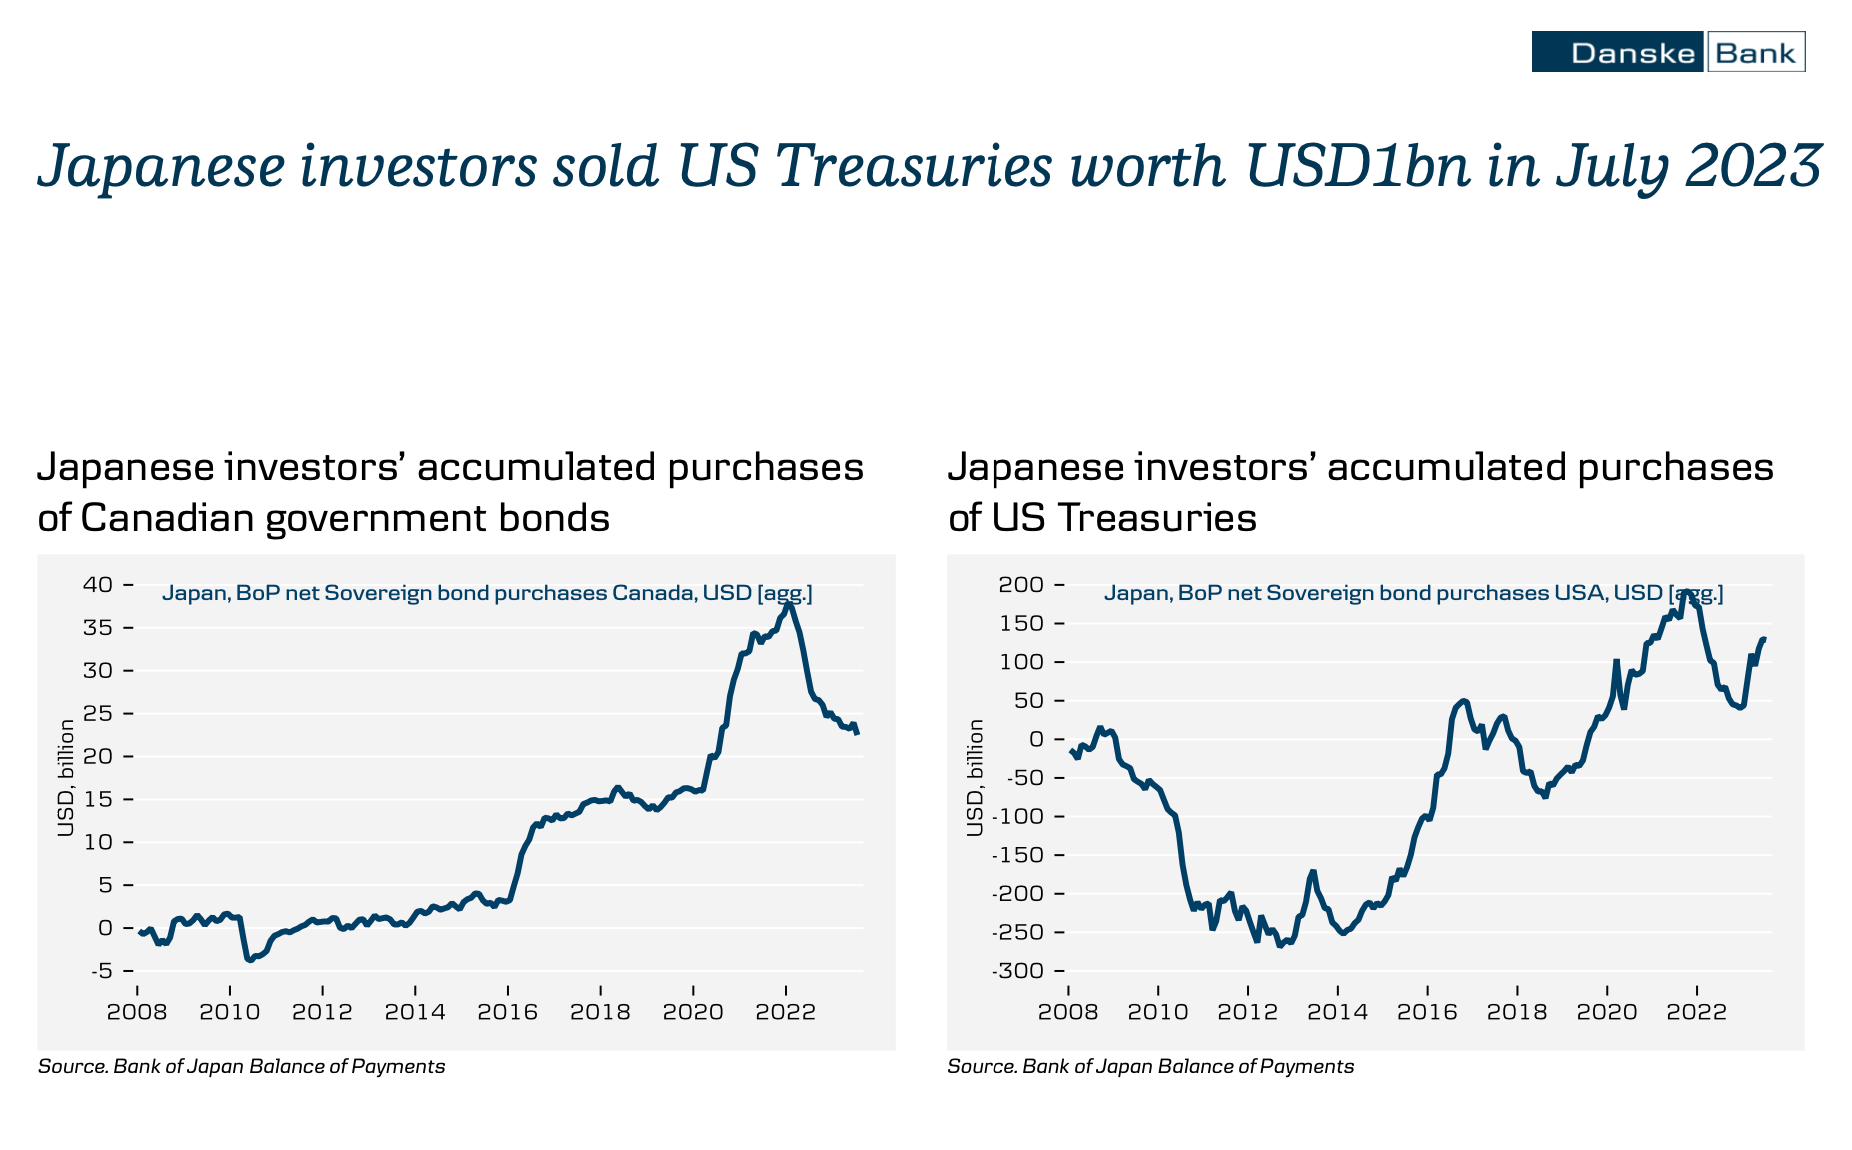
That explains why we’re seeing the longer end of the curve steepen significantly compared to the short end due to this one thing. The large issuance from the Treasury isn’t helping as there’s reduced demand for US debt paper; most notably Japanese investors sold $1bn worth of US Treasuries earlier in July according to Danske Bank, as yields on domestic JGBs continue to rally the compensation for domestic markets become more attractive once you compare the costs Japanese investors would have to pay for FX hedging costs when investing abroad.
FX hedging explained
If you’re not so familiar with the FX hedging costs involved here’s an insight. Cross-border bond purchases come with exchange rate risks. As the Fed has been raising rates, the dollar's appreciation against the yen and other currencies has increased the costs of hedging.
For example, Japanese investors, pension funds, and asset management firms must first convert yen to dollars to purchase Treasuries. They then must exchange their money back into yen when repatriating returns back to their country. During this process, Japanese investors typically hedge their risk by borrowing dollars at a fixed rate against the yen to protect their investment from dollar depreciation or appreciation.
Take note. The fixed rate that Japanese and other foreign investors must pay is determined by short-term borrowing costs (USD Libor) between the two currencies, known as the cross-currency swap rate. Without delving into the world of FX hedging, simply put, the Fed's front-end rate hikes have resulted in a yield inversion, making Treasuries less attractive to foreign investors, who are investing in longer-dated securities (10y, 20y etc) but are forced to hedge by borrowing at short-term rates, which are typically higher than long-end yields.
So, for a Japanese investor weighing up the costs of FX hedging to get into US treasuries vs domestic JGBs which are 0.80% the winner lies in domestic markets hence the retreat from treasuries.
This spiral of foreign investors retreating from US debt restarts the current cycle we’re seeing of increased bond selling resulting in higher yields for bonds and non-other than a bond bear market.
The truth is a hard reality.
There’s no ‘yield’ where investors all of a sudden say this is amazing and flood the bond market simultaneously restoring bond prices; the only thing that can bring flows to the debt market is further collapse in equities.
Thanks for reading until the end, it’s a bit later than usual but I had to get this report out to you regardless!
As always,
Until next time.
Thanks Joe !