
The Macro Maze: PCE, R* & Regime Shifts
Dissecting PCE, The r* update, and Regime Implications

Hey crew,
It feels good to be back.
I missed a report last week, a super intense week which I’ll fill you guys in on soon.
Nevertheless, markets have been relatively quiet this week leading up to today’s big PCE figure.
As always, the focus remains squarely on inflation. Signal, not noise.
Macro Snapshot
With markets so focused on the upcoming US inflation readings to signal when we may see the first Fed cut asset markets are going to become increasingly sensitive/volatile to upcoming inflation prints.
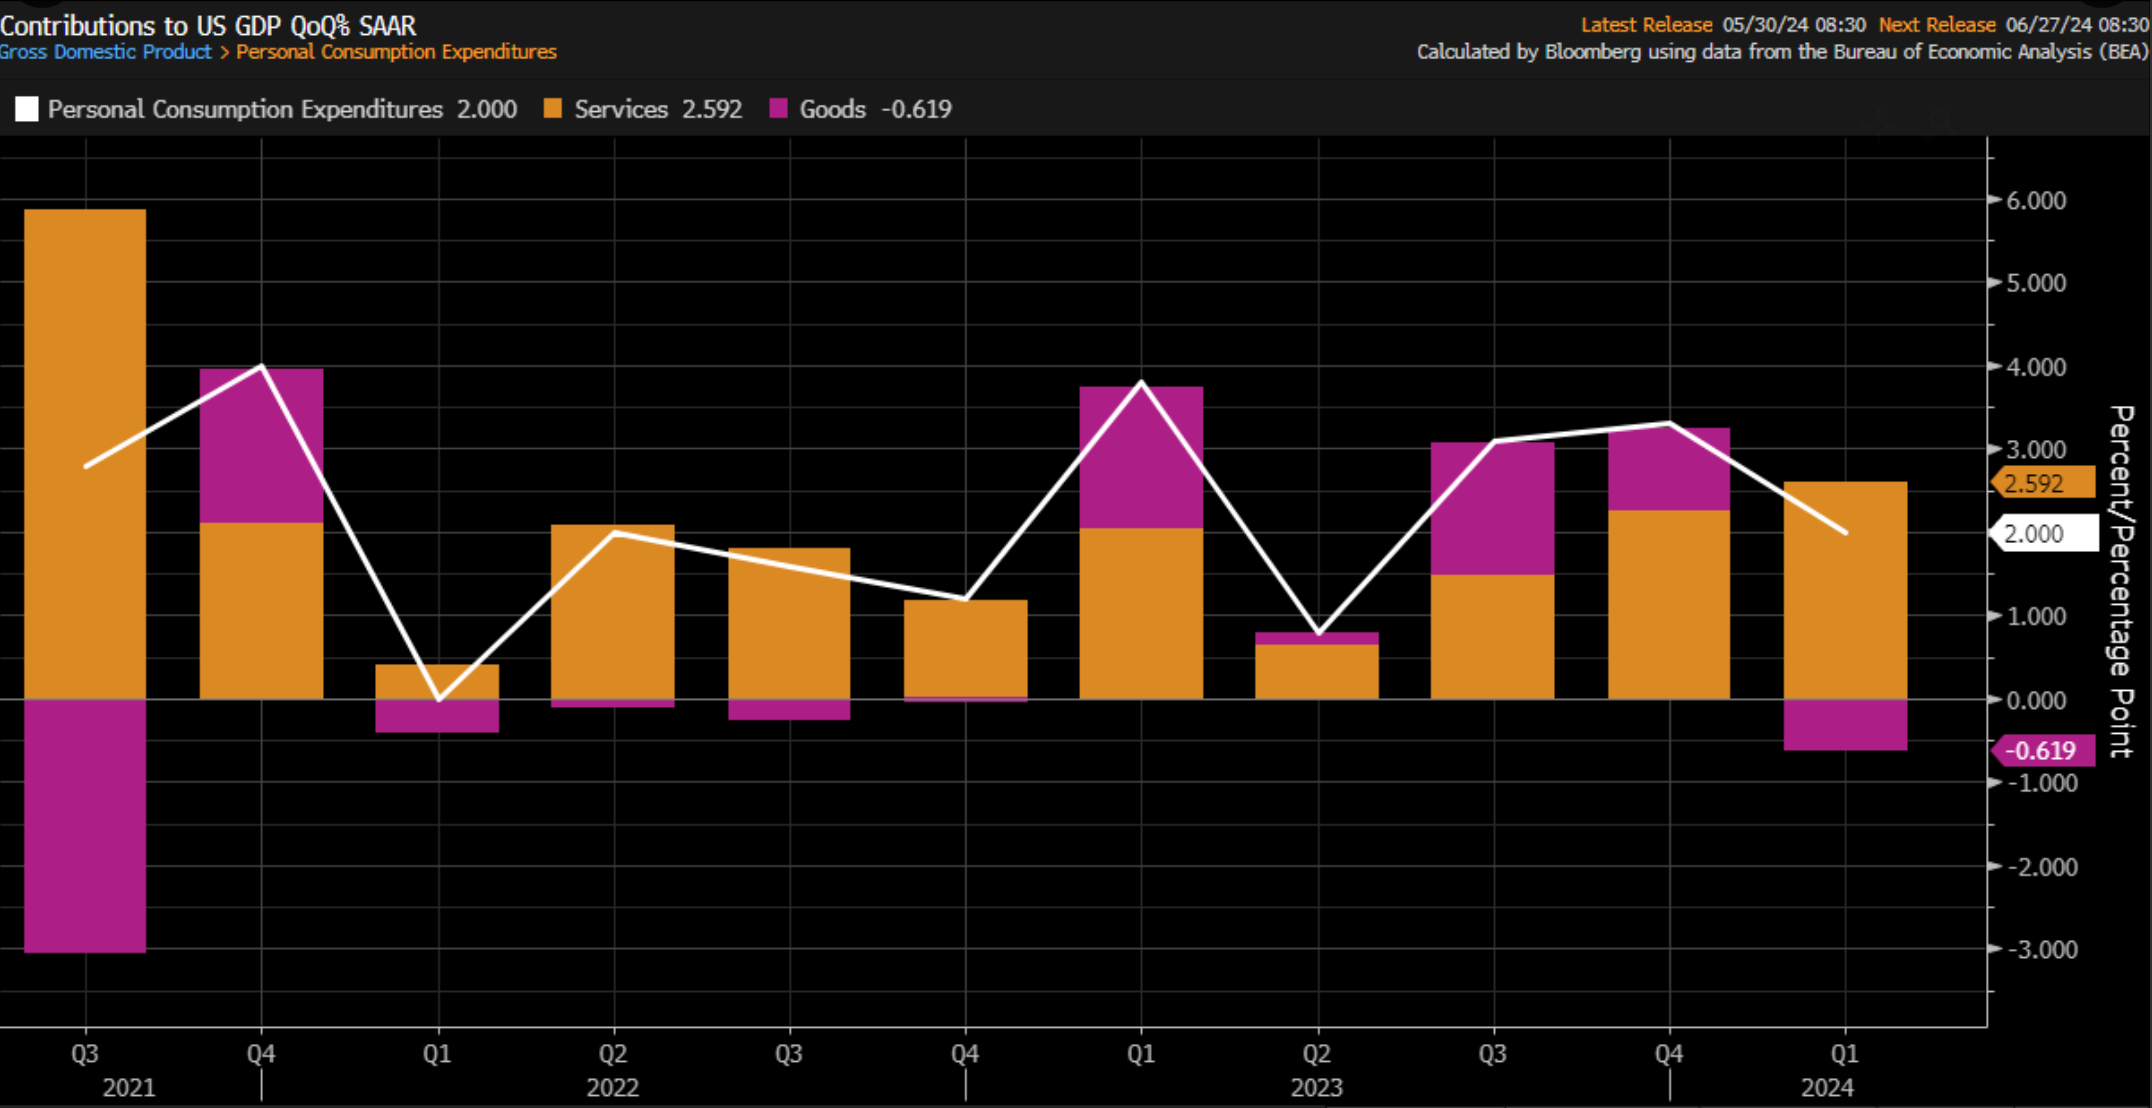
Figure 1 shows real consumer spending in the US economy for Q1, aka, PCE growth. In the second print of Q1, the PCE figure slowed to 2.0% from the advanced estimate of 2.5%.
This was the lowest increase in three quarters since Q2 ‘23, continuing the theme of cooling US macro conditions in both consumption and growth.
To understand the data, it’s important to know the constituents that make the readings and the weight of each data point.
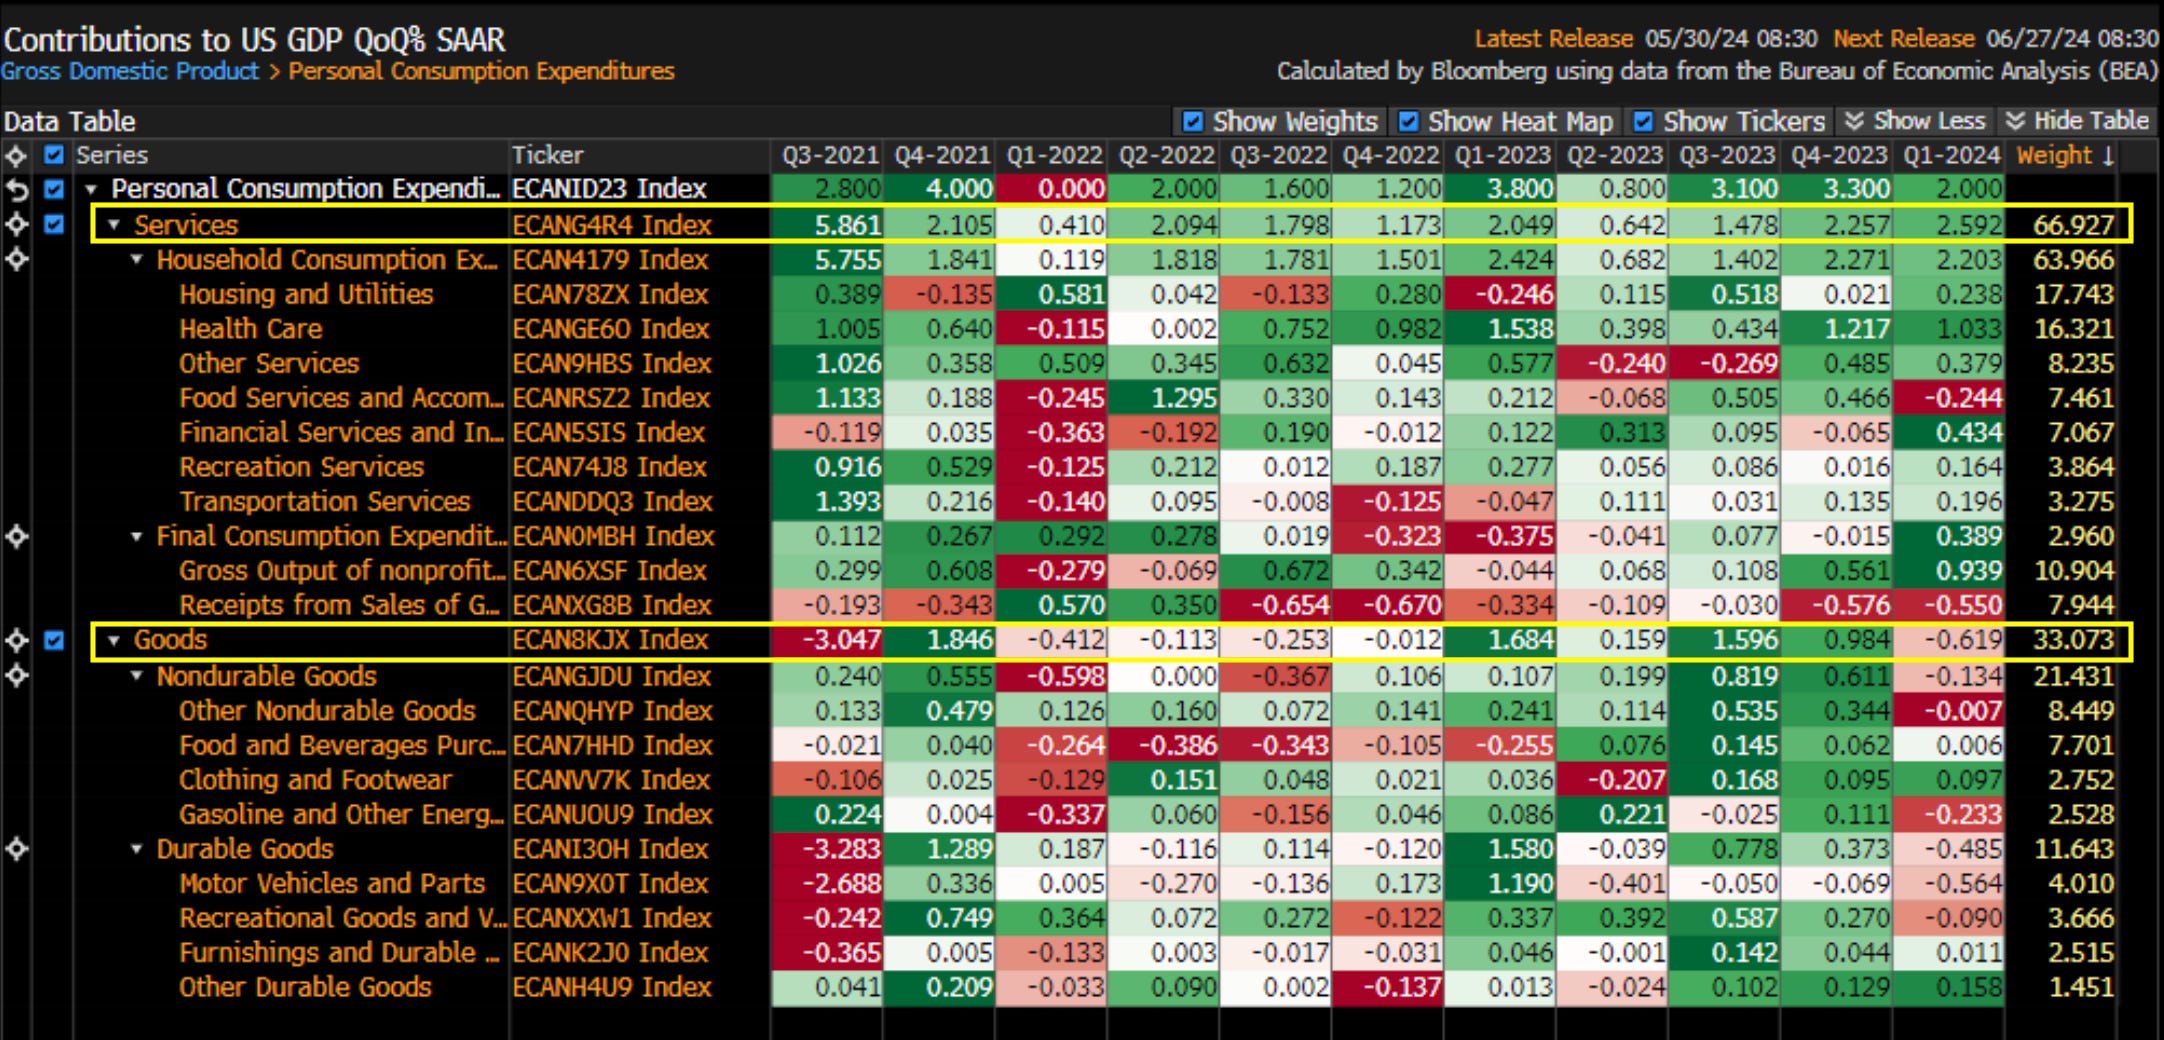
The PCE inflation weighting is largely based on the services sector, as you would expect, household consumption makes up the single largest weight by category at c.64%. The goods component of the reading contributes to a third of the data point, of which the goods component is broken down into non-durable goods (goods with a lifetime of <1 year) and durable goods (goods with a lifetime >3 years). Naturally, the weighting will be more focused on nondurable goods as these make up the more frequent purchases of consumers and therefore would truly represent household consumption patterns.
Thought of the Week
“You can’t fix a broken pipe with a plaster.”
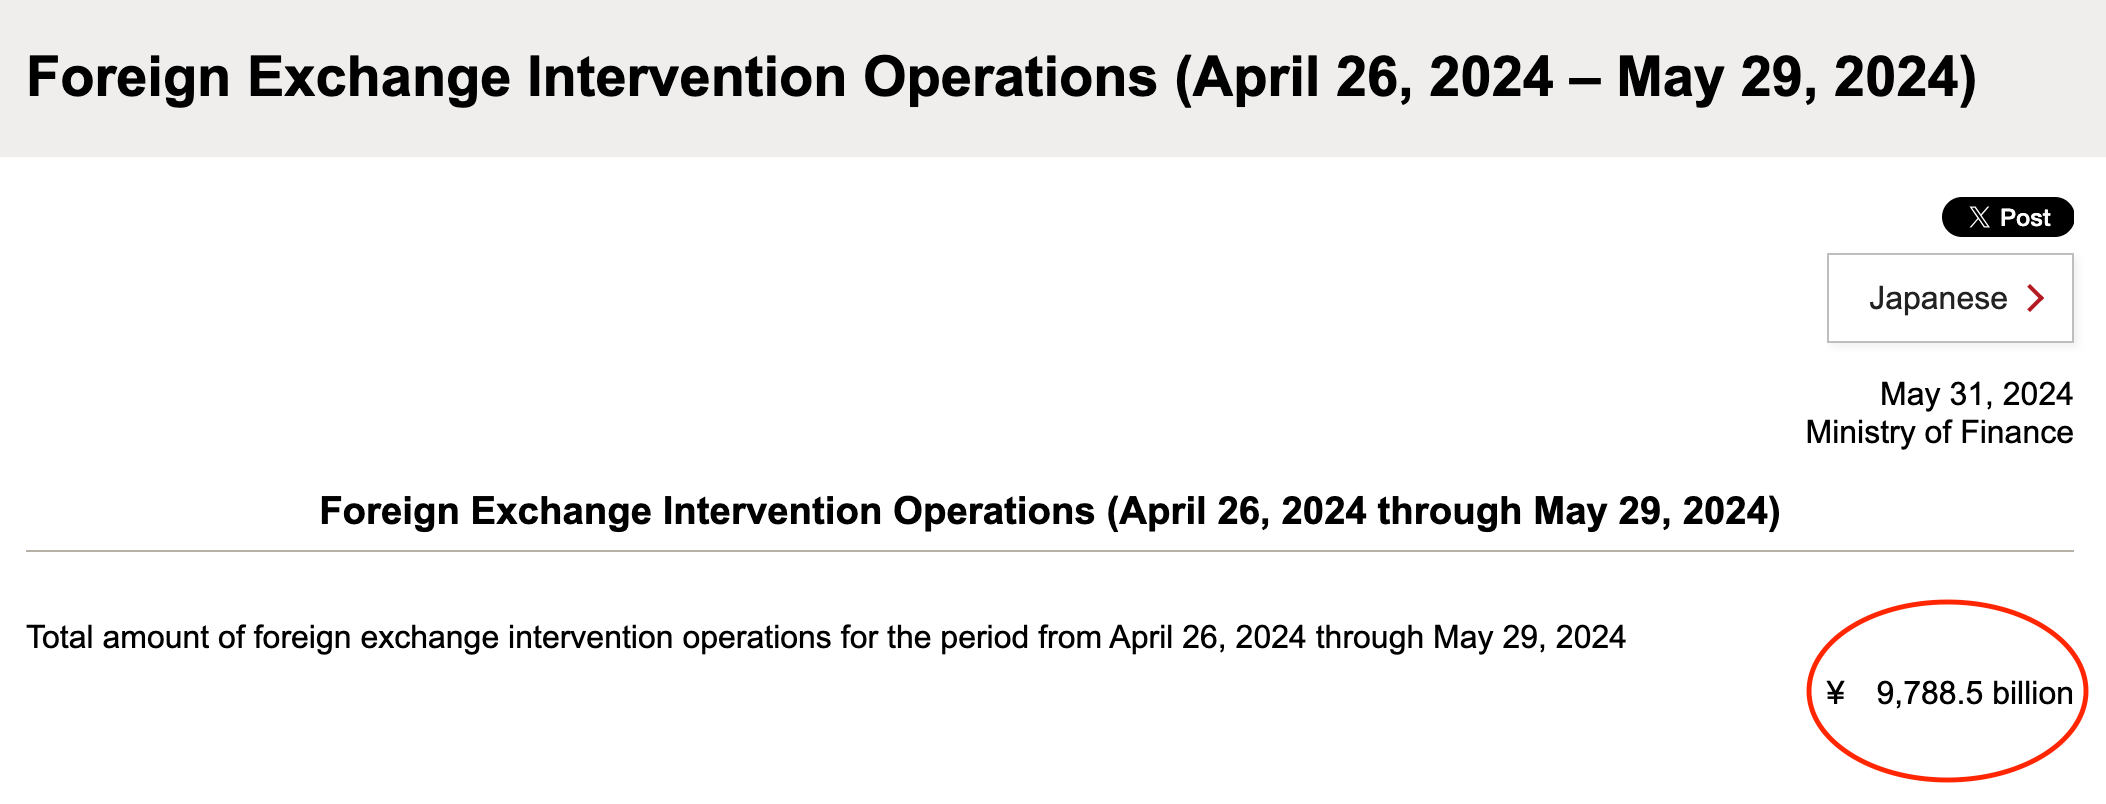
During the period April 26th to May 29th the MOF in Japan spent ¥9.7trillion on its currency intervention.
The result?
The Yen trading at 157.00, not much of a result if you ask me…
This emphasises my next point below, you can’t cover the carry with intervention. Japan needs significantly greater yields on JGBs and or a series of hikes from the BOJ.
Chart of the Week
The carry is your friend.
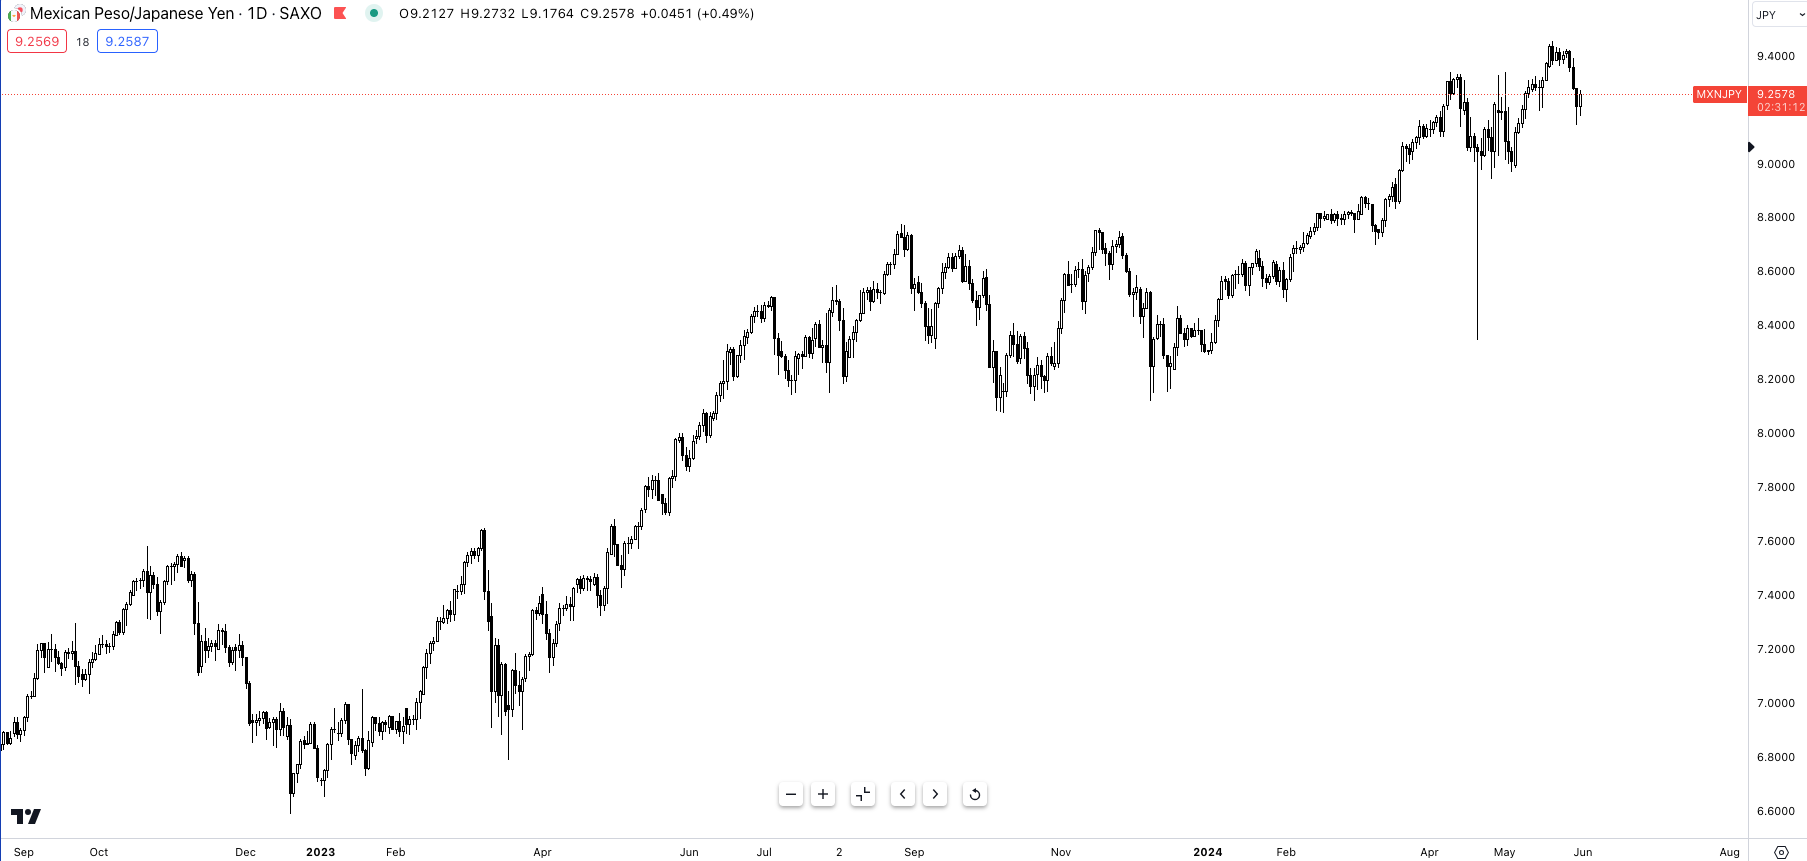
When finding good macro trades I often go to the oldest playbook in macro.
The carry.
Regardless of the shift in markets, the carry trade is still alive and kicking, the MXN & BRL are two of LATAM’s best-performing currencies mainly due to their preemptive hiking cycle that kicked off in the spring of 2021.
Whilst both central banks are embarking on their cutting cycles the carry trade against the yen is still attractive due to the wide yield differential.
Positive carry, long-term trend and divergent monetary policy— every macro trader’s dream.
The regime, R* & The Inflation Picture
R*, commonly referred to as the neutral rate is an elusive number to chase. R* refers to the neutral short-term interest rate, or in layman’s terms, the interest rate that allows the economy to operate at its full capacity/productivity without causing excessive inflation or deflation. Depending on the economy and which quadrant we fit into, something I’ll explore below, the Fed will aim to position the Fed rate above or below r* and some cases try to achieve the elusive r* rate.
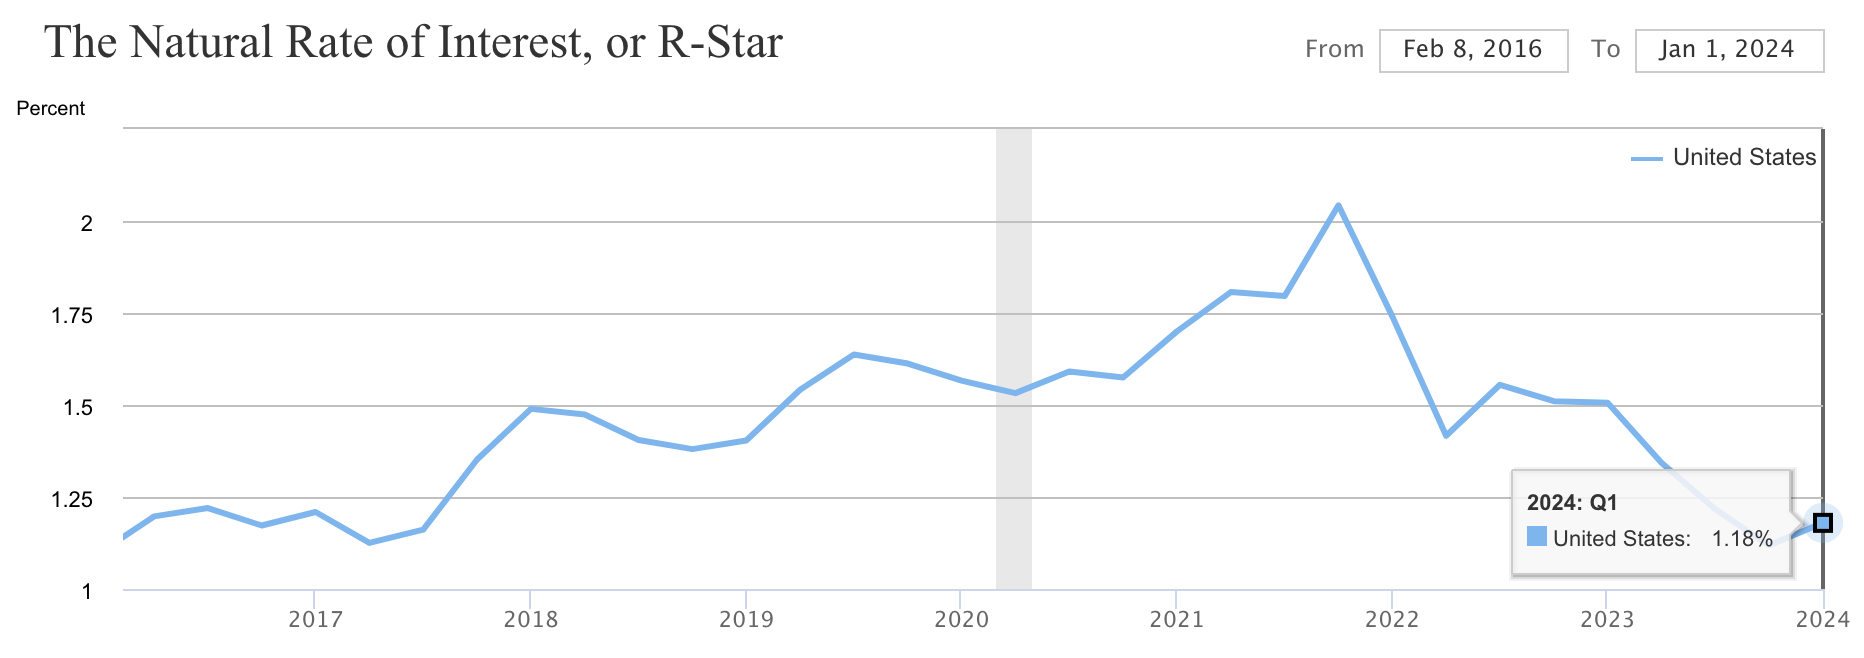
The New York Fed updated their measure of r* today.
According to the NY Fed the natural rate of interest is 1.18%.
The one problem we face with r* is that it isn’t directly observable, while there are formulas, like the one above, which try to forecast r* it’s not a measurable data point, it’s one that must be concluded from analysing how the economy responds to different levels in short term interest rates.
To do that, is in itself extremely difficult—why? Simple, because we understand that whilst interest rates may be high, if credit spreads are narrowing, the RRP balance (reverse repo facility) is high and the US government is implementing expansionary fiscal policy the economy may be less sensitive to interest rates as other financial conditions hinder the true transmission of interest rate policy.
So whilst it’s good to see what the Fed believe r* is, it’s reasonable to suggest that the r* is a lot higher than what is suggested by Figure 4.
We can simplify the state of the macroeconomy into one of these four regimes:
Accelerating growth and an accommodative central bank
Accelerating growth and a restrictive central bank
Decelerating growth and an accommodative central bank
Decelerating growth and a restrictive central bank.
By using this framework you’re instantly able to understand where any economy is positioned. In Q3 and Q4 of 2023, the US was clearly experiencing accelerating growth whilst the Fed was maintaining its restrictive policy, now we can see after Q1 GDP that the US has shifted to regime 4, where growth is slowing and the domestic central bank is still restrictive.
There’s a trade for each regime:
Regime 1 (Accelerating Growth, Accommodative Policy): “The long everything regime”, this is where you expect the high beta pocket of your portfolio to really bring in performance, broad market exposure in this regime would also pay off.
Regime 2 (Accelerating Growth, Restrictive Policy): Shorting bonds could be a potential idea during this regime, as bond prices may decline in anticipation of rising interest rates.
Regime 3 (Decelerating Growth, Accomodative Policy): Investors might consider returning to bonds for their defensive characteristics during this regime & tilting their portfolio to more defensive plays.
Regime 4 (Decelerating, Restrictive Policy): Reducing exposure to high-beta assets, which are typically more volatile, would be the go-to play.
This framework gives us a neat system for picking trades based on the economic climate. Sounds straightforward, right? But of course, markets are trickier beasts than that. Fiscal policy choices and global drama (geopolitics) can throw a wrench into the whole thing, making asset allocation and picking trades way less cut and dry. Take the recent market rally, for example. High beta assets have a strong start to the year, even with inflation surprising everyone in the US. The main driver? The AI boom. This shows how other factors outside the framework can have a big impact.
Two components dictate what regime we’re in, whether growth is slowing or accelerating and whether we have a restrictive or accommodative CB. To know what regime we’re set to enter all eyes must be on inflation.
Today we received the widely anticipated PCE data.
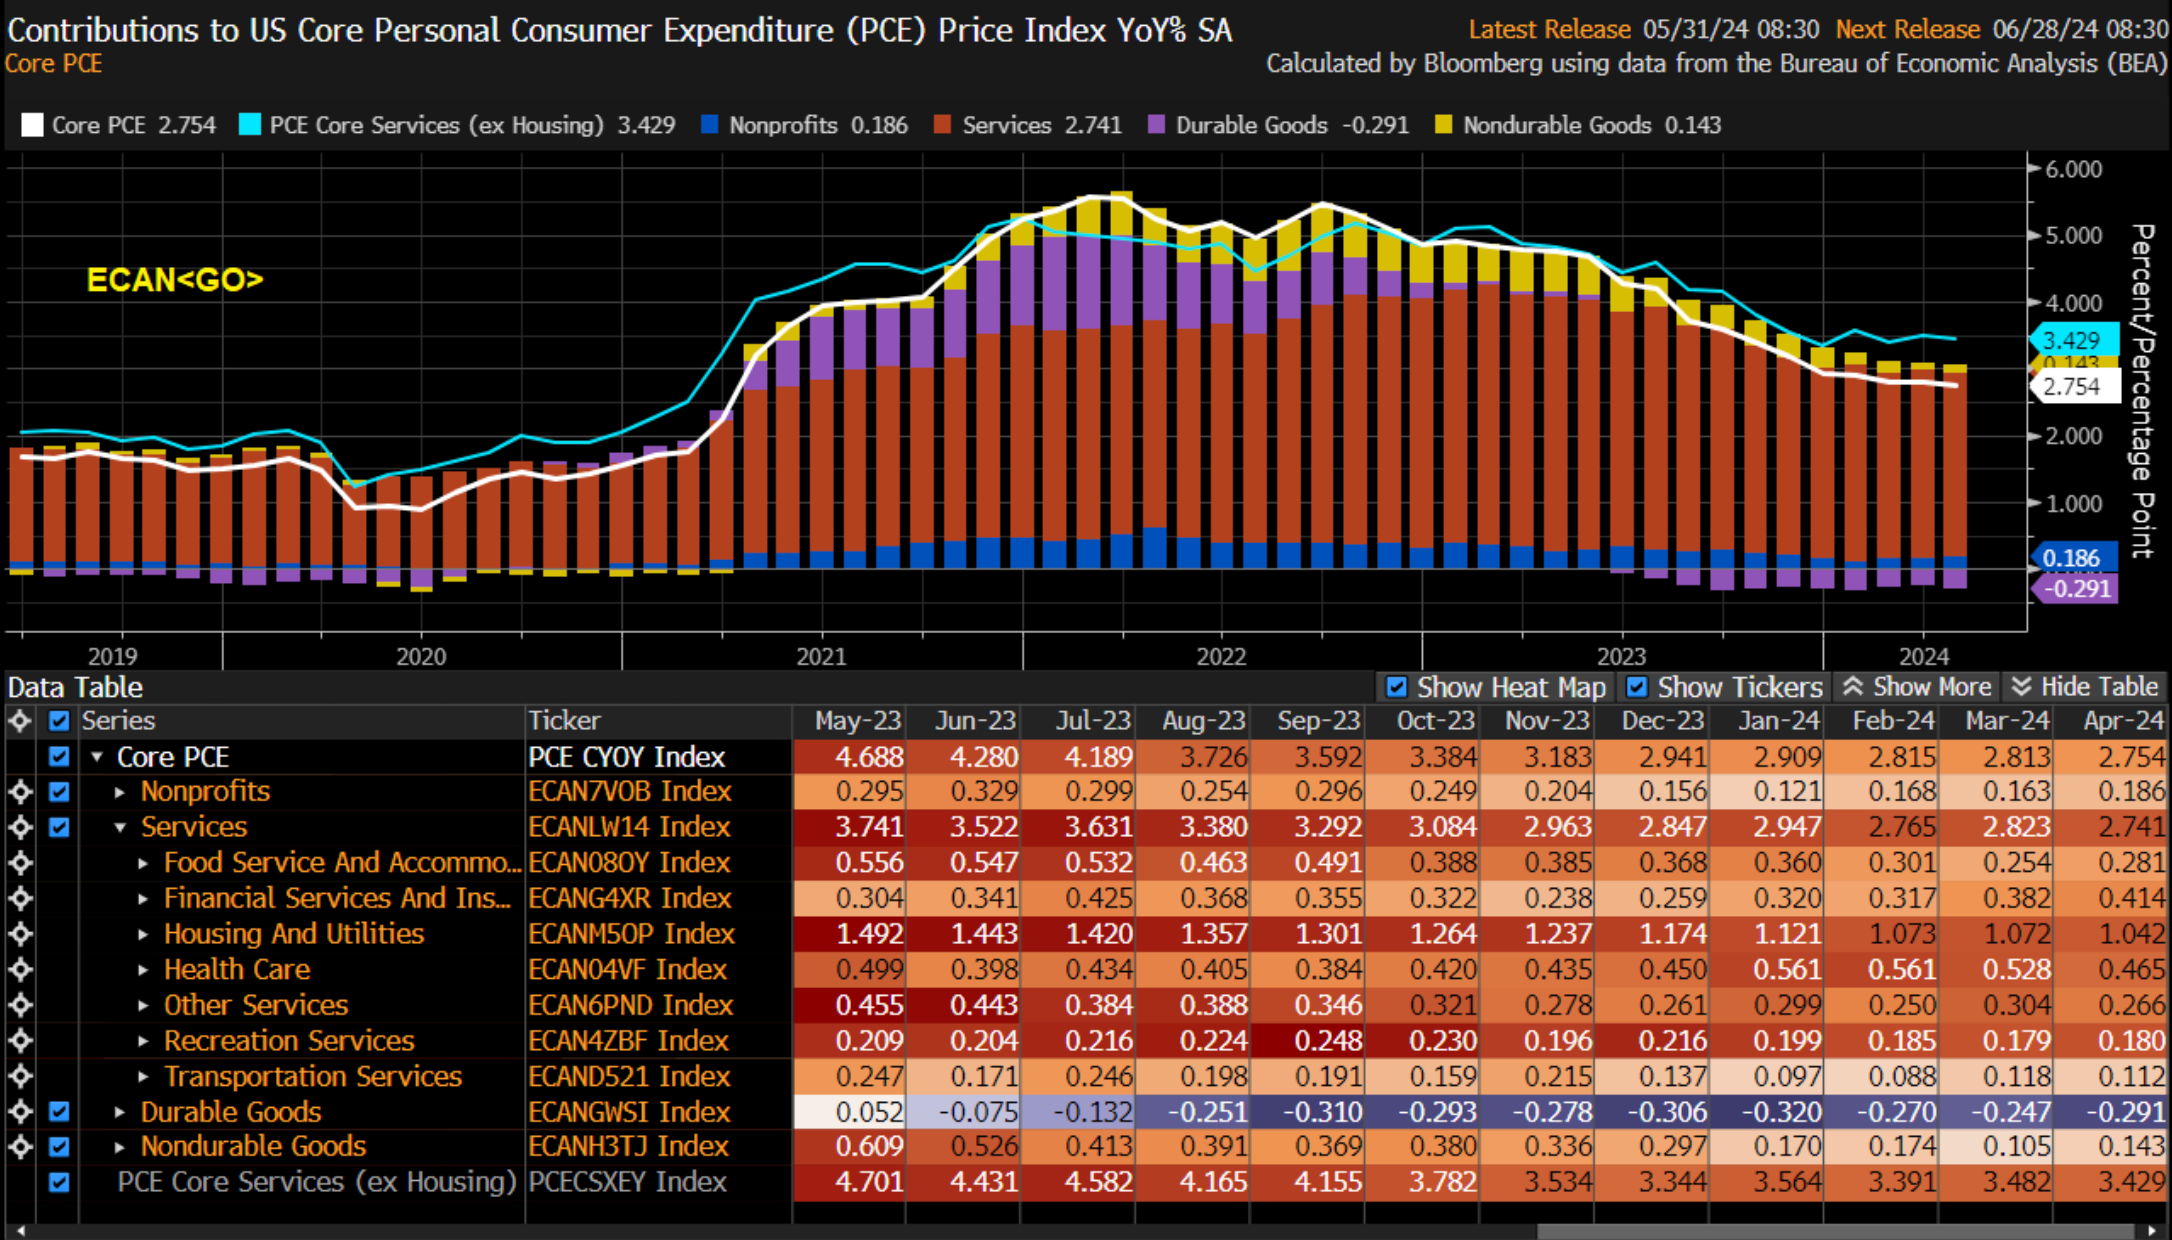
Core PCE came in at 2.8%, in line with the forecasts from the Fed staff, Goldman & Deutsche. This was unchanged from the previous two months; headline PCE also came in unchanged vs March at 2.7% pushing the stagflationary theme to the Fed once again.
On the MoM basis the inflation reading for core PCE was 0.25% vs 0.3%, so a slight improvement but nothing marginal.
Growth Data once again slowed to 1.3% in Q1 from the 3.4% expectation beat of Q4.
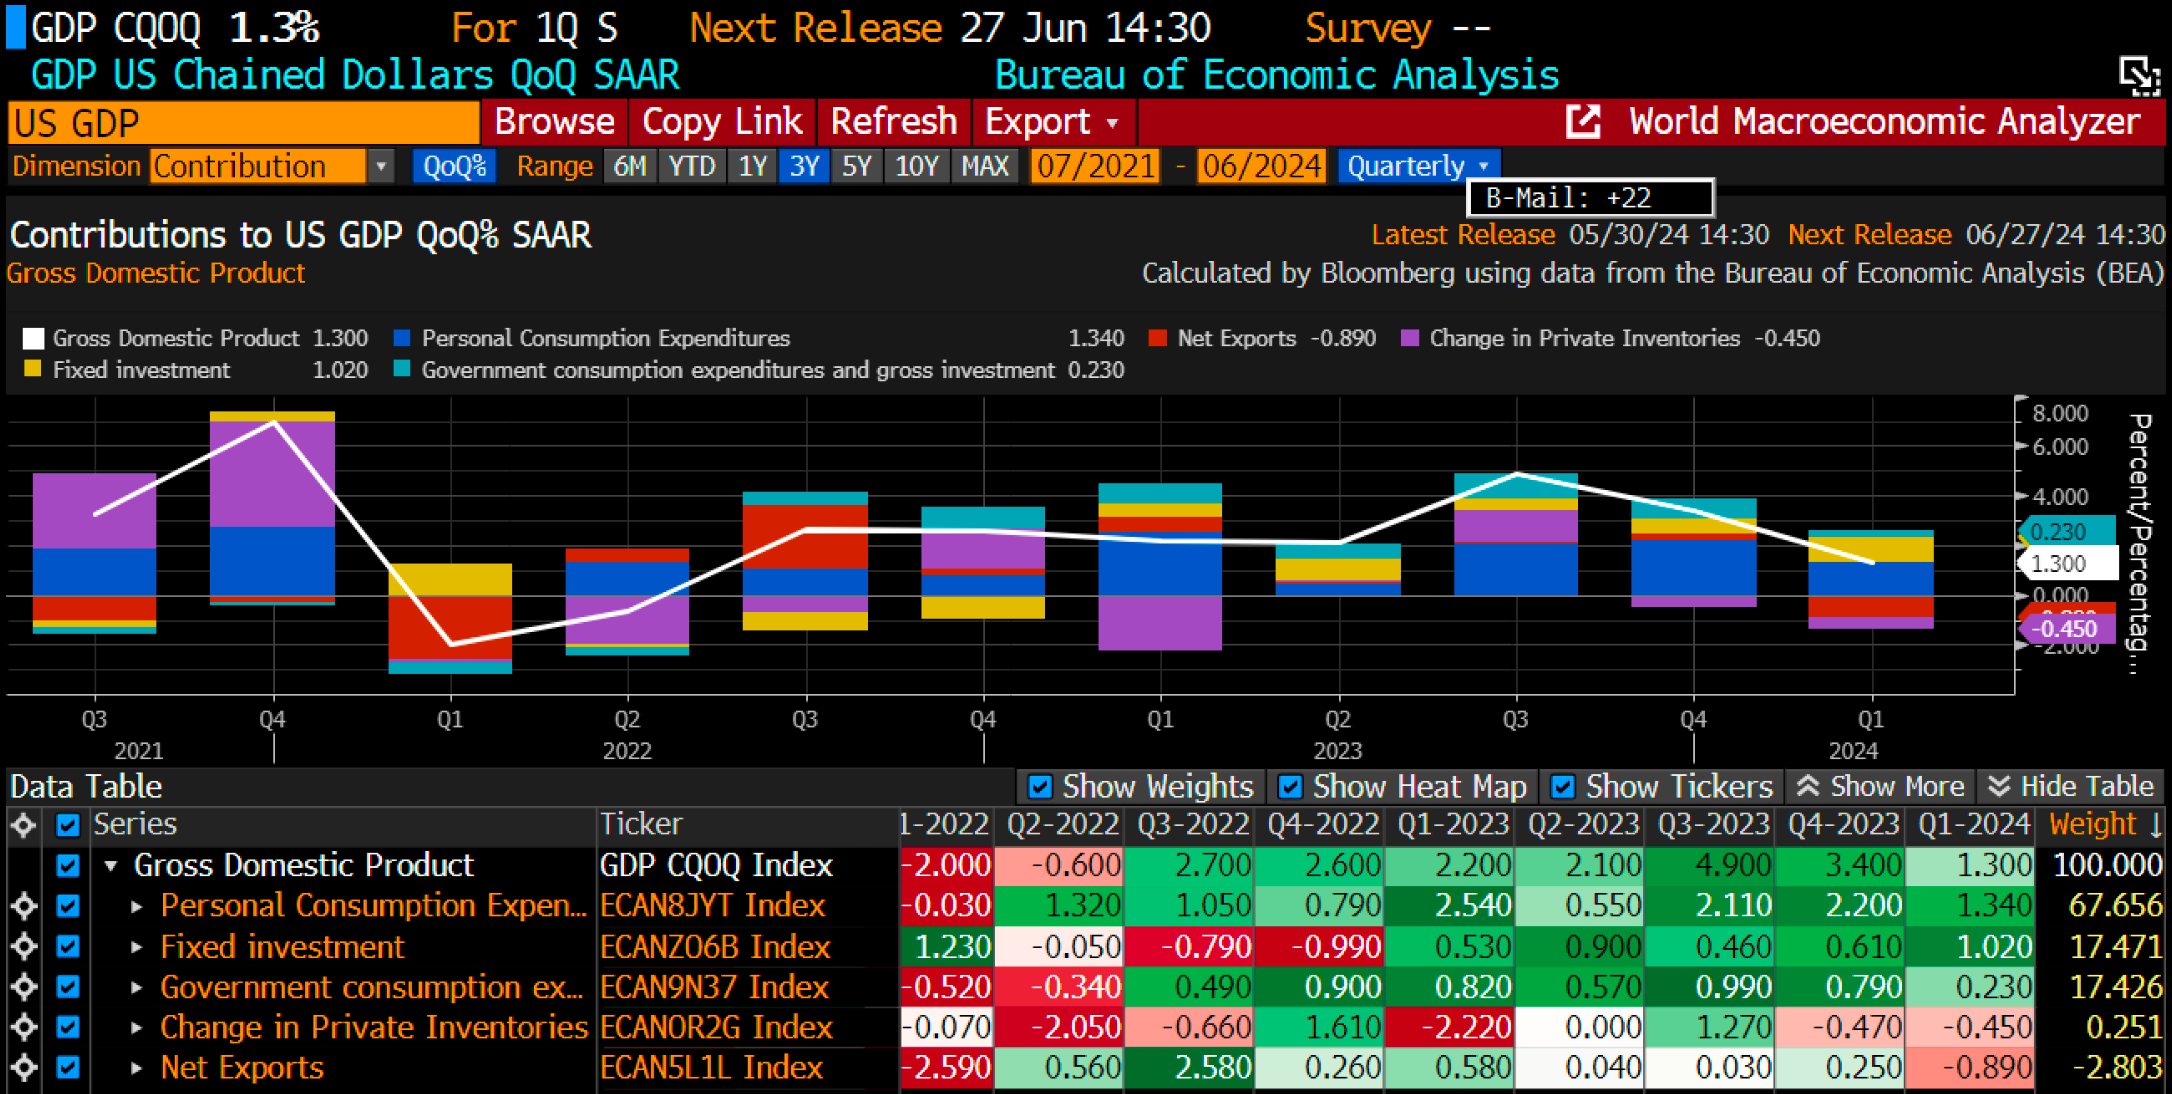
I see growth continuing to flatline through Q2 & Q3 as personal spending data slows as seen through today’s 0.3% MoM personal spending report down from 0.7% in March. This reinforces the current environment of decelerating economic growth with a restrictive Fed policy stance.
Interpreting the inflation reading tells us the following:
Moderating Inflation: Policy measures appear to be effectively curtailing inflation, bringing it closer to the Fed's target. The likelihood of a significant resurgence in inflation seems to be diminishing.
Fed Policy Outlook: The current inflation data doesn't significantly alter expectations for potential Fed rate cuts. We maintain our forecast of two rate cuts beginning in September (with highest probability).
Importance of Macro Regime Identification
Identifying the prevailing macroeconomic regime is a crucial first step in developing a macro bias. By distinguishing between "signal" and "noise" within economic data, we can gain a clearer understanding of the current economic environment, its trajectory, and potential future developments. This understanding can then be used to formulate sound macro trade ideas.
Thanks for getting to the end of the report, I enjoyed this one, so I hope you did too.
Let me know your thoughts & ideas!
Until next time.