
The Fixed Income Trade
The H2 Playbook: The UST Bull Steepener & JGB Steepener

Hey guys,
It’s been a heavy week in markets.
US data, elections volatility in markets & the first G4 cut coming from the ECB which I’ll cover in a separate report.
Today we’re going over the fixed-income trade which I believe will be the theme/trade for H2 markets in the US & Japan.
Without further ado, enjoy.
Macro View
Politics, policy & rate probabilities
What’s happened in macro this week?
Earlier in the week two key political victories brought volatility and a huge reaction in equities and FX. PM Narendra Modi won the elections for the third consecutive term in India. The only issue is, that his (BJP party) victory margin narrowed significantly, failing to secure a majority in the government.
Don’t worry. You don’t need to understand politics. You just need to understand that investors and the market don’t like political instability.
Following the release of Modi’s victory Indian equities (Sensex index) sold off by more than 8% in the aftermath.
The signal that markets reacted to is that governance in India will be increasingly unstable.
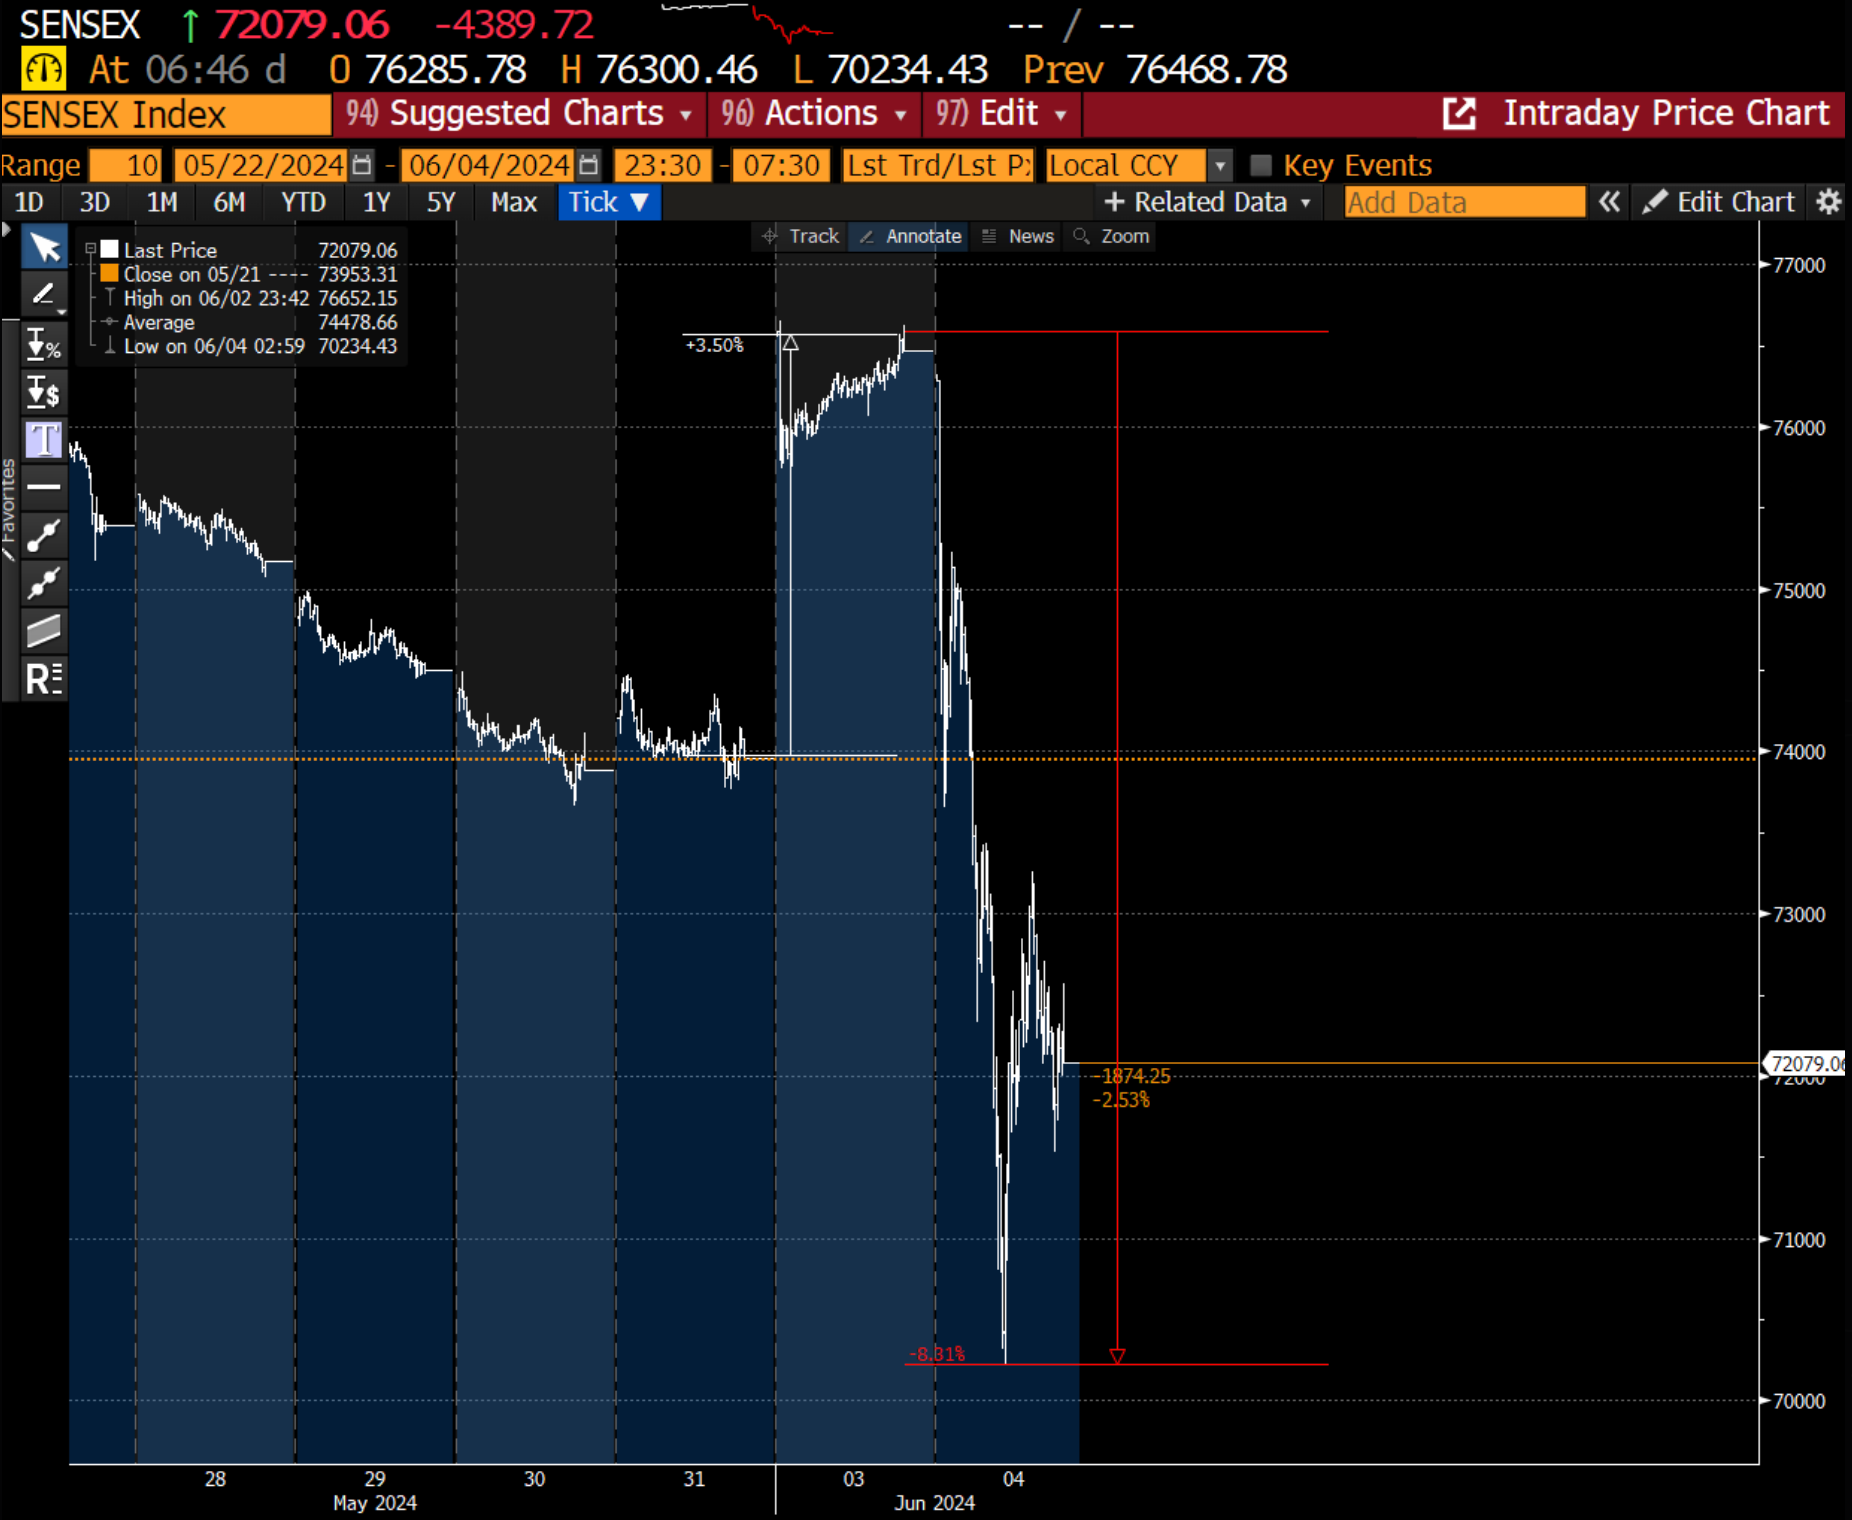
Since the sharp fall on Tuesday, the Sensex has recovered much of the losses to trade close to the market close last Friday.
Over in Mexico, the leftwing ruling party Morena, claimed a landslide win in the elections.
Both equities and the Mexican Peso traded heavily after the market reacted to the victory. As a small insight, the Morena party in Mexico has been the ruling party since 2018—so markets weren’t scared because of a new party, but because of the additional power the Morena party has gained in its recent selections.
The fear is with the landslide victory, the Morena party, under the control of Claudia Sheinbaum, may entice radical constitutional changes, nullifying the checks and balances system which prevents the government from abusing its power.
The market rumble caused the first female president, Sheinbaum, to announce that the finance minister Rogelio Ramirez, an individual respected by investors, would stay on in her cabinet once she takes office.
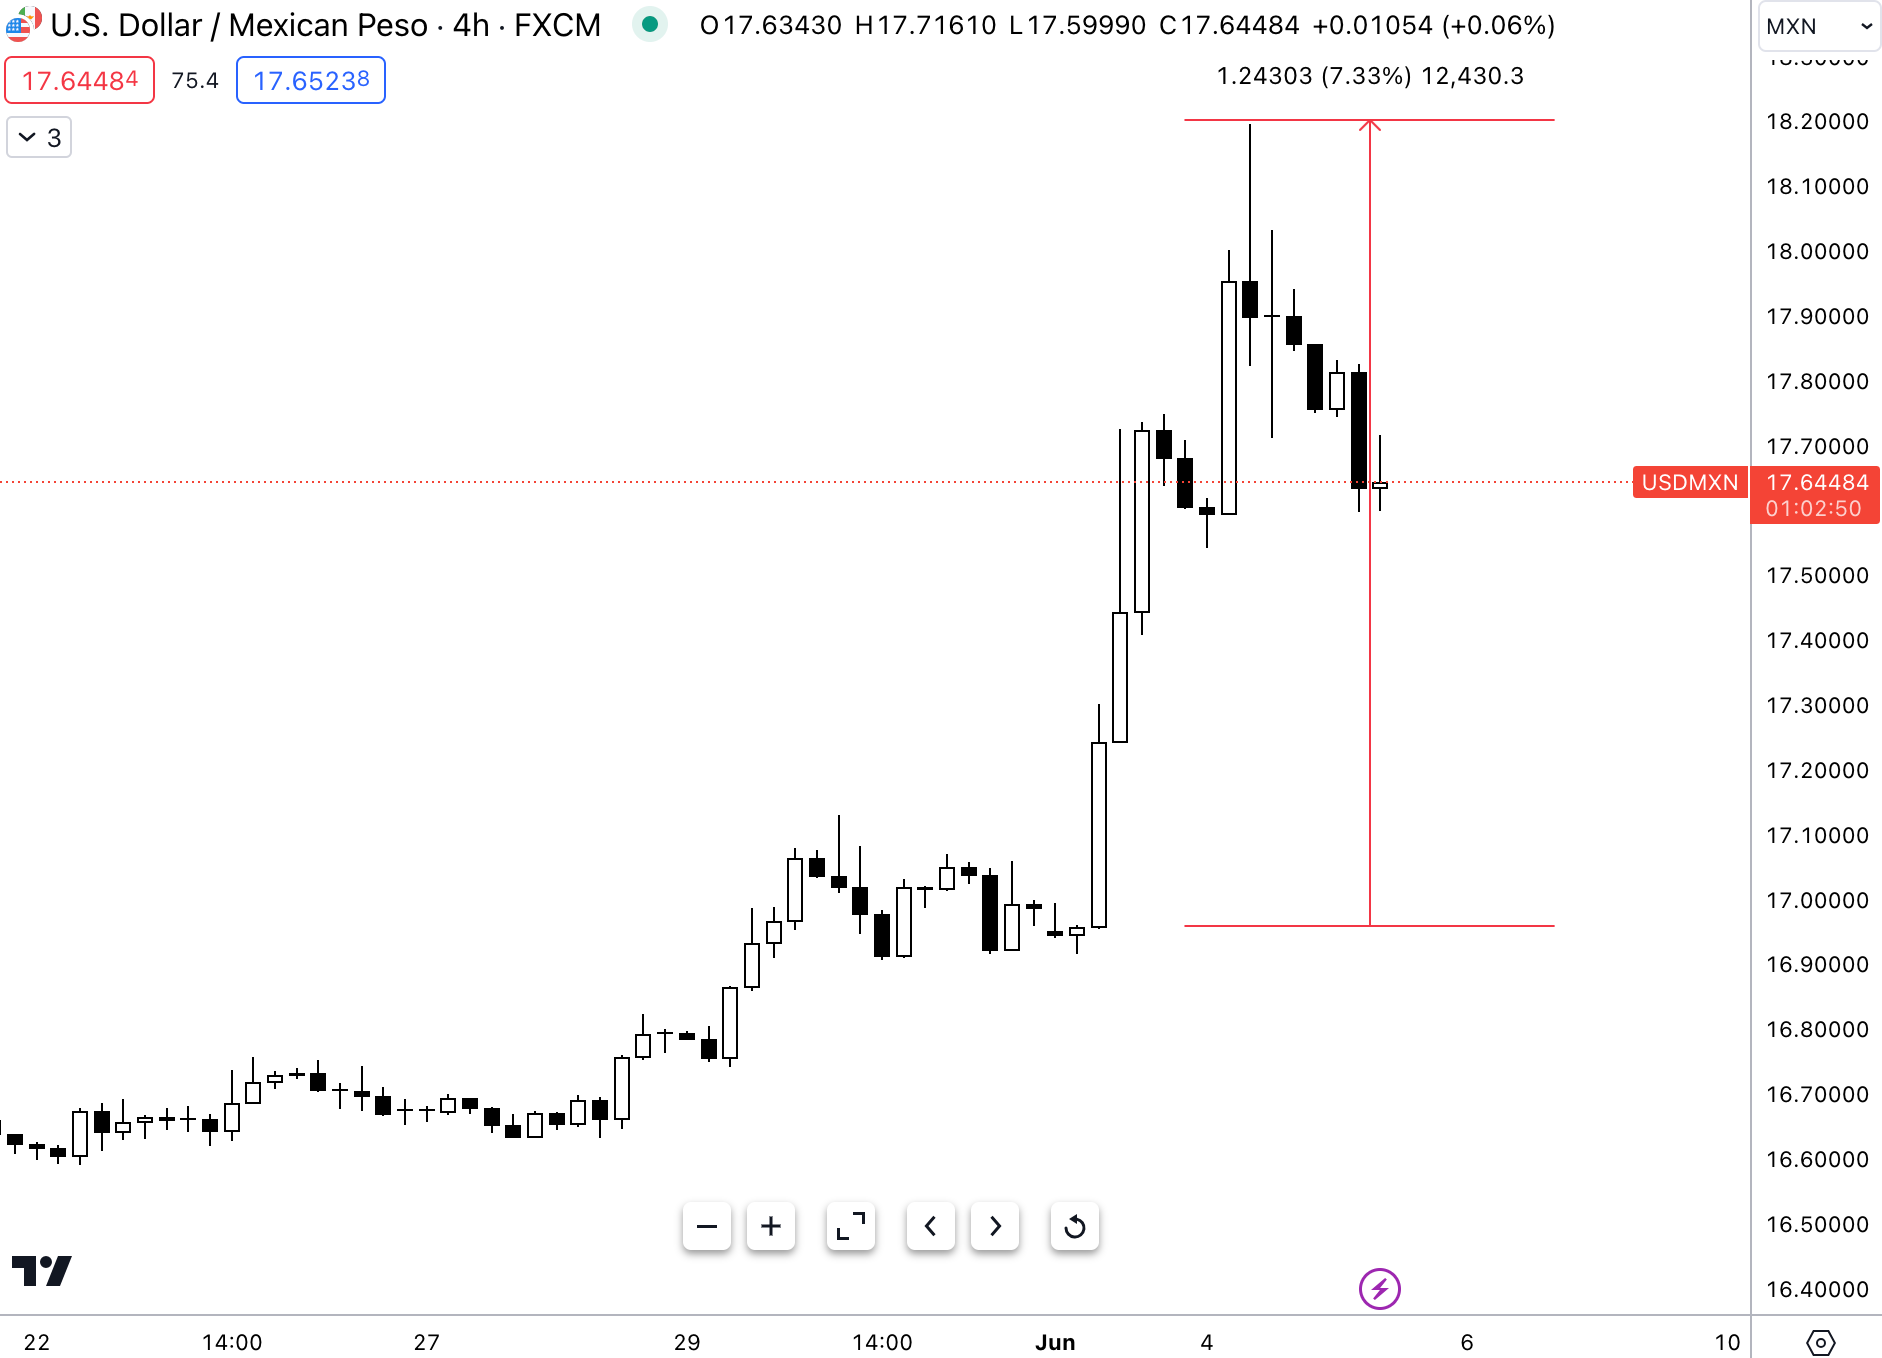
The peso fell 7% after news of the election win surfaced.
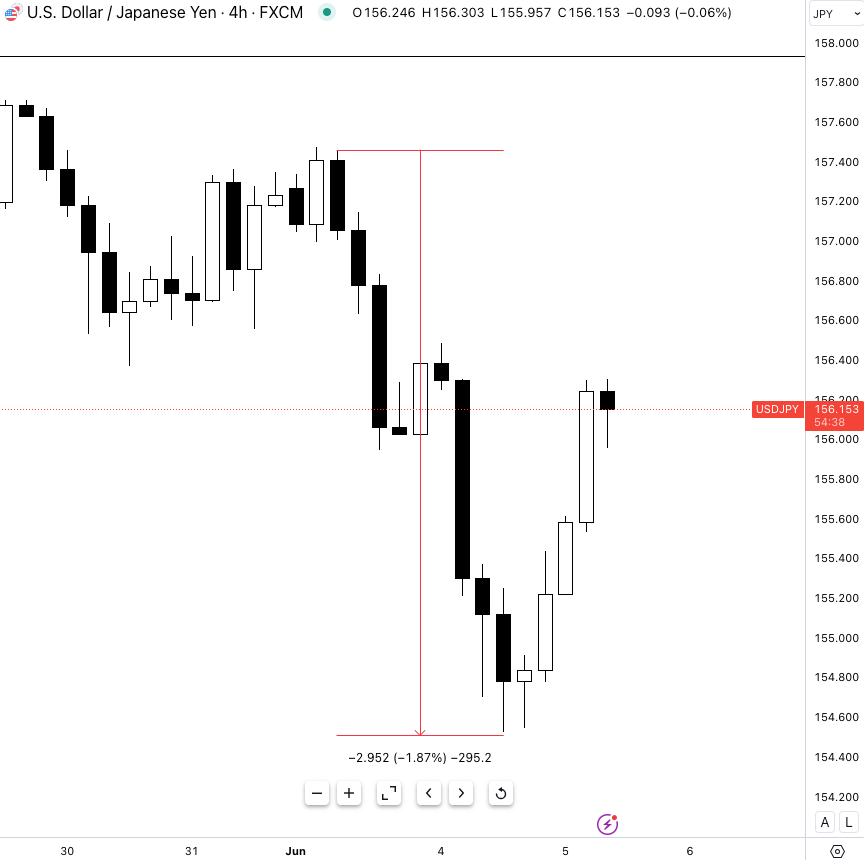
What you’re seeing here is investors de-risking from the political uncertainty about future governance. In the aftermath the Yen caught a bid, providing some relief to the weakened currency.
As macro traders the main focus should be, whether there is asymmetrical upside to trading the peso until the uncertainty and fear settle. The short answer. No.
So, the carry still persists, but with extreme caution.
Chart of the Week & Thought of the Week
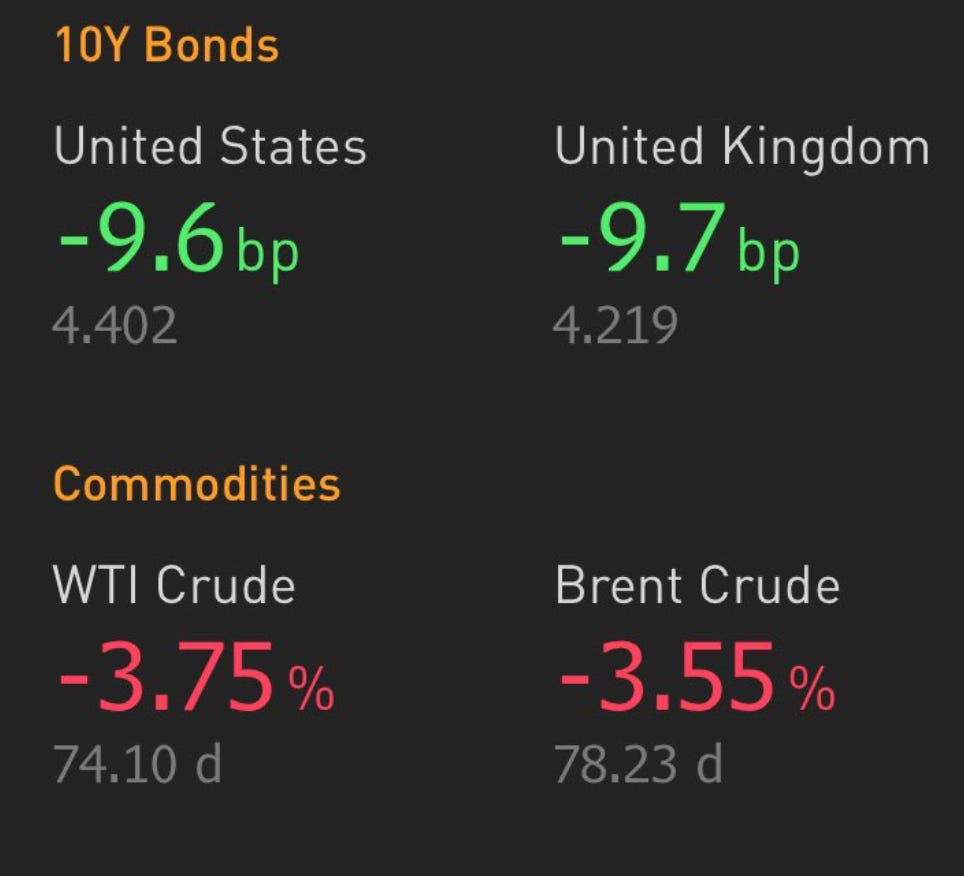
Is this going to be the tale of H2 markets?
Bullish DM rates (lower yields) and lower oil prices as the market reacts to further weak data from the U.S.
The narrative of American exceptionalism has masked a key truth: recent economic performance relied heavily on a massive fiscal stimulus, not necessarily inherent strength.
Now with the recent Q1 GDP data report showing signs of deceleration and recent jobs data expressing the long-expected softening of the labour market, it may be time to call the top on yields as long as we continue to see data disappoint to the downside.
The Bull Steepener Trade
In US rates I believe the trade for the remainder of the year will continue to be the bull steepener, when long-end rates fall faster than short-end rates, for those needing a reminder.
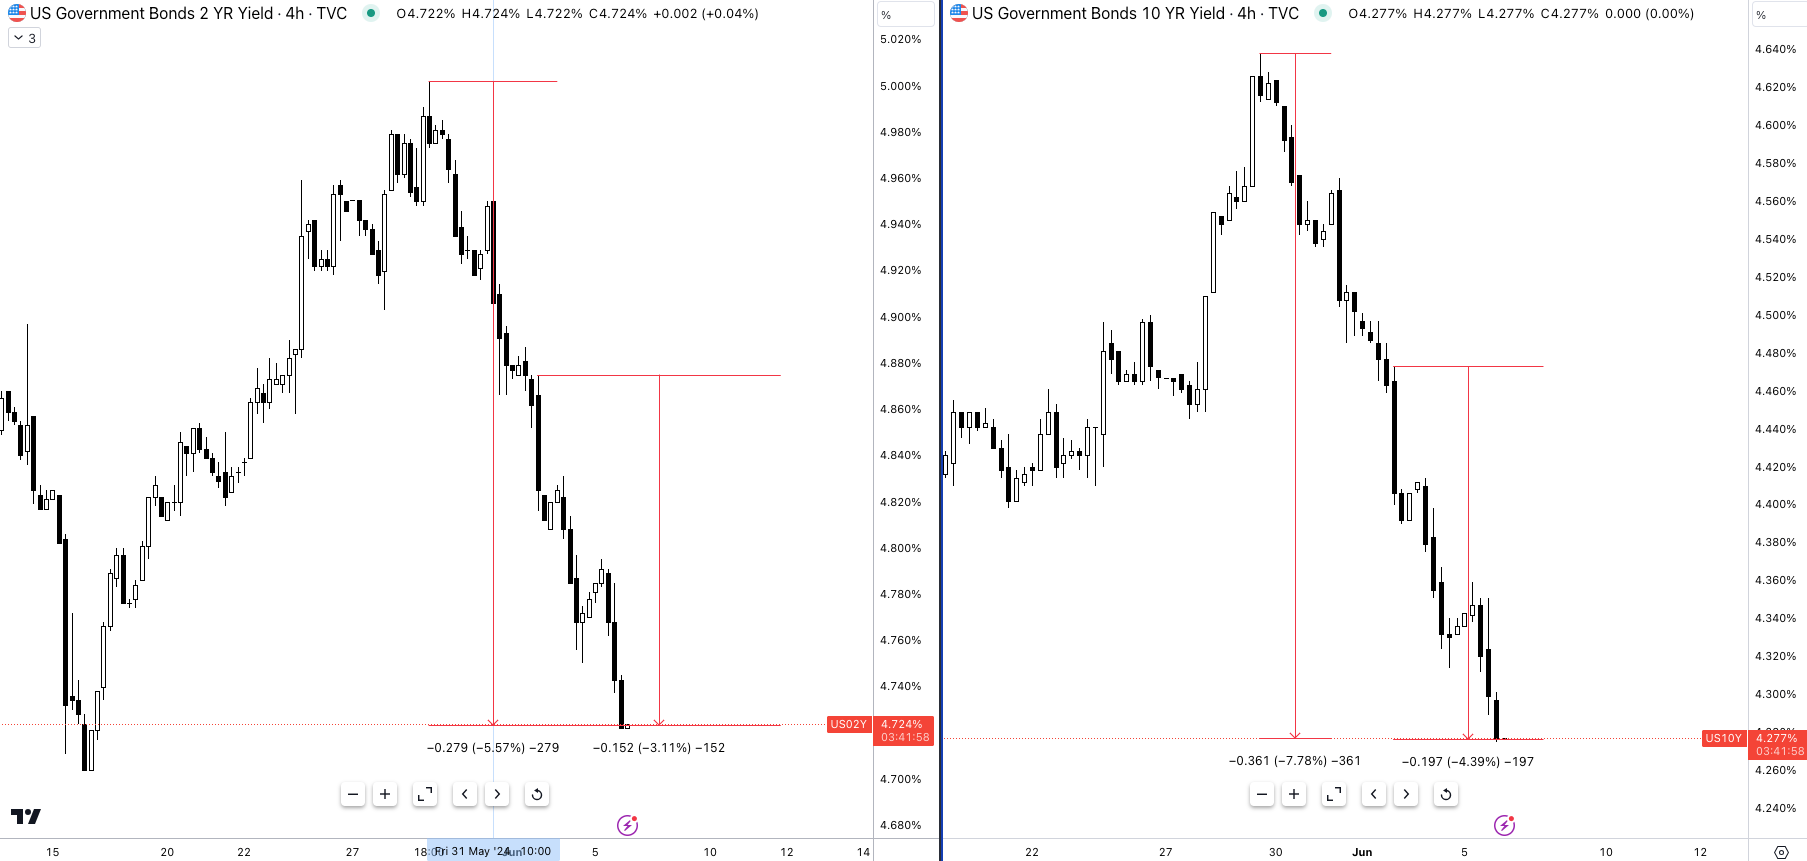
Since last week Wednesday when Vice Chair Williams held a speech the US yield curve has seen rates drop across all tenures, Thursday the 30th added fuel to the fire with second estimate growth data slowing to 1.3%. Since then the front end of the curve, namely the 2s, has dropped 27bps whilst the 10s declined 36bps, the largest decline across the yield curve.
I've been vocal about this position for the past two months, and for good reason: this trade has legs. While pinpointing the exact 10-year yield by year-end is a fool's errand, I expect it to be within the 3.75-4.00% range. This hinges on continued economic slowdown and the absence of fresh inflationary pressures.
So, the bull steepener and the unwind of the 2s10s inversion look attractive given the macro regime we’re in.
Longer duration bonds also experienced bullish rates as investors bought treasuries in anticipation of further weak data increasing the probability of a Fed cut in September.
As a reminder, bonds with higher duration are more sensitive to changes in interest rates.
Duration simplified:
Duration reflects the time it takes to receive all of a bond’s cash flow (principle + coupon payments).
Now, when you have a 30-year bond, a high-duration bond, this bond inherently has a longer time to maturity. Meaning, they have more coupon payments remaining and a longer time until the principal, say $1,000, is repaid to the bondholder.
In a formula:
Higher duration = greater price ∆ per basis point move in rates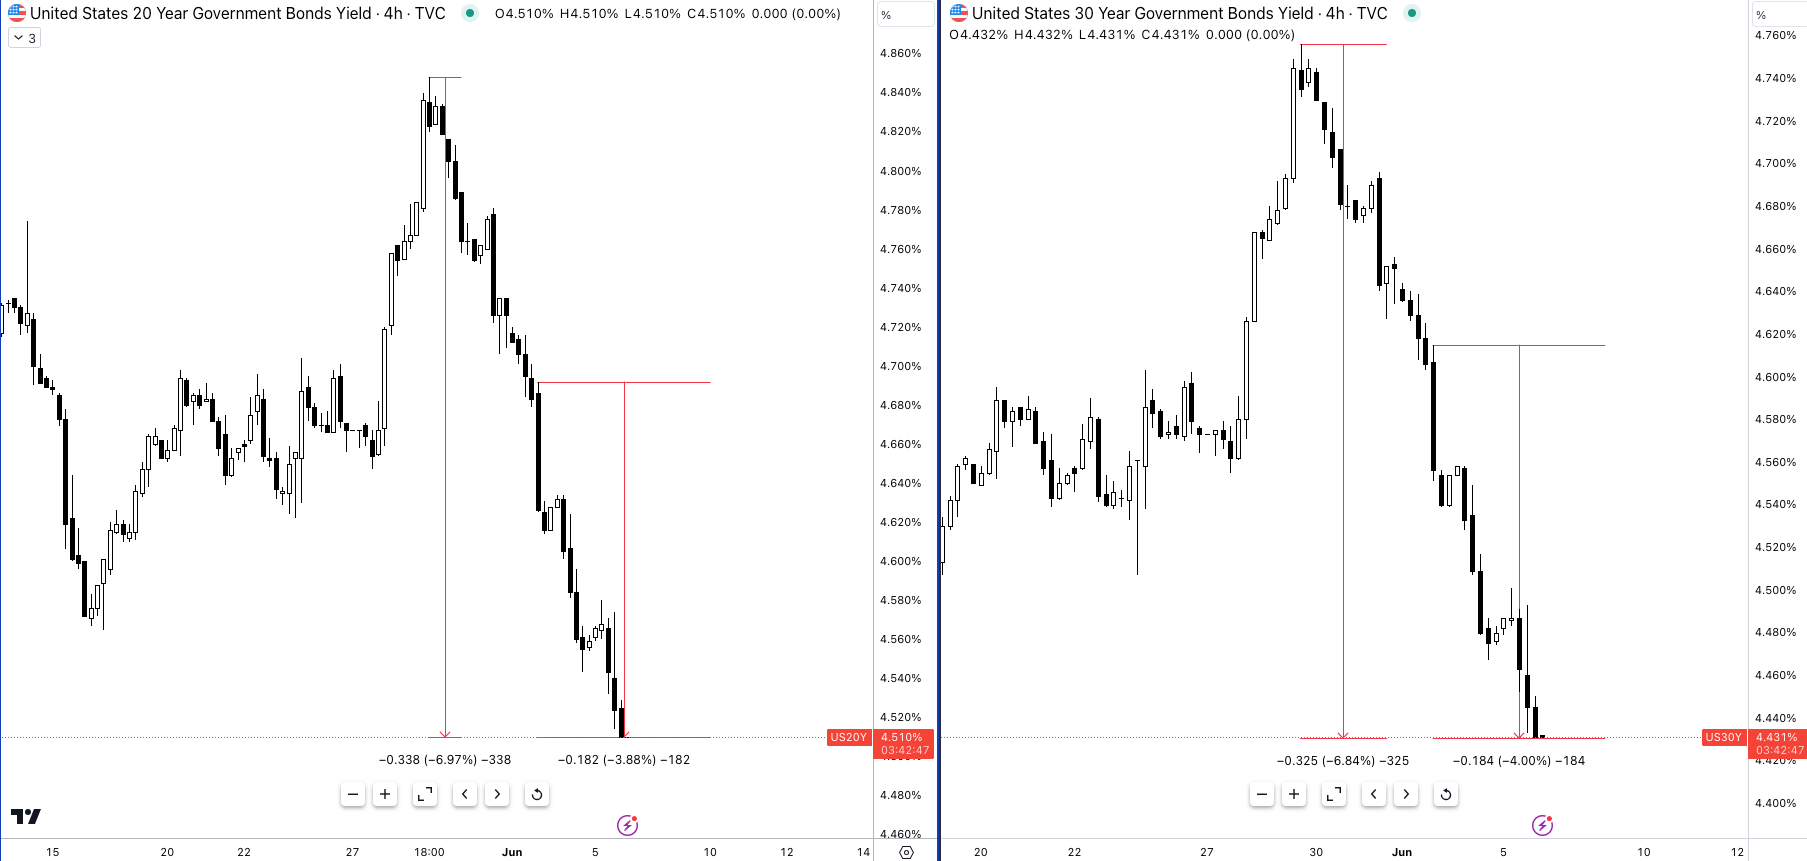
The 20y & 30y yields both declined c.33bps, more than the front end and 3bps less than the yield of the 10y.
This brings me to the trade idea I shared earlier in April which still has legs.
An extract from my TLT Trade Idea:
“By the Fed slowing down the rate of bond selling, we can expect to see a compression in yields and greater bids in bonds resulting in bullish rates (lower yields). Good for our trade. As discussed in a previous research report, if we’re long bonds, we’re long positive convexity, meaning the ∆ (delta/change) of our trade would result in greater monetary upside per basis point movement than downside.”
That report was released on April 25th, right at the peak in yields for 2024 which has since declined over 46bps on both the 10y and 20y. You can’t make this up.
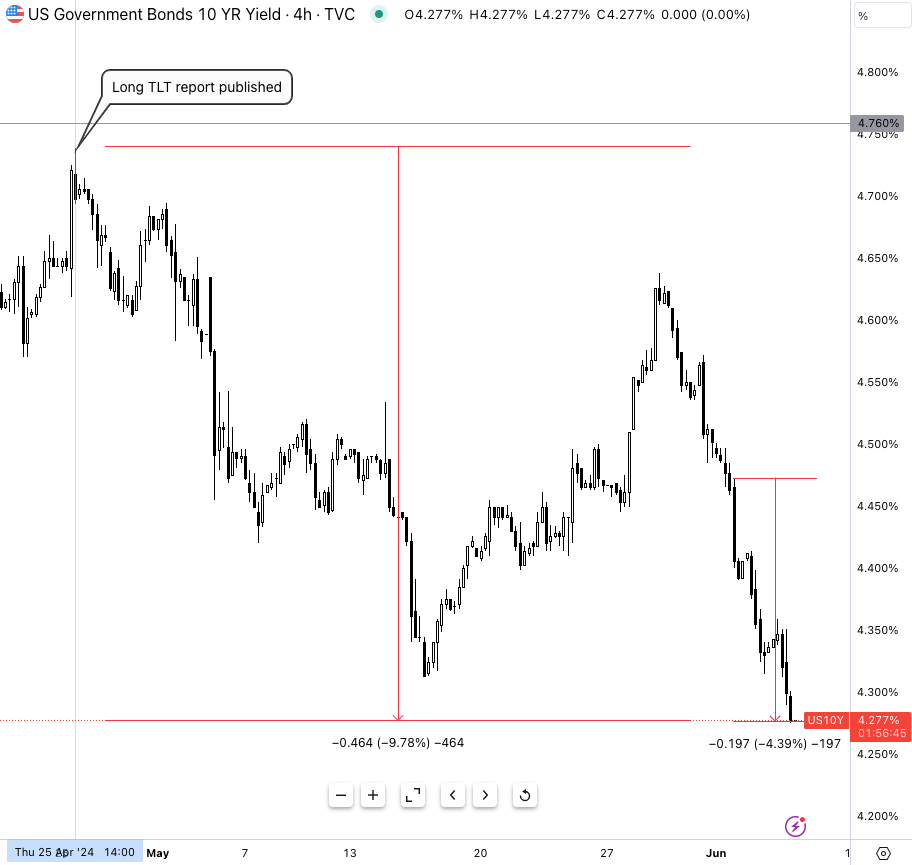
Some calls are great, others aren’t, the life of a macro trader I guess. Luckily, we were on the right side of this one as it was a pretty clear move to anticipate with the Fed tapering QT & weakening growth.
For those who understand the concept of convexity well, feel free to skip over to the breakdown of my JGB shorts idea, otherwise, here’s how duration and convexity work in a rather decent analogy.
Convexity (for dummies)
So, here’s how duration and convexity work together in a rather decent analogy.
Imagine the yield curve as a bridge. Duration tells you the slope of the bridge, (a steeper slope means higher sensitivity to rate changes, i.e. lower coupon rate). Convexity tells you how curved the bridge is. So, the higher the convexity, the greater the price change per 1% rise/fall in interest rates.
As you’ll see in Figure 9, higher duration bonds (darker lines) have greater curvature, aka, convexity.


The yield curves you see above show positive convexity.
This is how the curvature benefits us:
Price increase acceleration: As interest rates decrease (good for our high-duration bonds), the price increase accelerates exponentially as seen on the RHS image. As interest rates increase the price decrease is less. This means that our bond price goes up by a greater amount than it would with a straight-line relationship.
E.g, if I long the 10y I am long positive convexity, and because of this I would make more when rates decline a certain amount, say 30bps than I would lose if rates were to go up 30bps, the same amount.
So we benefit from prices rising faster and from the prices decreasing slower due to convexity.
JGB Shorts
Bear Steepener: 10y Target Range 130bps - 150bps
In my report two weeks ago I discussed a position I took on JGBs, first going long (risky play), before going short for a longer horizon leading up to the June 13th BOJ meeting.
The timing of my long JGB trade was wrong and was stopped out; a known risk going into the position.
When breaking down my reasons for looking short on JGBs the main question to answer is:
Where do I expect the policy rate to be?
We need to answer this question because it will determine how the yield curve moves.
With inflation above the 2% target, currently at 2.5%, my conservative outlook is that Japan’s policy rate will have to climb to at least 50-75bps from current levels.

It’s not overly ambitious to expect the BOJ to continue hiking past 75bps if inflation in Japan continues to hold above the bank’s target. Currently wage inflation in Japan is 2.1%, so real wage growth remains negative, but if wage growth begins to surpass inflation with consumption data recovering in real terms, policy normalisation becomes an increasingly unavoidable reality for the BOJ.
In the best-case scenario (i.e strong inflation & consumption data) we could see a slow, but gradual tightening cycle to 1%. That in itself would cause the yield curve to steepen significantly, pushing high-duration bond yields north of 250-300bps, allowing the 10y note to float around the 130-150bps range provided the spread between the 10s and long end remains constant.
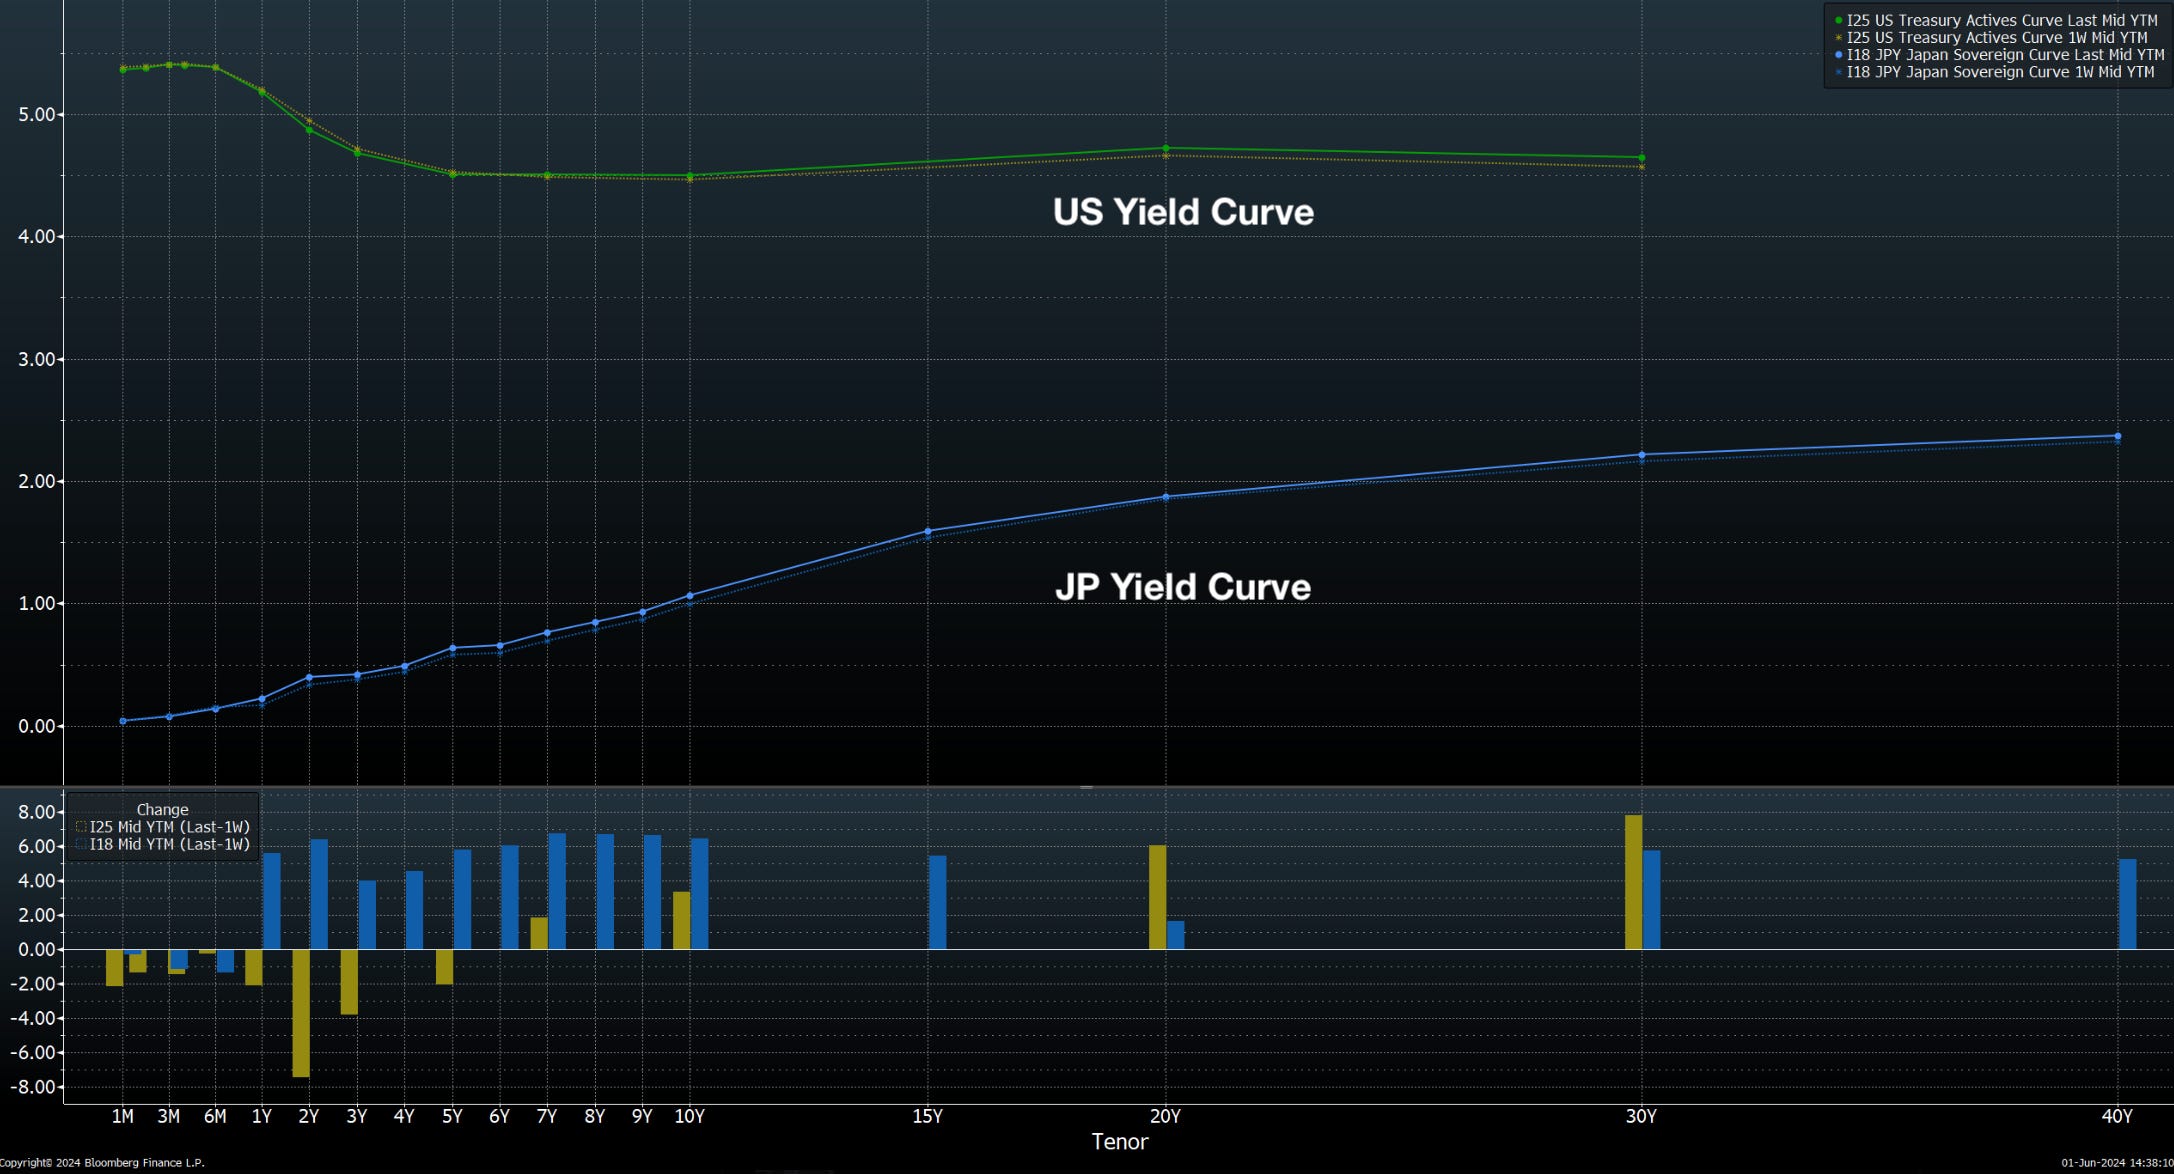
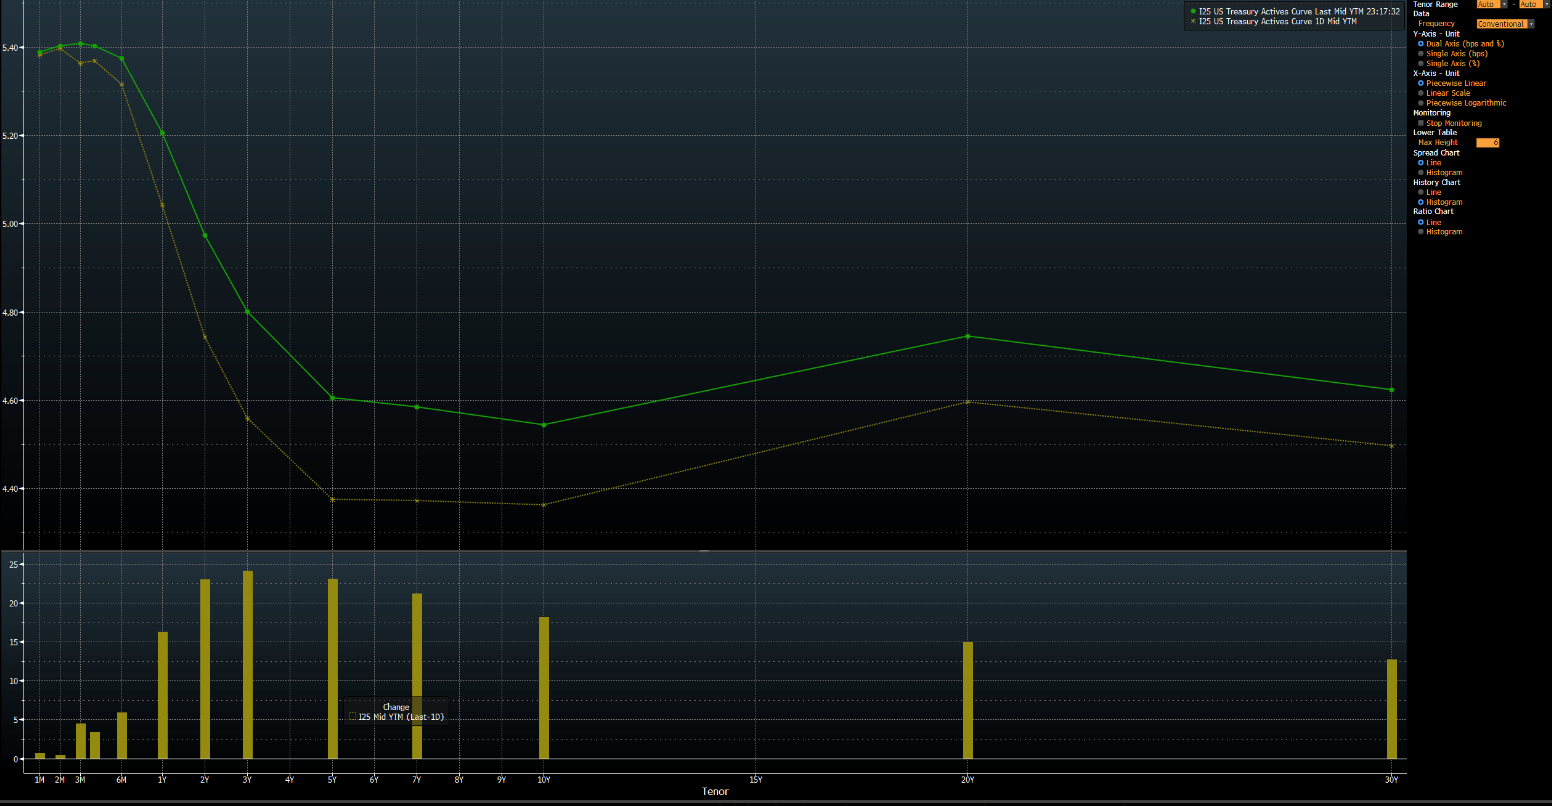
The yield curve above shows both the US & Japan curve. We’ll focus on the blue line, Japan’s curve.

As seen in Figure 12, the Japanese yield curve has undergone a substantial steepening over the past 12 months.
One thing to remember is that markets are more elastic than we like to think. We often envision a specific point where things fall apart, debt becomes unbearable, or the whole economy craters. But history keeps teaching us a valuable lesson: that breaking point seems to keep getting pushed further out.
Take 2022 for example. Everyone thought the Fed's terminal rate would be a measly 3%, then they panicked and revised it to 4%, swearing anything higher would be the end. Guess what? Rates hit 5.5%.
The truth is, many macro traders fall prey to two common fallacies: the constant fear of a market meltdown and the impossible task of predicting a central bank's terminal rate (spoiler alert, you can't).
Instead, we should focus on the incoming data – inflation and consumer trends in Japan, for instance. This tells us the real direction of policy, not some mythical breaking point.
One thing's for sure: the current 10-year yield of 96 basis points is a far cry from where I see fair value, which lies within the region of 130 basis points.
I hope you enjoyed this read— I’ll be analysing the central bank movements in my report tomorrow