
The Fed Hike Is Broken
Reviewing the U.S ADP figures and the fundamental flaw with the Fed tightening

Hey crew,
I know, I missed you last week with a macro report.
So I’ve got two treats for you to make up for it.
I will open next week’s deep dive Thursday report for all MMH subscribers. This exclusive report is usually only available to MMH Pro members, but I wanted to give you a special insight into the valuable lessons covered within MMH Pro. If you haven't already, this is the perfect opportunity to check it out here!
For those of you who have an interest in macro trading and want to learn more about how it works in the institutional playing field, I have something special for you too. Every Monday, I'll be posting a blog on my website that delves into the fascinating world of macro trading strategies used by hedge funds and trading desks. It's a chance to gain a deeper understanding of the concepts behind macro trading and stay up-to-date with the latest trends.
Onto the more concerning, we’ve seen huge movement across yields, equities and FX this week stemming from the ADP employment figure yesterday. So let’s uncover this.
As always, lend me your attention:
Good Data Is Bad Data.
Let’s rewind just over a week ago, Sintra Portugal, where the four most powerful central bankers met for a forum on central banking led by Christine Lagarde. Jay Powell reaffirmed his hawkish stance during the conference whilst sharing what markets would have deemed rather a pessimist view of core inflation:
“I don’t see us getting back to 2% this year or next year”
“We’re a long way from that, it’s not something we’re thinking of now or in the near future” referring to a Fed pivot
—Fed Chair Powell
In the immediate aftermath of his comments markets were unchanged, almost shrugging off a clear message that there will not be any Fed pivot in the upcoming meetings leading through to 2024.
After reading the FOMC minutes released on Wednesday and seeing the reaction markets had after the ADP data came out yesterday it’s clear to see that good data is bad data right now. A simple concept, but gets deeper the more you dig in.
ADP non-farm payroll came out at 497k vs 228k forecast, and yields immediately took off.
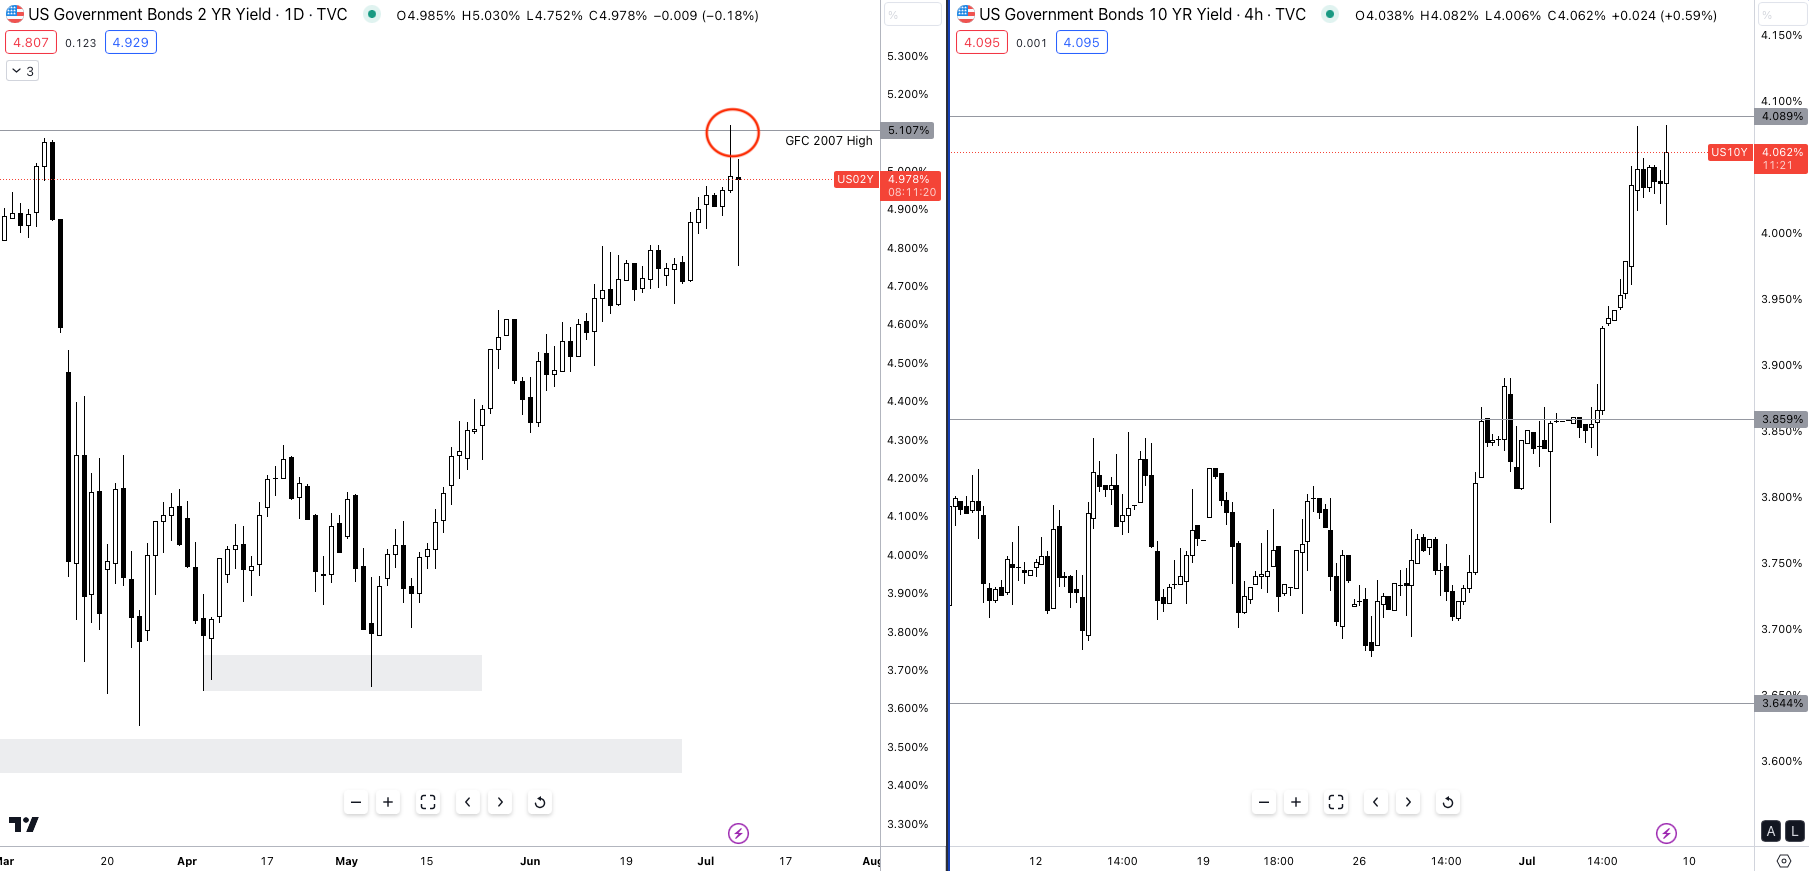
After ADP figures, private sector jobs, came out this sent bond markets into a panic, 2y yields soared to as high as 5.100%! That’s a 16-year high not seen since the 2007 GFC, the 10y also rose to over 4.050%, and this week alone the 10y has risen just over 20bps.
What is this signalling and what does this mean?
Investors are positioning for more Fed hikes based on persistently strong labour data which may lead to withdrawal from high beta assets in the near-medium term
Greater risks and fragmentation within the economy may arise due to the realisation of higher interest rates within the U.S
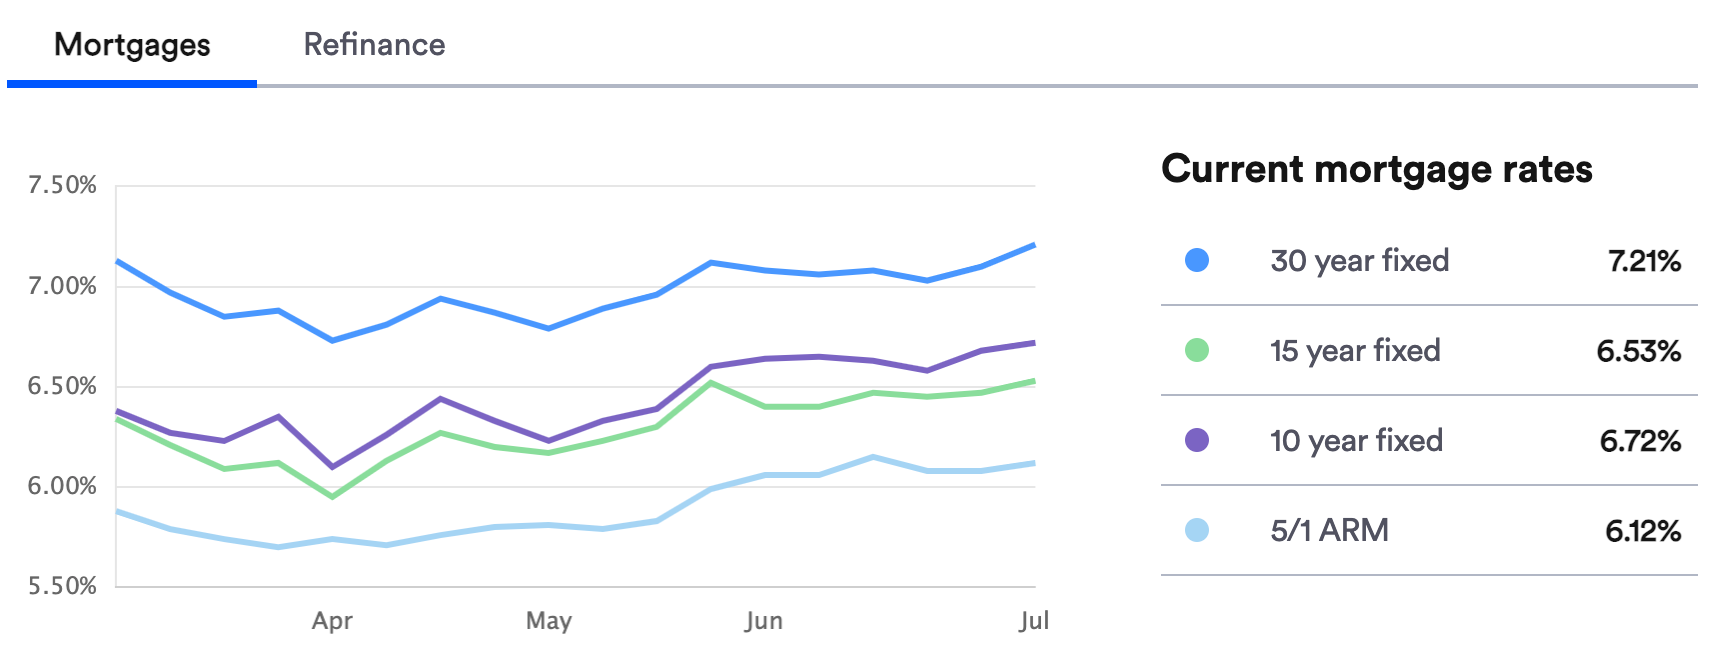
Conditions will tighten even more for the U.S consumer with mortgage rates peaking well above 7.00% for 30y fixed
This was the event across bond markets on Thursday, and as you can imagine if yields across the front and long end are soaring reaching multi-decade highs this will cause a spike in volatility.
The MOVE index is a chart I love to analyse during times of increased vol, and on Thursday we witnessed the largest single-day spike in bond volatility since the banking collapse of March which triggered a $150bn banking borrowing spree from the Fed discount window.
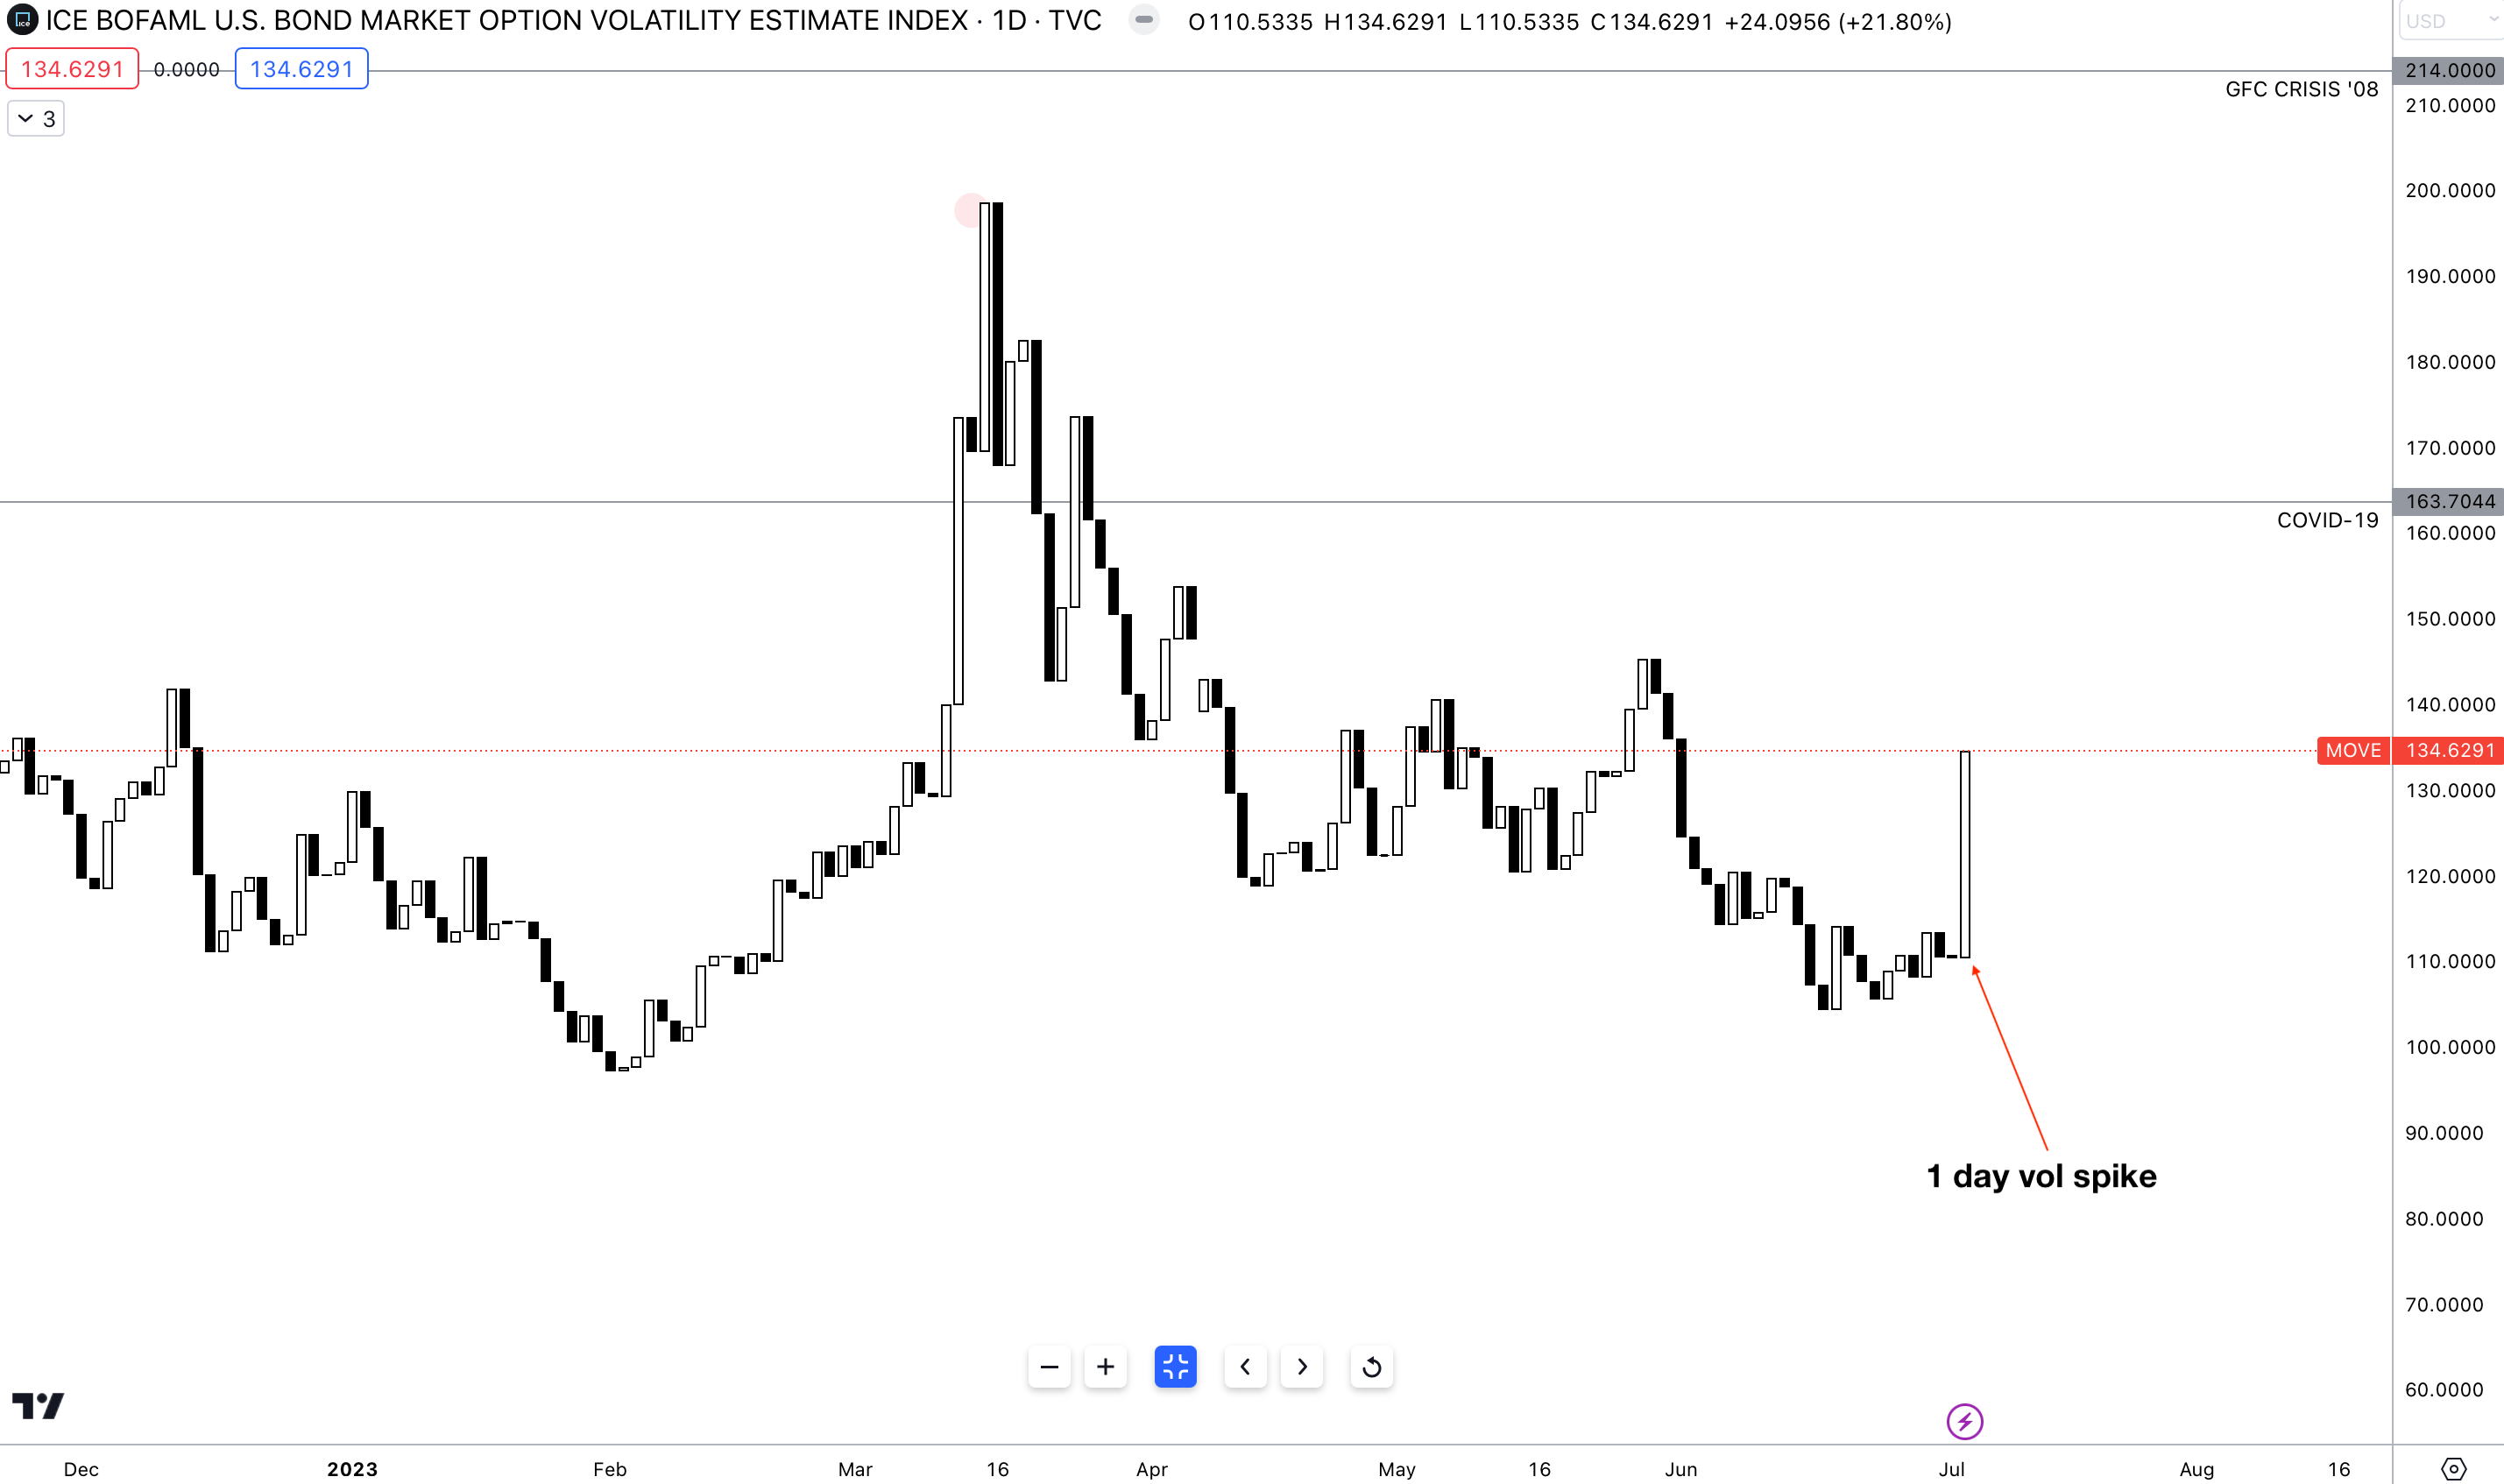
For those new subscribers, firstly shoutout to you, this chart is familiar to the OG subscribers, so let me explain its’ importance and meaning.
The MOVE index is an index that measures bond market volatility within the U.S, similar to how you have the VIX to measure volatility within equities, you have the MOVE index to measure volatility within the bond market. Bond volatility is always bad for bonds and markets, mainly because higher volatility increases the uncertainty associated with investing in bonds as heavy fluctuations in the price of a bond also make yields unstable.
So when you see such a huge increase in the MOVE index that is a caution to tread carefully.
It’s clear that we will likely see rates close to if not 6% by the end of the year, but the only way inflation can consistently trend towards the 2% target is if credit conditions effectively mirror the Fed’s policy stance.
One key way of observing credit within the economy is the NFCI (national financial conditions index), but if you want to take it a step further you can track private sector credit spreads.
You see, credit spreads are an incredibly important variable to monitor if we want to truly understand what part of the credit cycle we’re in. Narrow credit spreads imply borrowers can access credit both easily and cheaply, while widening credit spreads imply getting a hold of credit is difficult which is what the Fed is aiming to do.
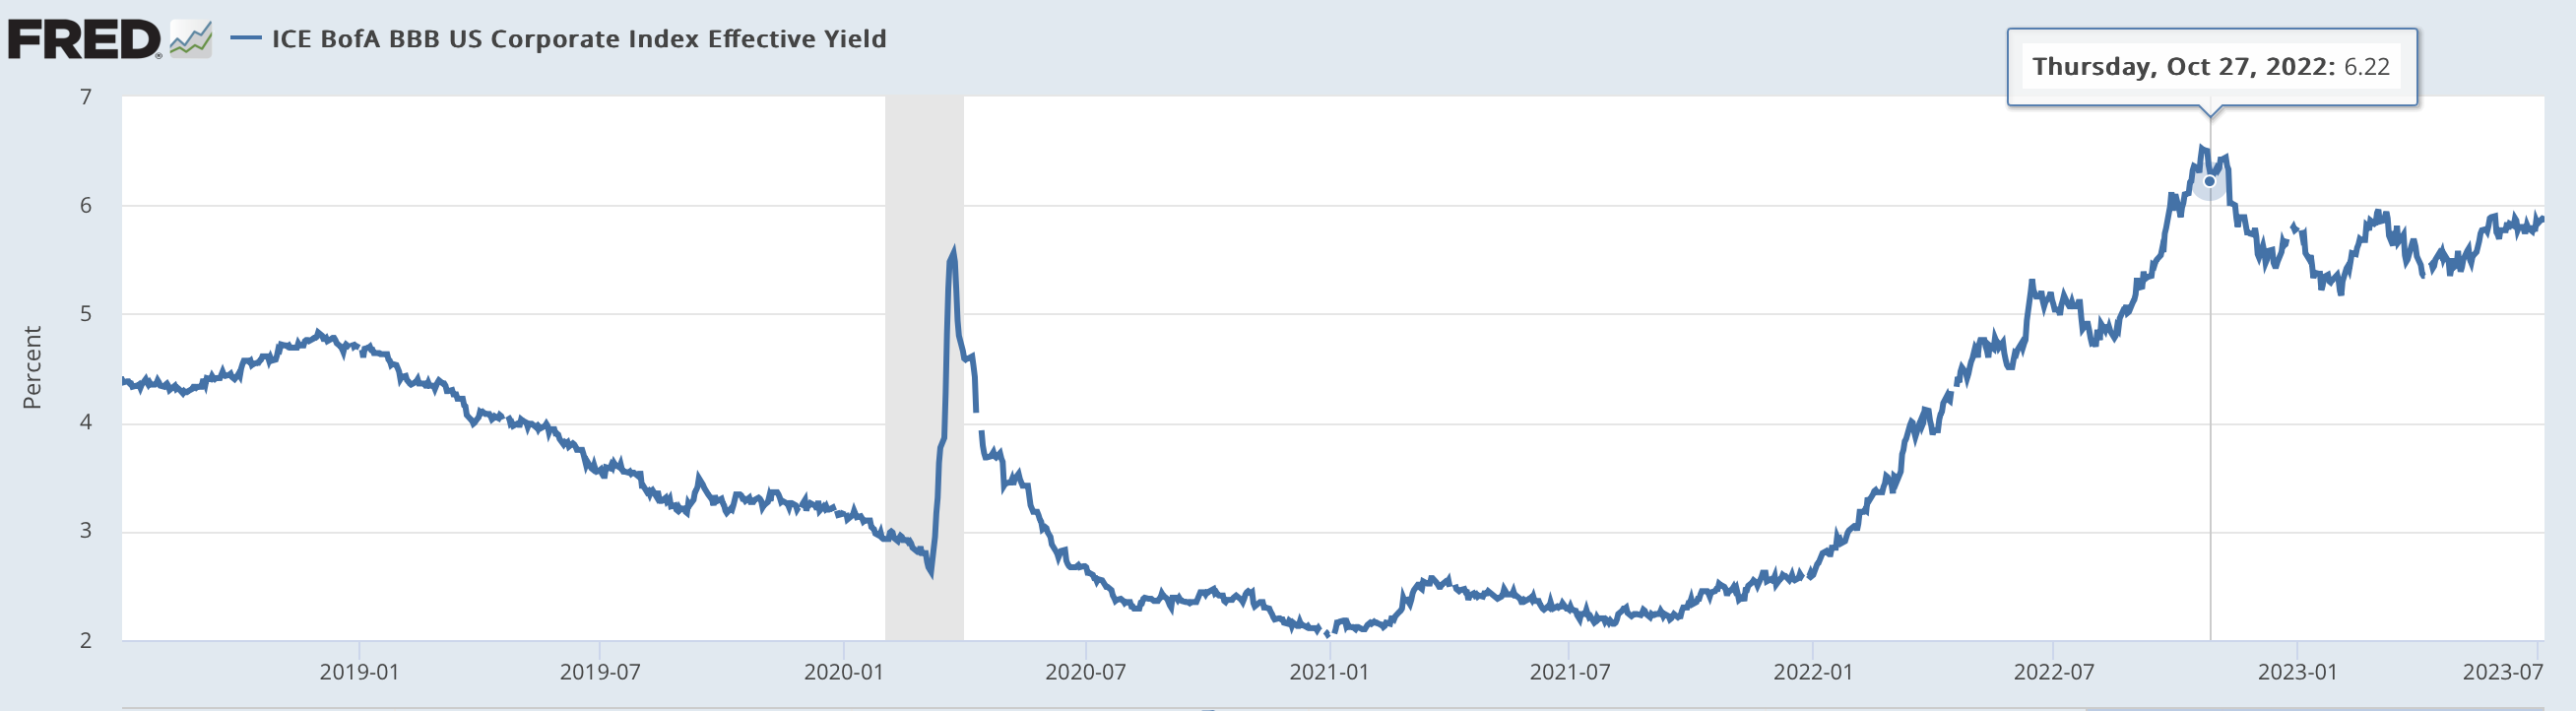
October 2022 marked a pivotable change in global macro conditions. Everything immediately reversed from tighter conditions to loose conditions providing markets with some form of support. Credit conditions for corporations in the private sector peaked in October reaching a low at the start of February before gradually rising to a level where credit spreads have been consolidating.
On Wednesday the FOMC released their minutes from the June 13-14 meeting, and I read something worth sharing with you all.
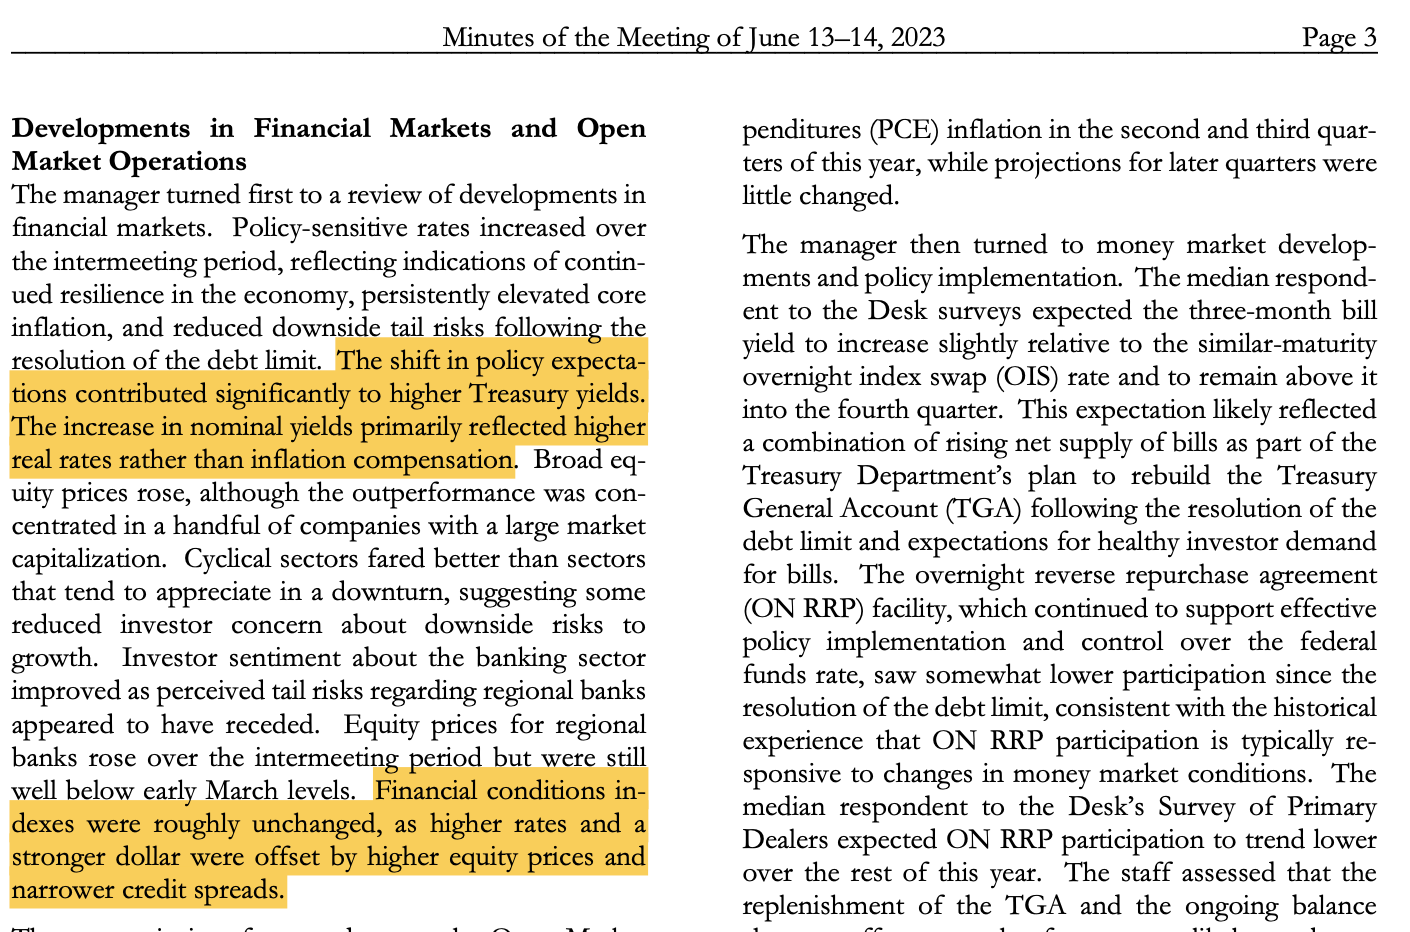
If you want to learn what to look at, just look right at the source. Focus your attention on the second highlighted statement at the bottom of the extract
"financial condition index unchanged, as higher rates and a stronger dollar were offset by higher equity prices and narrower credit spreads.”
So what exactly is the problem here? Narrower credit spreads.
It’s clear that corporate credit spreads must widen and go past October highs in order to allow the tightening of monetary policy to be felt by the wider financial system, if this doesn’t happen, we will have equities continue to outperform to the upside, the Fed continue hiking until some form of colossal event and financial conditions remain unchanged.
So with the Fed’s focus primarily on rates, something I will be watching will be national financial conditions as a broad index, credit spreads for corporations and mortgage rates which shows how tight conditions are for households/individuals to access credit, something which has actually moved in line with the Fed’s goal of tighter conditions.
Guys, I hope you enjoyed this piece breaking down the current macro climate and what I’m watching.
If you enjoyed this piece then please
and let me know your thoughts below!