
The Beauty of Leading Indicators
"You can't connect the dots looking forward, but you sure can predict the future."

Hey guys,
It’s been one heck of a week.
Here’s one sentence which changed my perspective.
Extreme people get extreme results.
Remember that the next time you feel like you’re back is against the wall.
Today’s report will focus on unveiling the importance behind leading indicators and how we can use such data to create high-probability market scenarios.
Forward-Looking Data Points
Overlooking certain economic data points because they’re not deemed as ‘important’ is a common mistake traders, analysts and market participants make. The main reason this happens is due to something we all fall victim to; ignorance.
Within the world of macro data, you can separate every single data point into two subsets. Lagging and leading indicators. Lagging data is economic data that is released after the event it measures has already occurred. Some examples are:
GDP growth
Unemployment rate
CPI
Retail sales
Industrial production
Noticing a trend here?
They’re all looking back at previous conditions, usually a month lag until the data is released. The fundamental flaw with lagging indicators is that they cannot be used to predict future economic conditions, they can however be used to confirm macro trends and asses the implications of monetary policy decisions on the real economy.
As many of us would agree, once we all started learning about macro our focus was specially tuned towards non-farm payroll data, interest rate decisions and GDP figures; mainly because the first two readings would produce short-term vol within markets which as a newbie can be extremely exciting, (yet frankly stupid), which cemented which data points we would pay attention to.
The beauty of leading indicators is one of great simplicity but one of great importance. To understand where an economy may be headed to keeping such data points at the tip of your focus is essential. A few examples of leading indicators are:
ISM/PMI data
PPI
Consumer/business confidence surveys
M2 growth
Just yesterday we had the perfect example, with the CPI print.
Not many would have picked up on this, so if you did, good spot.
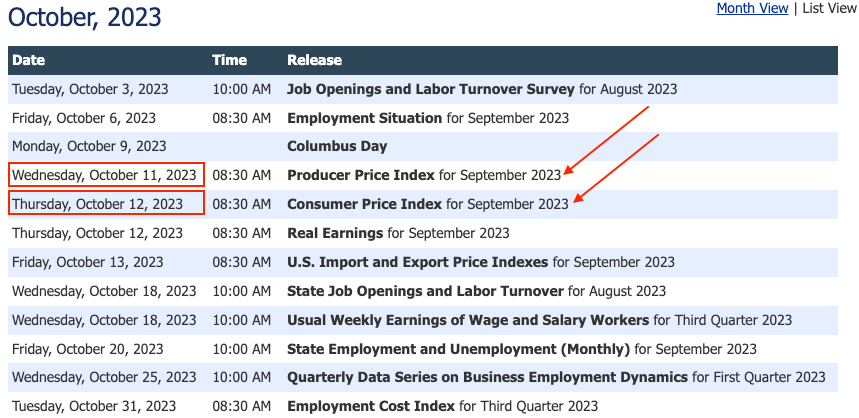
PPI was released before CPI?!
Now, as a matter of fact, US CPI is usually released on the second Wednesday of each month, which lands anywhere between the 12th - 14th of each month, with the PPI print coming out a day later.
Take a look at last month’s schedule.
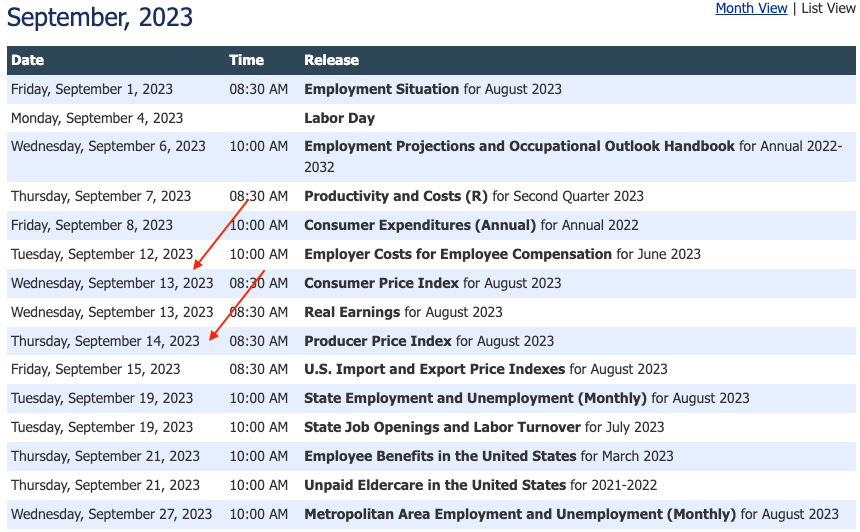
CPI released before PPI.
I know what you’re thinking, “what’s the significance Joe?” let me explain.
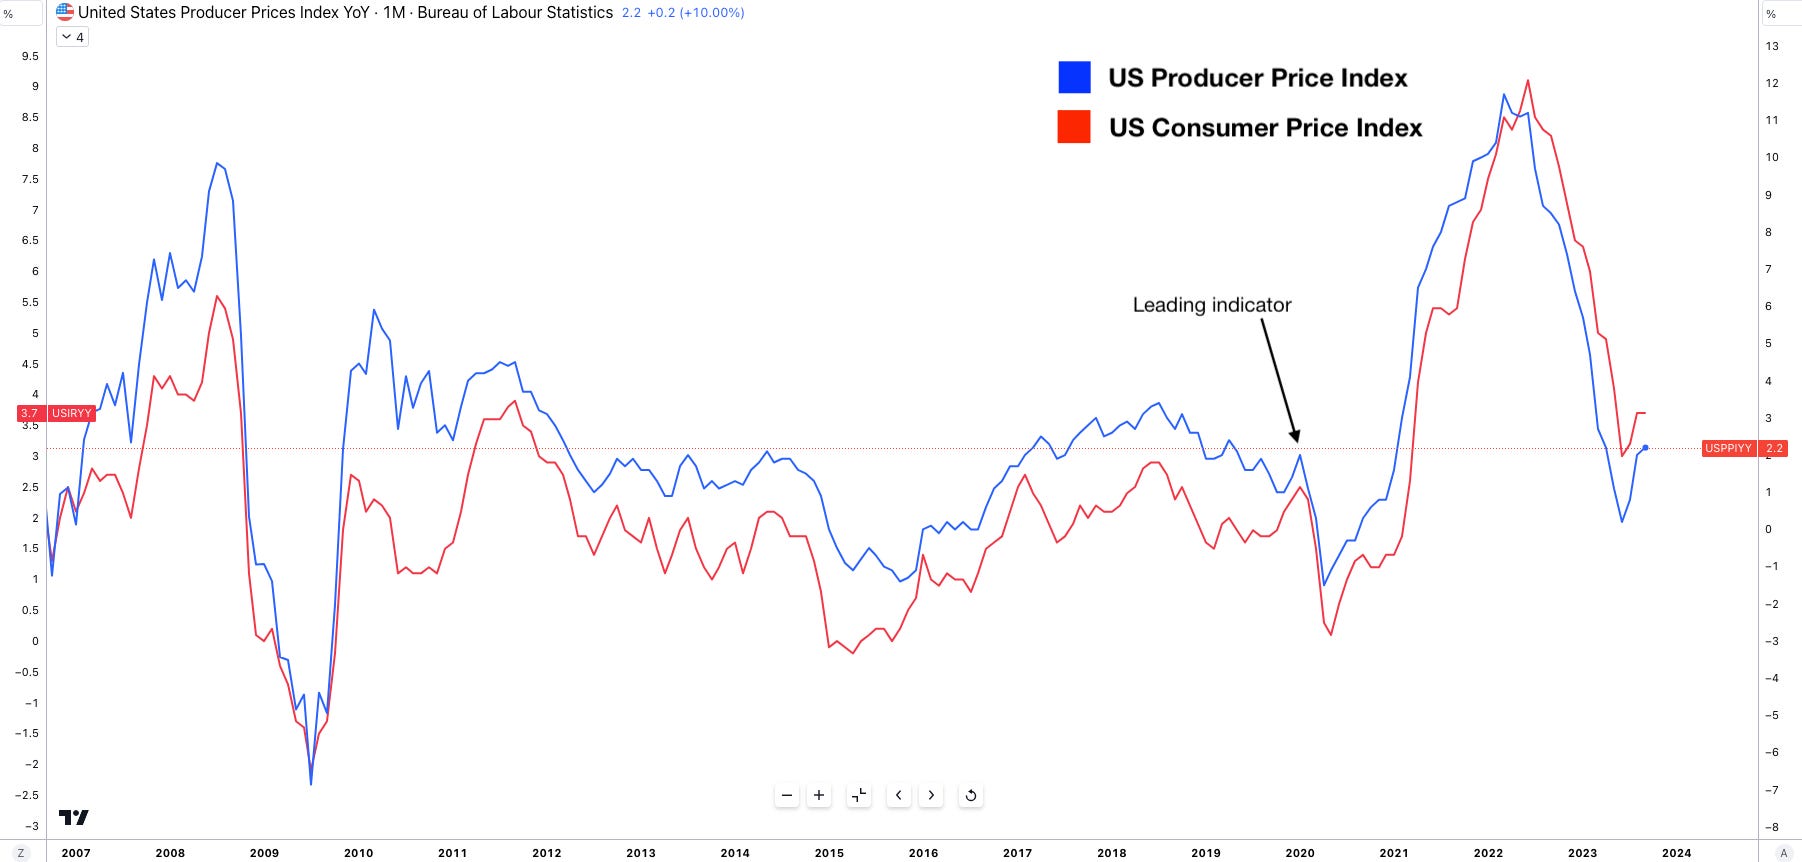
The Producer Price Index (PPI) measures inflation at the wholesale level, meaning it tracks the prices that producers receive for their goods and services. As PPI rises, it signals that inflation is likely to continue rising in the wider economy, as producers are the first group to experience changes in the cost of inputs. So, in this instance where PPI was set to be released prior to the CPI print, my thought process was straightforward. If PPI increases more than the consensus then there is an 80-90% probability that CPI would also surprise to the upside.
On Wednesday PPI MoM increased 0.5% vs 0.3% consensus. And on a year-over-year unadjusted basis producer prices rose 2.2% for the 12 months ending in September 2023.
Here’s a breakdown of what caused this month-over-month increase.
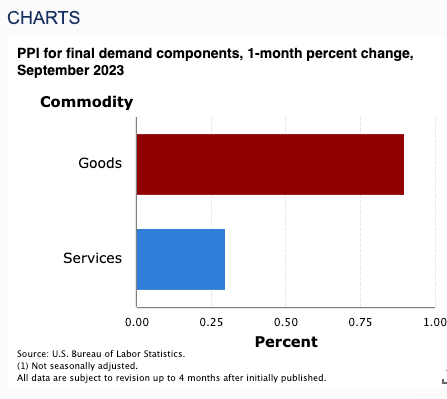
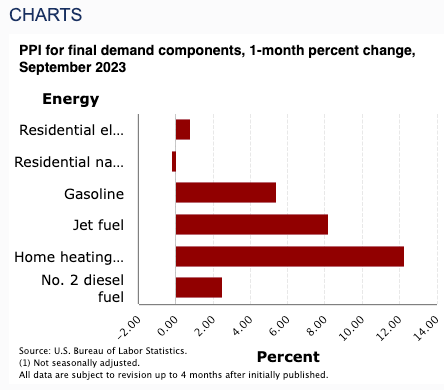
Instantly you can see it was commodity goods that contributed most to the 1-month PPI change. As a side note, commodity goods are raw materials or basic goods that can be used for different purposes. The image above is a breakdown of what segments within the commodity goods (energy) caused the uptick in PPI.
The cost of home heating oils and jet fuels was both 12% and 8% more expensive over the month of September. As of no surprise, both these fuels are made from crude oil.
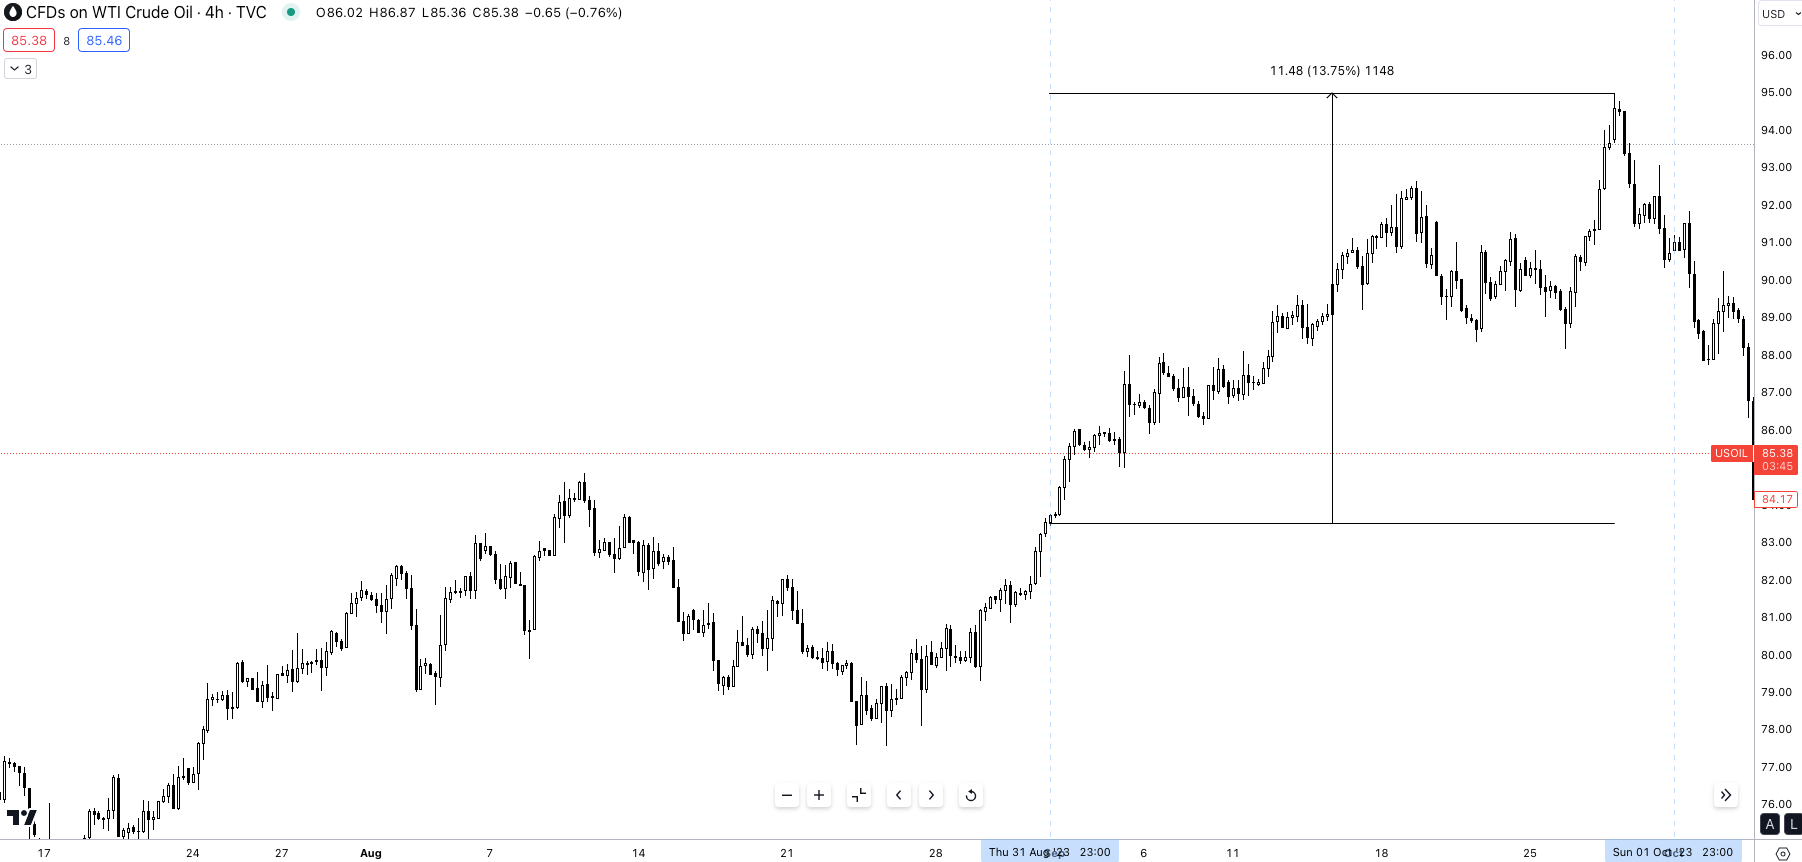
With this understanding in mind, when looking at how crude oil traded throughout September it’s clear as to why producer prices were more expensive. Oil peaked at $94.00 p/b, up 13.75% throughout the month of September. Now when we tie this back to CPI, PPI is a leading indicator for US CPI so the question arises, how would markets react to a hot CPI print?
Simple.
The result would be higher yields in anticipation that higher inflation means the Fed will have to keep the flow of financial conditions relatively tight and of course, a buoyant dollar as yields increase dollar strength.
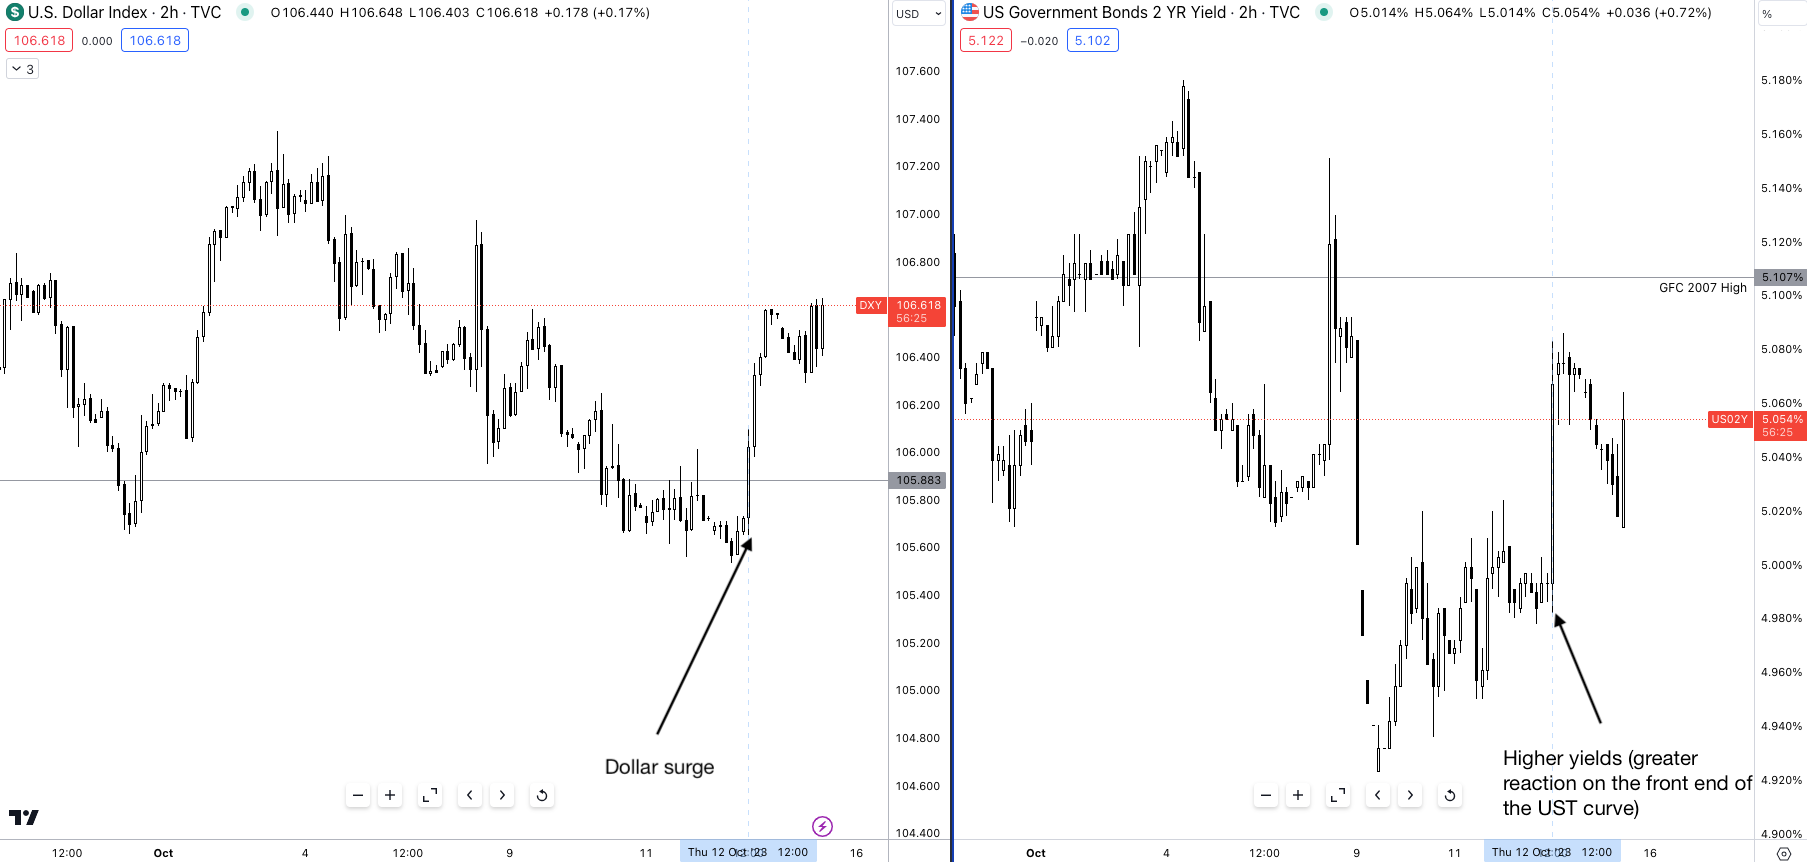
As you can see, the 2y treasury rallied just under 8bps from the CPI release until now, showing the adjustment of the market to a higher print.
From this report I hope to have highlighted the importance of following leading indicators, even seeking them to try and extrapolate how certain economic trends may be such as inflation and economic growth.
That’s it for today crew, I’ve got a deep dive report lined up for next week so be on the lookout for that!
Great breakdown as always Joe 🙏
Amazing Value !