



Today's Tear Sheets
The full daily pack is attached below · six PDFs generated from the same computed data set as this note:
Macro Regime · curve regimes, growth x inflation quadrant, breadth, credit, vol term structure, liquidity, stock-bond correlation, crypto cross-asset, housing
Fixed Income · UST complex, global curves, Fed/ECB/BoE/BoJ implied policy paths, global 2Y and 10Y panels
Equities · index pages, relatives, vol suite, global relatives, Mag7+ quant sheet, options surfaces
FX · majors dashboards, correlations, COT positioning, crosses
Commodities · energy, metals, agriculture, COT crowding, term structure
Crypto · BTC ladders, ETH, macro correlations, ETF flow proxy

TL;DR
Long the hike story, November at 56% is the first hike half-priced and no cut sits anywhere on the strip.
Nasdaq +2.83% on Meta and AMD is a narrow tech bid, I respect the run but the model call on S&P is gated.
Gold stays my hedge, the link to duration tightened to -0.42 and that is what I want it doing.
IG at 77bp anchors me, invalidation stays 90bp and credit is flagging no stress.
Watching 2s10s at 25bp, it flattened 8bp on the week, and only a turn back to steepening would confirm the market doubts the full tightening path.
Where We Stand
Yesterday I stayed long the hike story, November at 56% as the first hike half-priced with no cut anywhere on the strip. This morning's tape does not challenge that, it leans into it. The 2Y sits at 4.76%, up 9bp on the day and 13bp on the week, and the 10Y is at 5.01% after adding 7bp. My oldest open thesis, gold appreciating as dollar strength moderates, stays intact with the gold to dollar link now at -0.65. The Fed thesis that the full path will not print is CHALLENGED by the terminal at 4.76%, but the +30.5bp weekly repricing is the crowding I want to fade, and I am keeping it open. The 2s10s at 25bp is flattening, down 2bp on the day and 8bp on the week, so my steepener trigger has not fired and I'm holding.
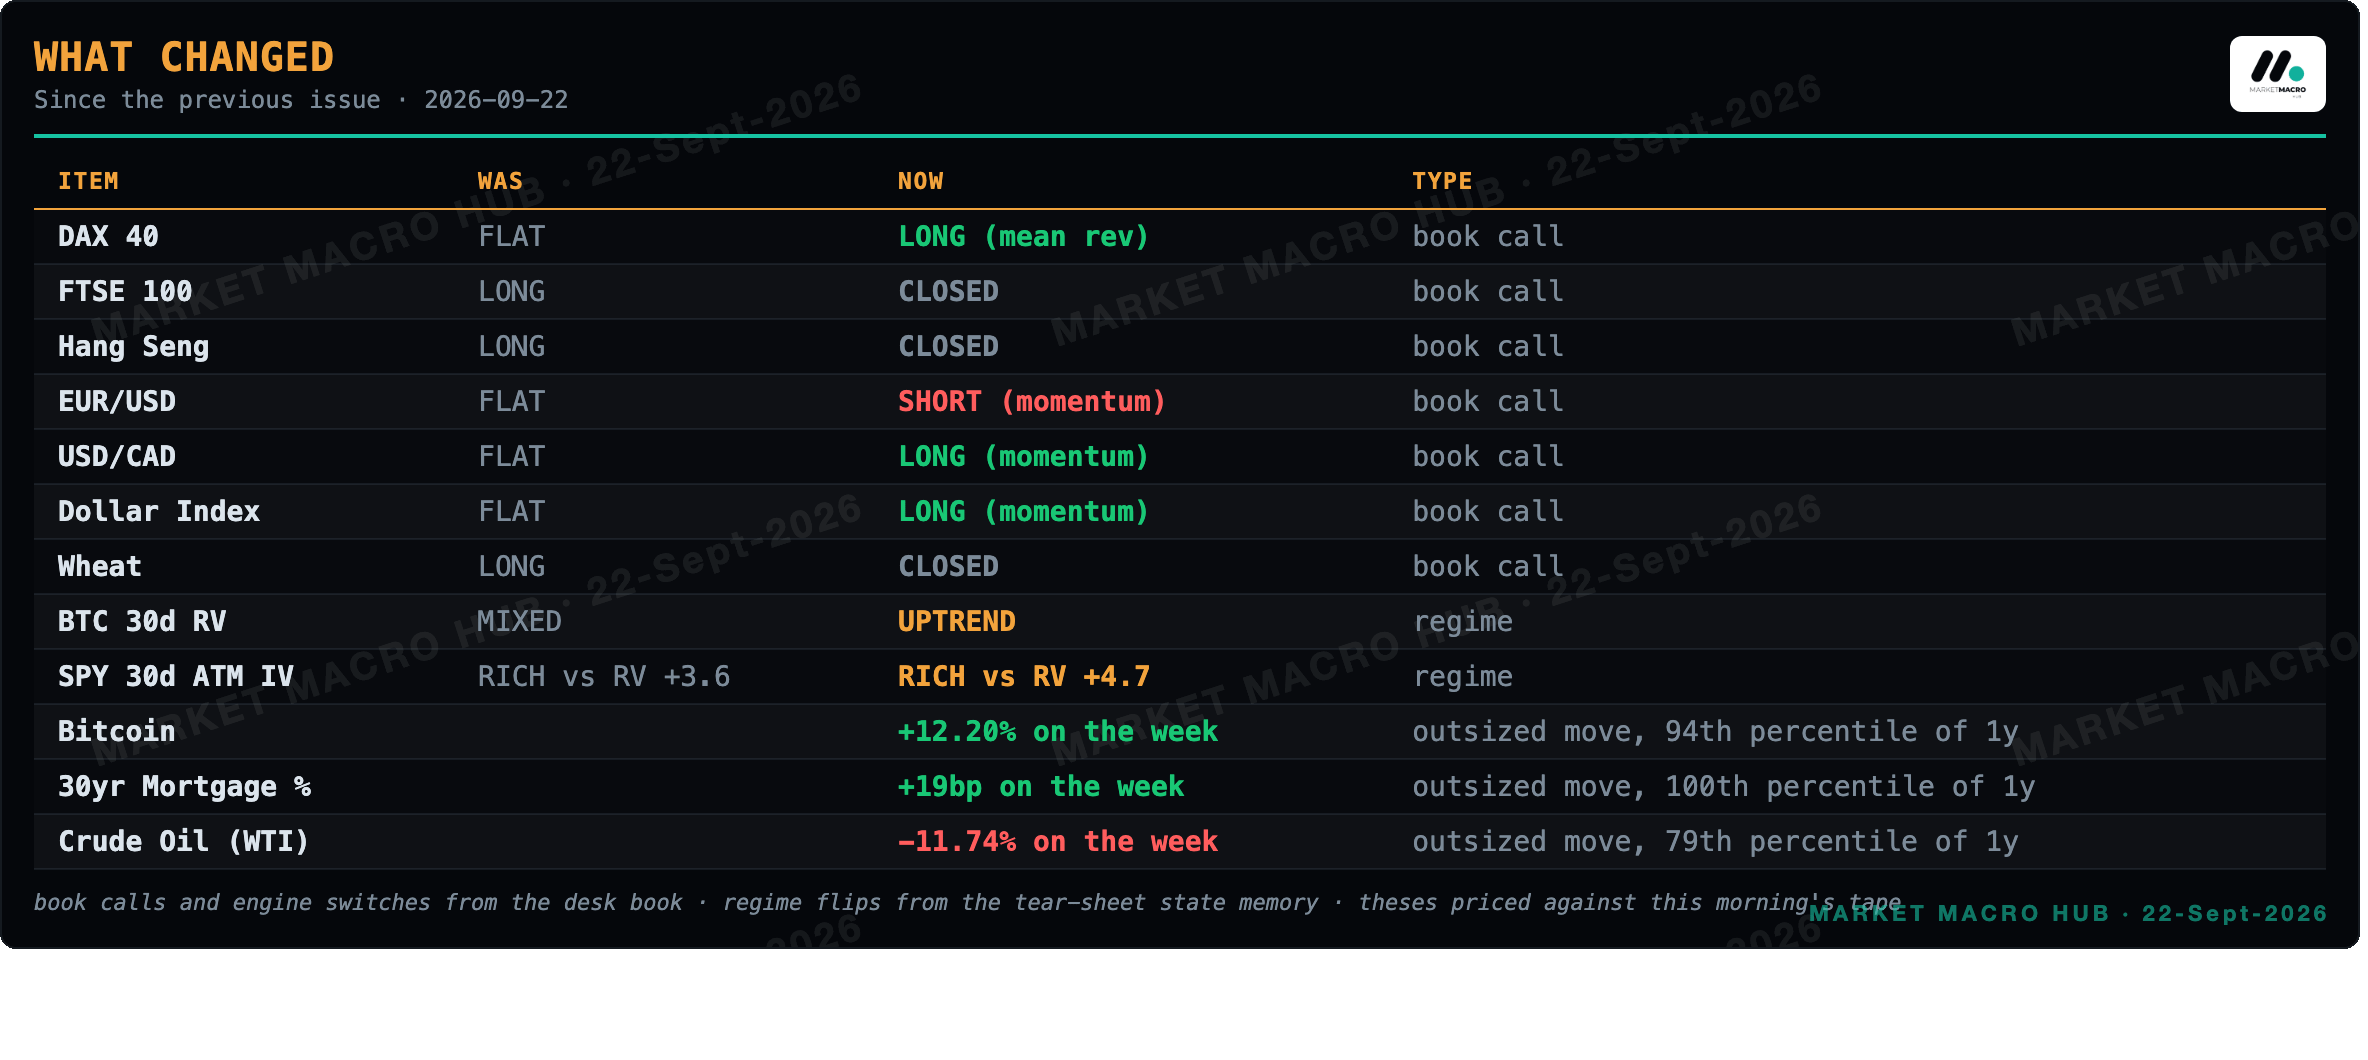
What Changed
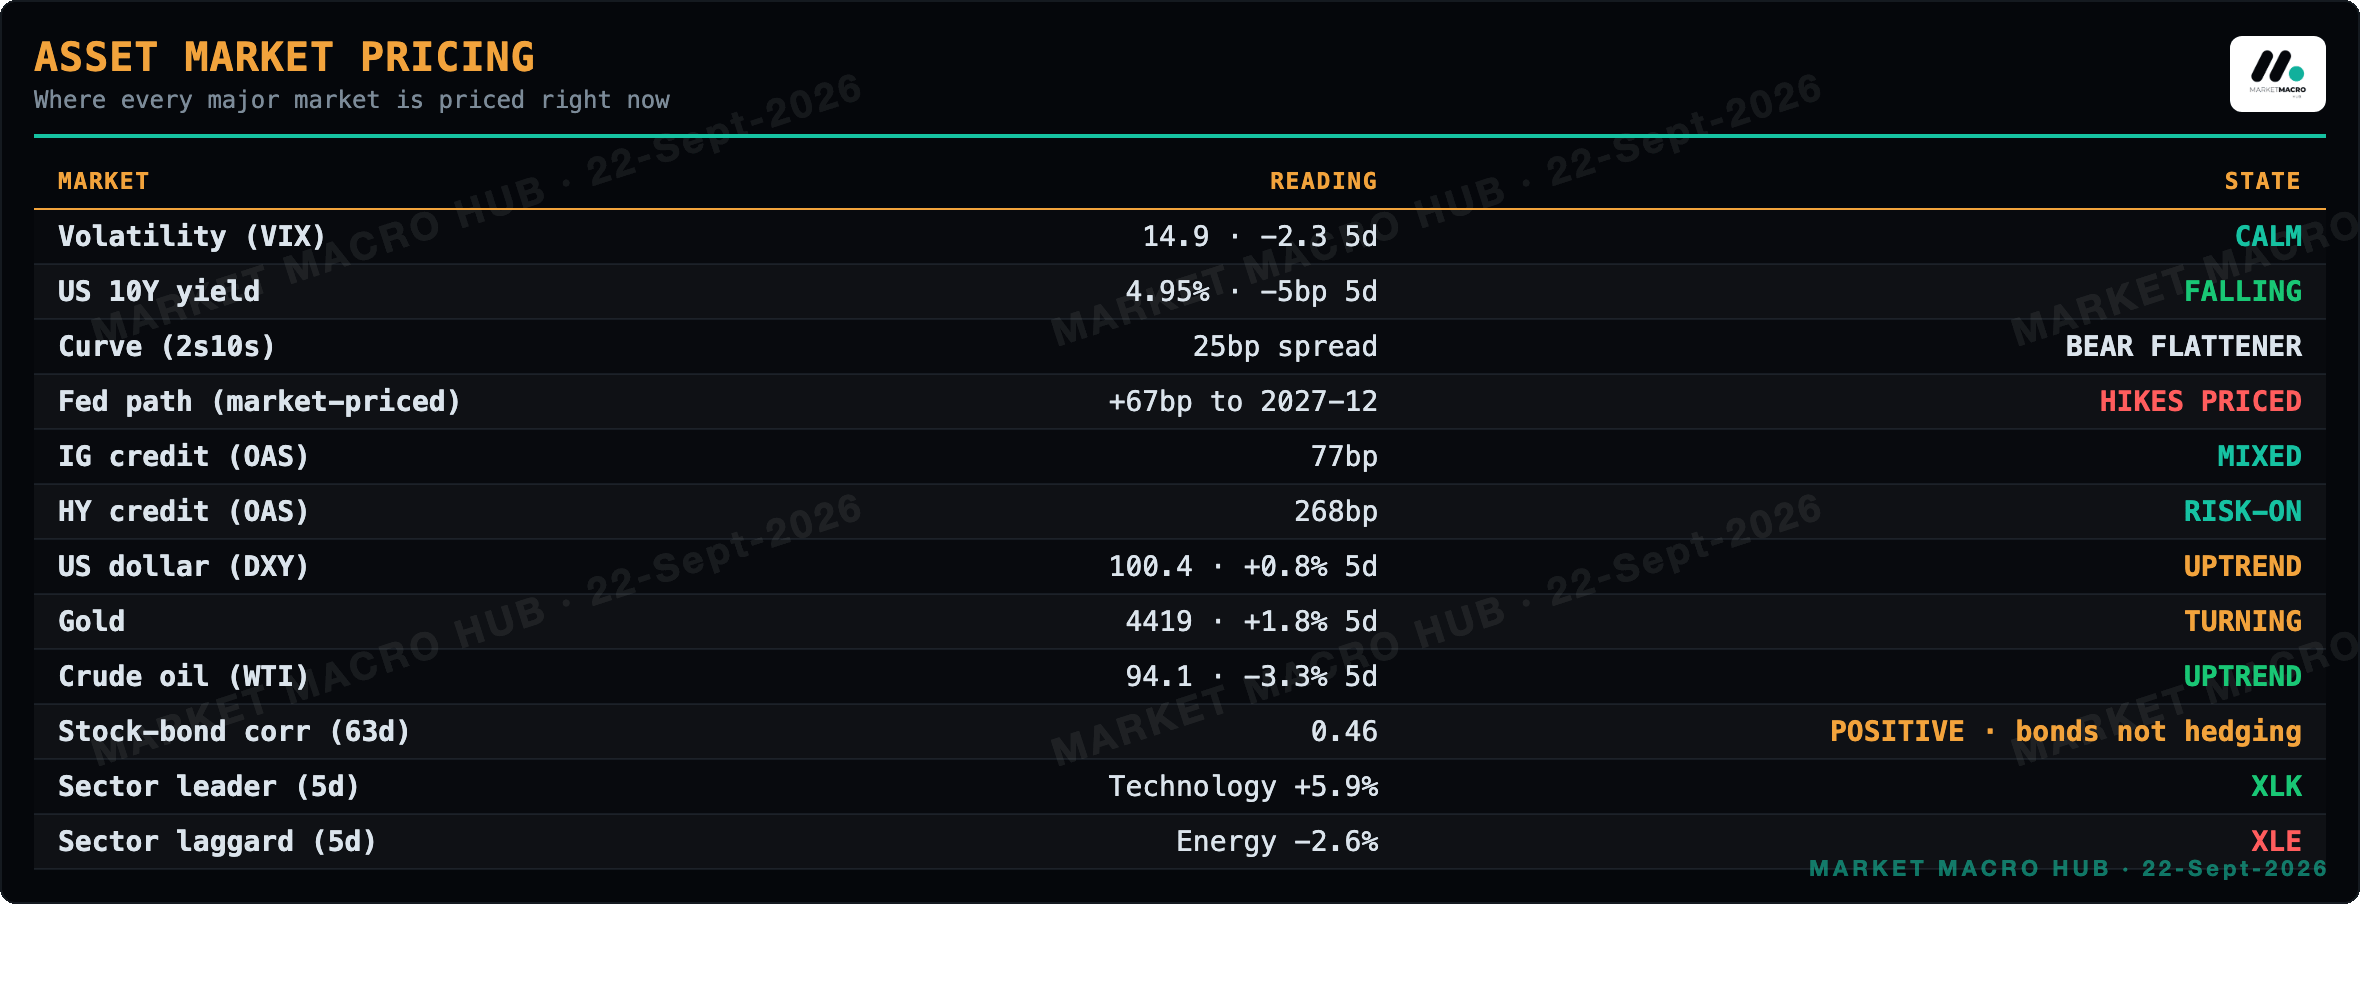
Asset Market Pricing
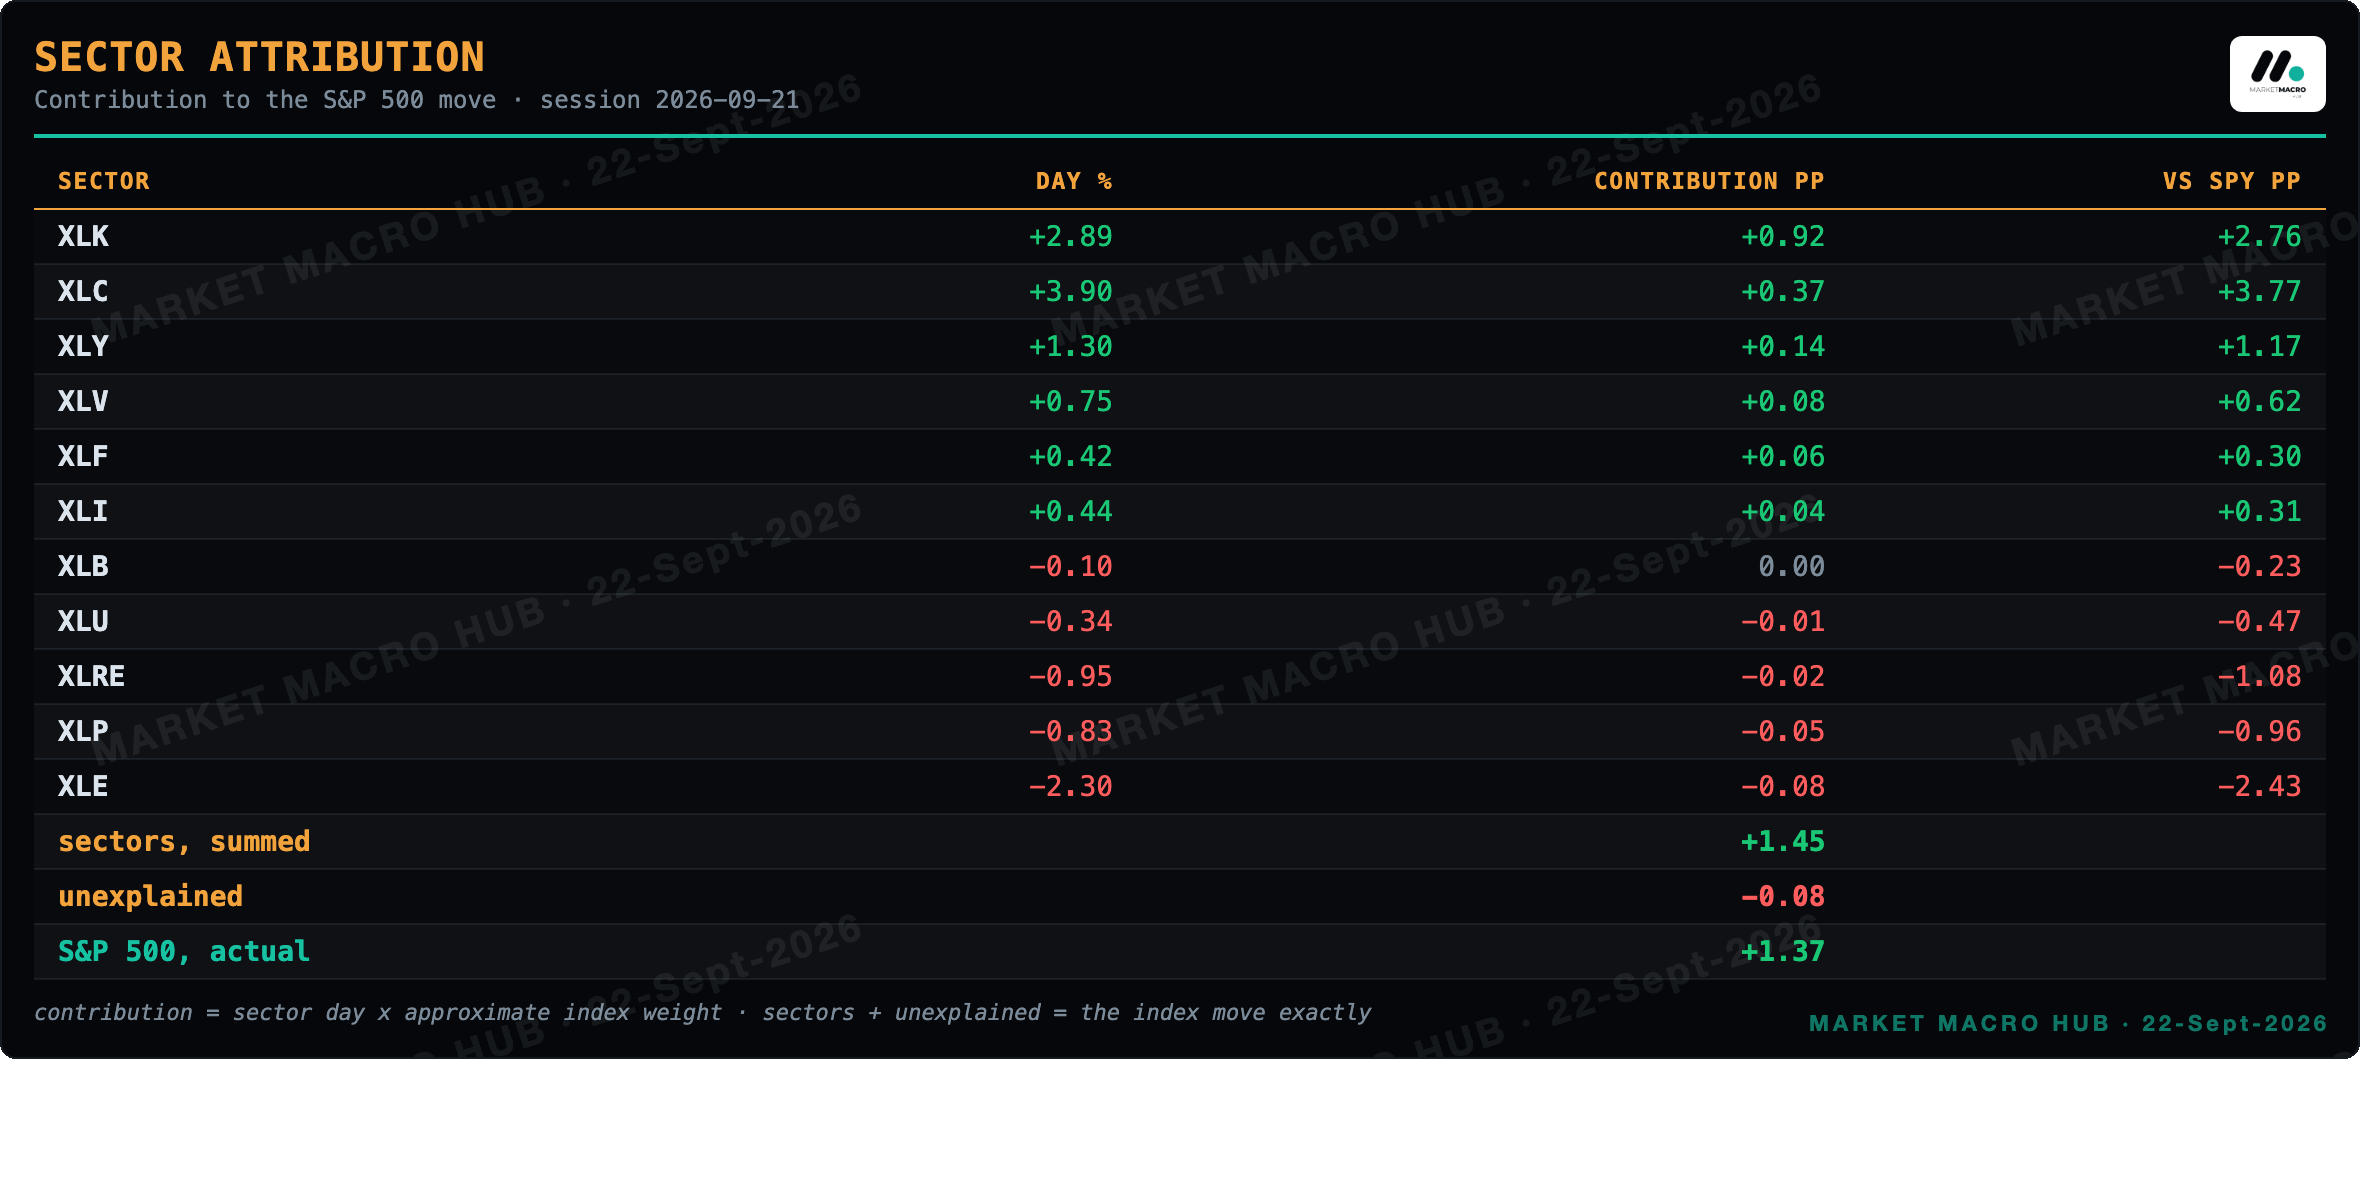
Sector Attribution
Session 2026-09-21. Sectors plus the unexplained remainder sum to the index move, and the sector split accounts for 94% of it.
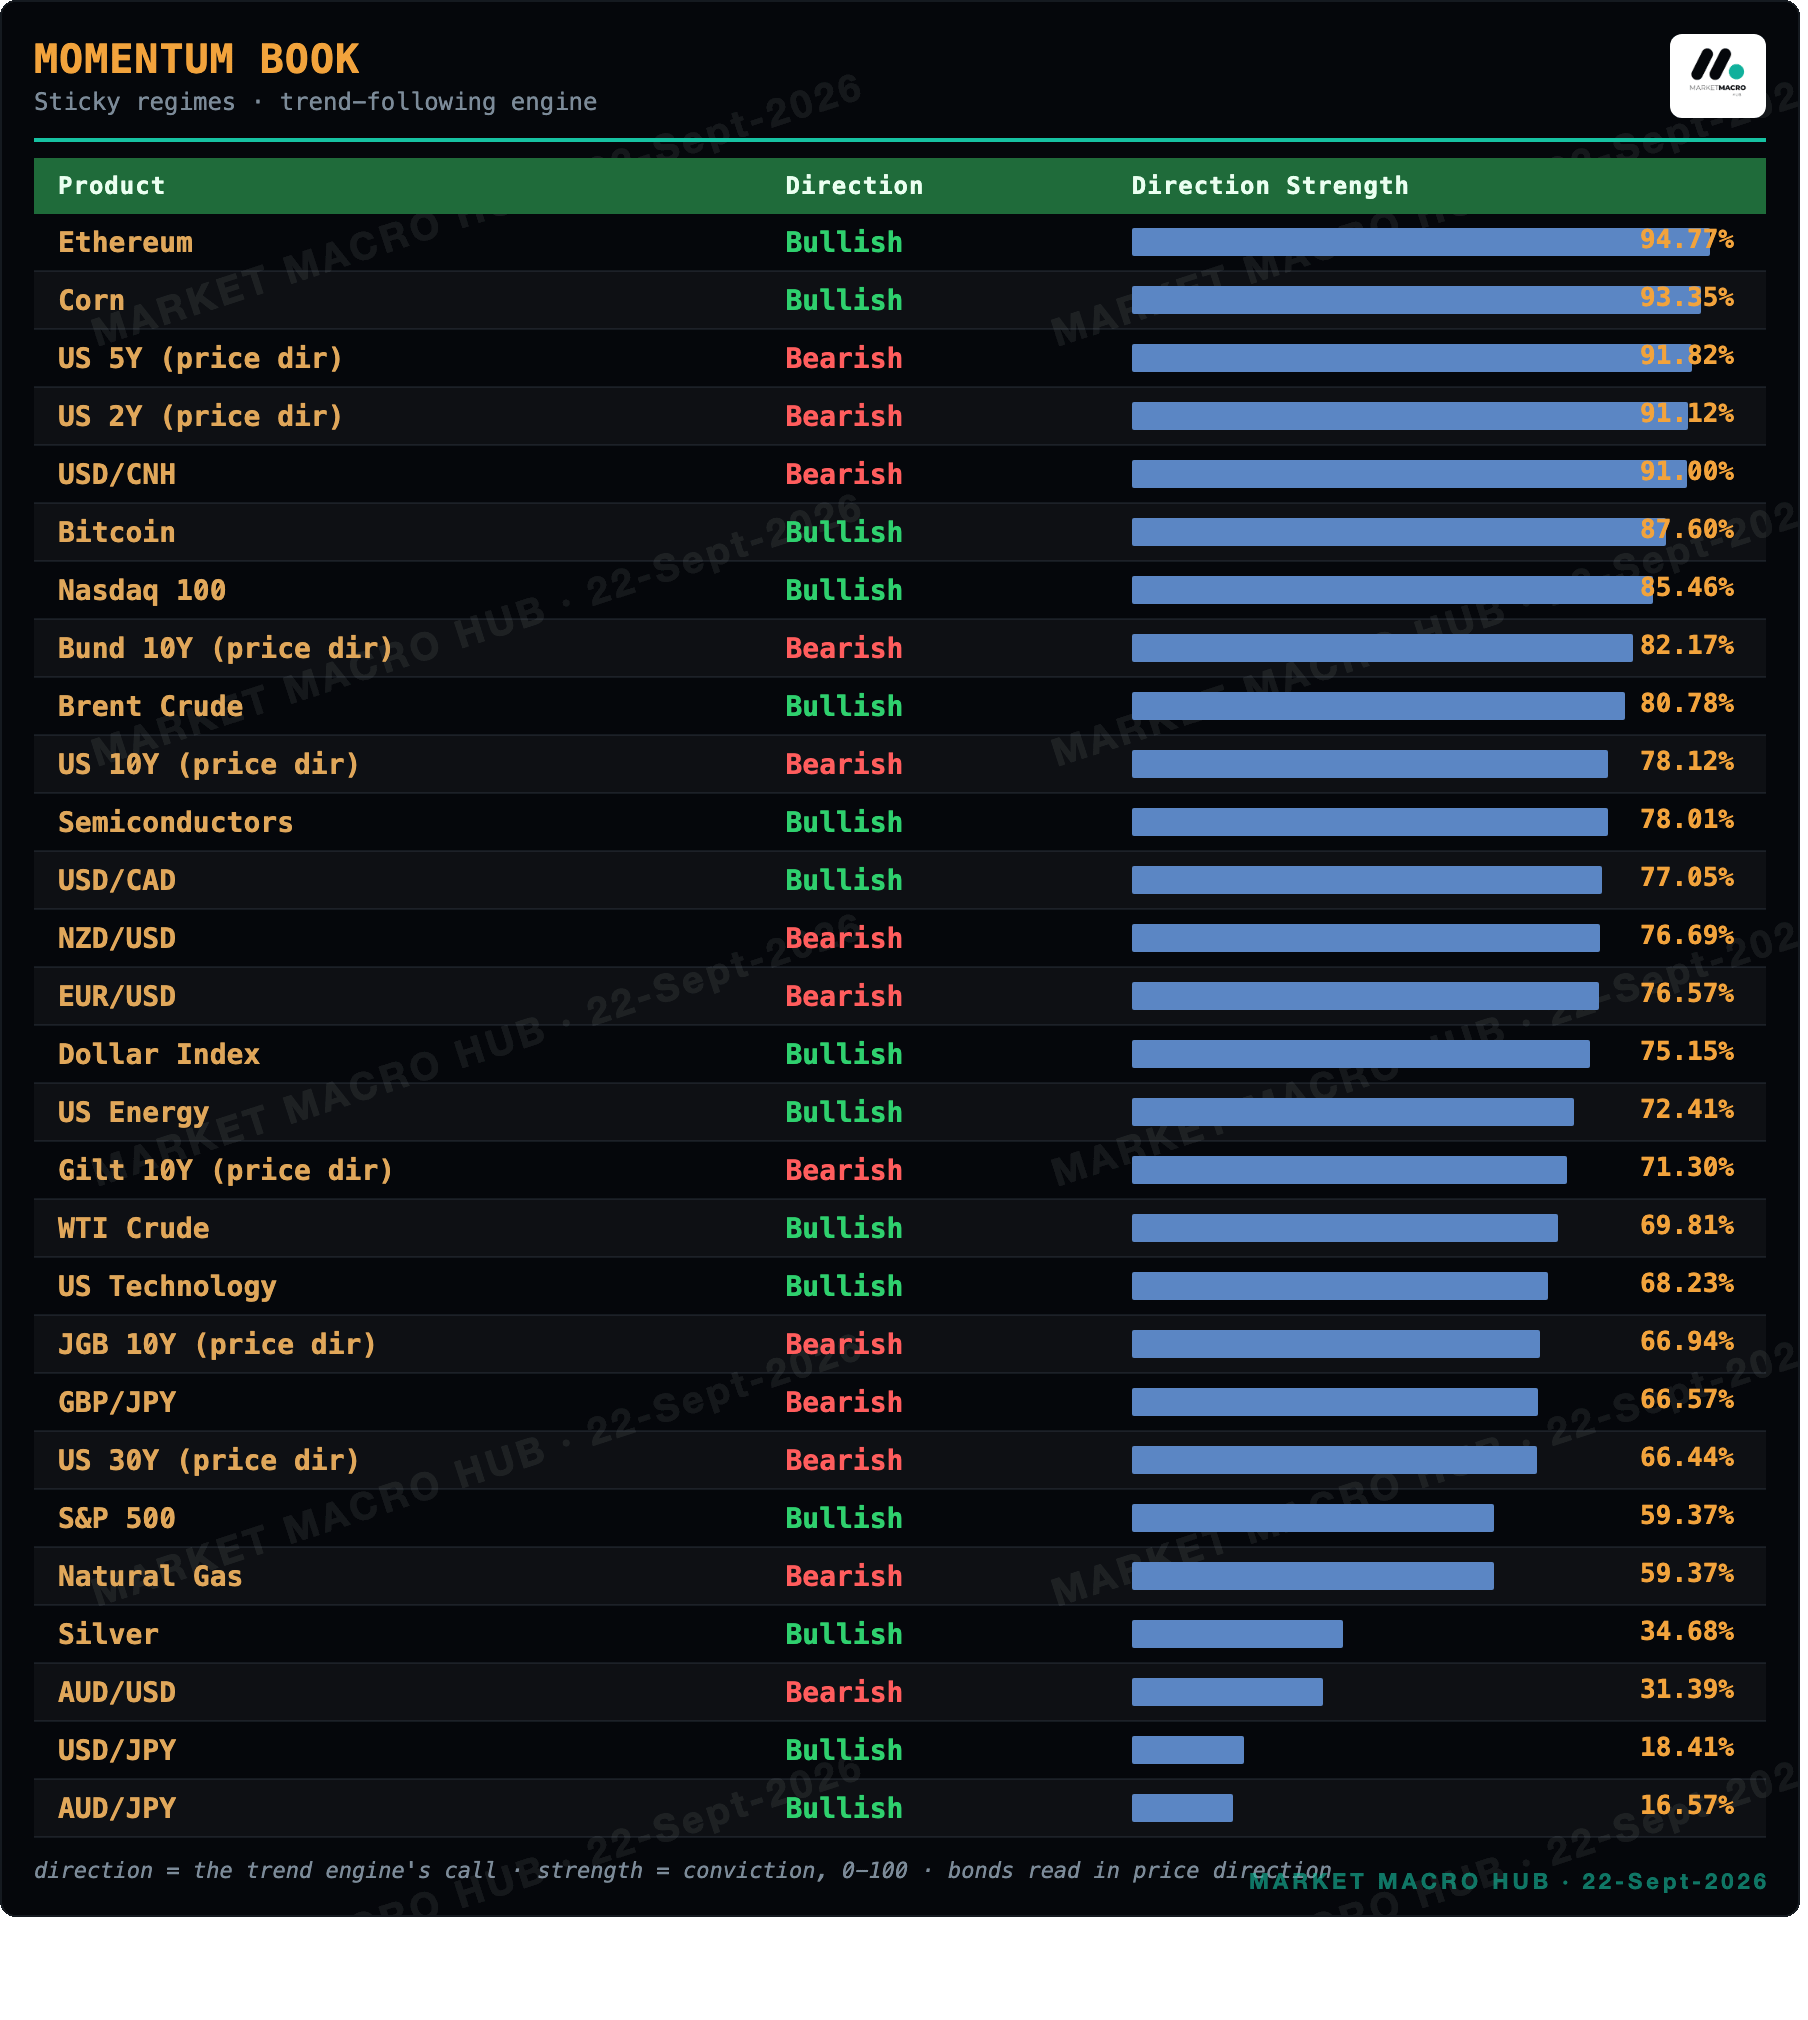
Momentum Book · Sticky Regimes
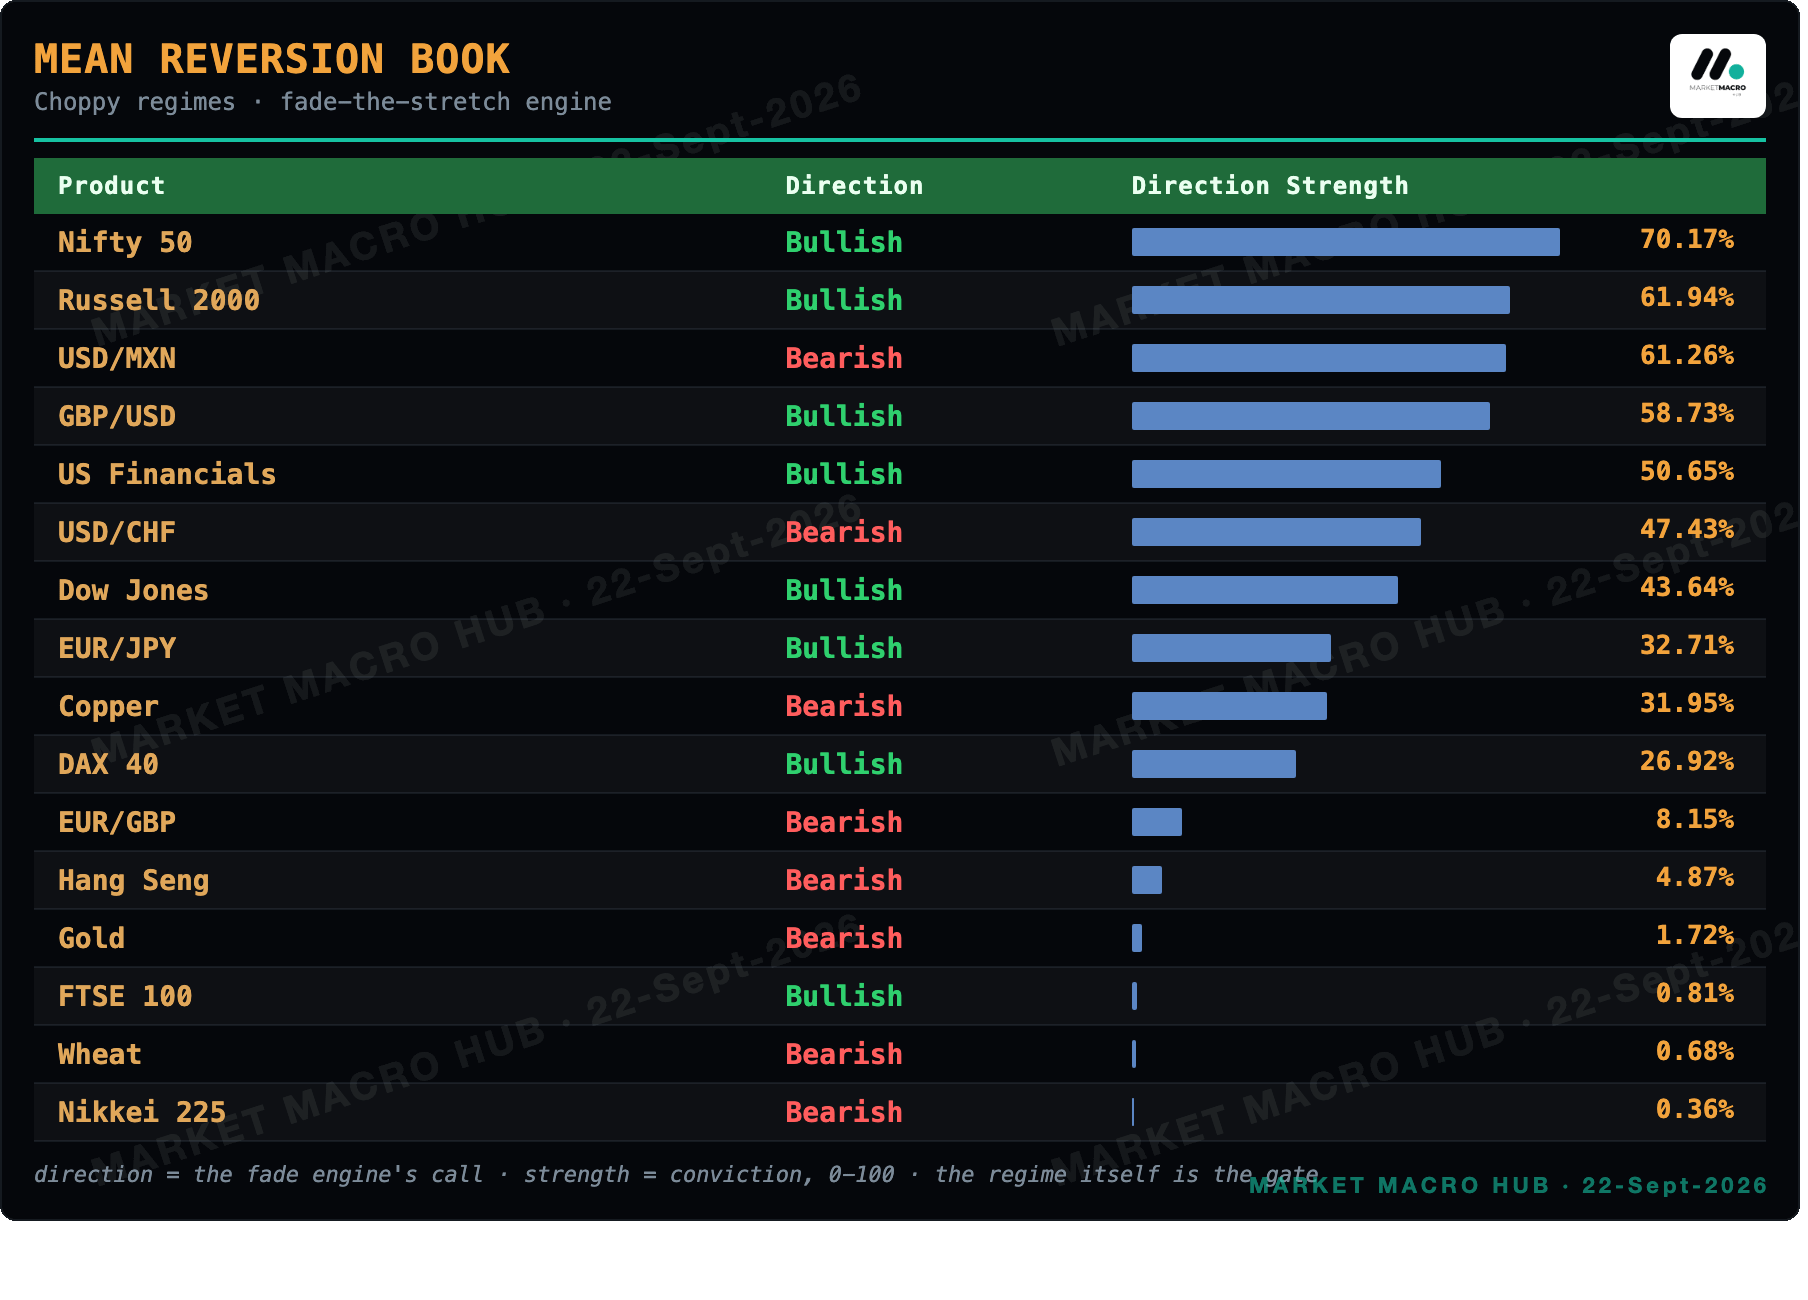
Mean Reversion Book · Choppy Regimes
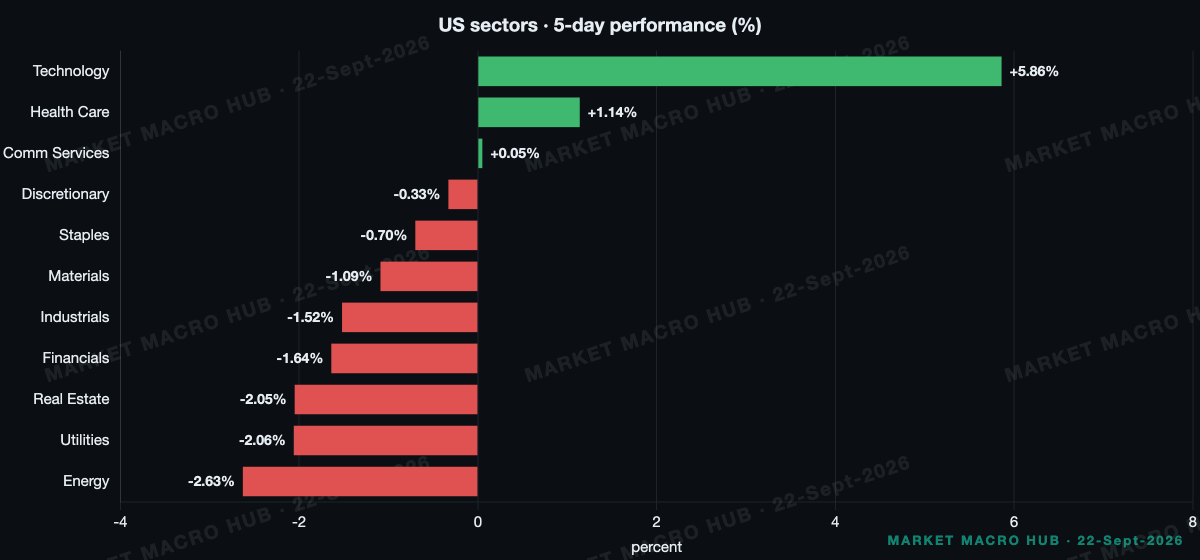
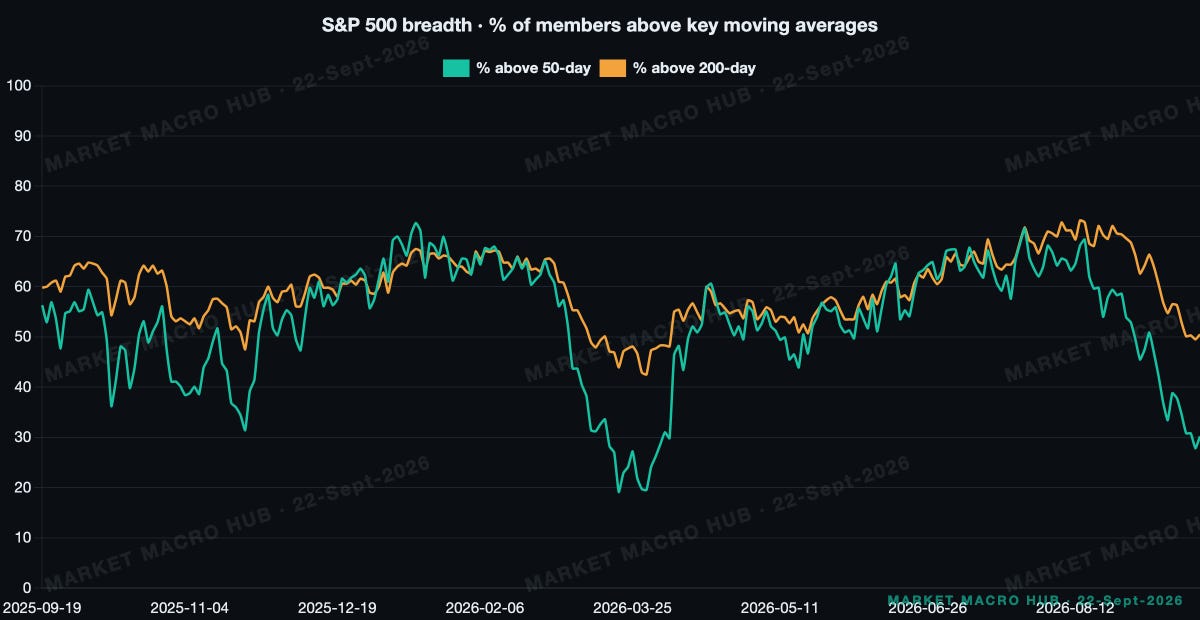
Sector Snapshot & Breadth
Stock-Bond Correlation
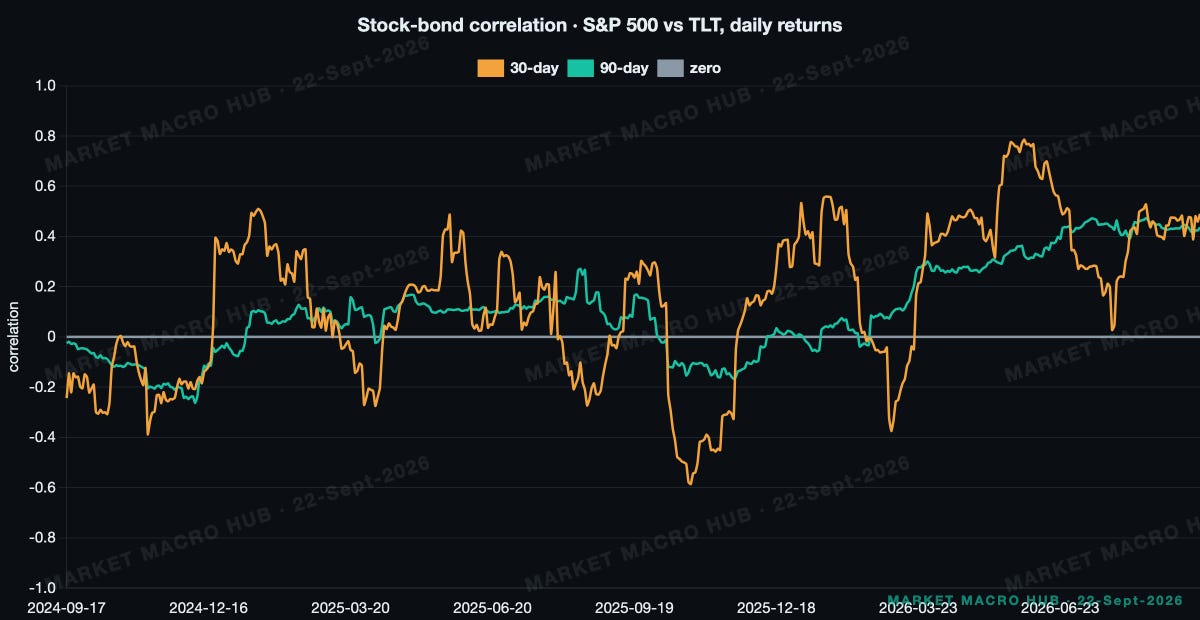
S&P 500 vs TLT, daily returns: 30-day 0.49, 90-day 0.44, positive, so bonds are not hedging equity risk.
Main Developments in Macro
META SURGED OVER 11%, DROVE NASDAQ TO RECORD CLOSE ON MUSE AI AGENT ADOPTION, AMD JOINED USD 1TLN CLUB
FED'S COLLINS PENCILS IN ANOTHER HIKE THIS YEAR, CITES IRAN WAR AND LACK OF INFLATION PROGRESS
FED'S MUSALEM SAYS RATES LIKELY NEED TO CLIMB FURTHER TO TAME DEMAND AND SUPPLY DRIVEN INFLATION
CRUDE TUMBLED ON UN GENERAL ASSEMBLY DIPLOMACY HOPES, TRUMP OPEN TO MEETING IRAN'S PEZESHKIAN
BESSENT TO PRESENT TRUMP WITH US-CHINA AI PACT, DECISION DUE THIS WEEK AHEAD OF TRUMP-XI SUMMIT
G7 CONDEMNS HOUTHI STRIKES, CALLS ON IRAN TO END SUPPORT, WARNS OF DANGEROUS ESCALATION
ECB'S LANE SEES STEADY GROWTH IF ENERGY SHOCK DOES NOT INTENSIFY, SECOND WAVE TO LIFT INFLATION
The data is not helping the growth bulls. Industrial production printed 0% against a 0.3% consensus, and pending home sales came in at 0.3% versus the 2% expected. The Chicago Fed index slipped to -0.04 from 0.08. Against that, Philly Fed at 37.8 beat the 30.5 consensus and claims stayed tight at 196. So activity is soft on the housing and production side while the labour market holds, which is exactly the mix that lets the Fed keep leaning hawkish on inflation without a growth alibi to stop it.
Cross-Asset Read
The leadership was narrow and it was tech. XLK added +0.92pp and XLC +0.37pp to the day, so those two sectors carried most of a +1.37% session. Energy was the drag at -0.08pp as crude sold off.
The correlation I'm watching shifted. Gold versus the 10Y yield moved to -0.42 from -0.17 a month back, so my gold hedge is now leaning harder against duration, which matters with yields grinding up. IG at 77bp sits at the tight end of its range against a 89bp mean, credit is not corroborating any equity anxiety. HY at 268bp is priced as if default risk has gone away.
Rates & Fed Pricing
No month on the strip has a cut half-priced, so the question is hikes. November is the first hike at least half-priced at roughly 56%, December is effectively certain near 100%. The strip peaks at 4.69% in September 2027, +80.5bp cumulative over EFFR, with the trough right here at the front. Terminal repriced +30.5bp on the week but slipped 10bp on the day, so the hawkish push is losing a little steam even as Collins and Musalem talk it up. What changes my mind is the front end fade sticking and the 2s10s at 25bp turning higher. For now it is flattening, down 2bp on the day and 8bp on the week, so I read the long end as still going along with the path. Until then I can't see the back half of that strip being realised.
The Week Ahead
Tuesday, ADP weekly and Fed speak from Williams, Jefferson and Barkin, the Fed tone decides whether the front end fade holds.
Tuesday, API crude after a heavy week for oil, matters for the energy drag and my Hormuz tail.
Wednesday, S&P Global flash PMIs, services consensus 56 and manufacturing 53.5, a soft services number would give the growth bears the alibi they lack.
Wednesday, MBA 30-year mortgage rate after the +19bp weekly jump, watching whether housing weakness deepens.
Wednesday, UN General Assembly, the Trump-Iran diplomacy headlines keep the oil tail two-way.
Tradeable Levels
Pivots off the last completed session (2026-09-21). Levels marked * sit within 0.6 x ATR14 of the close.
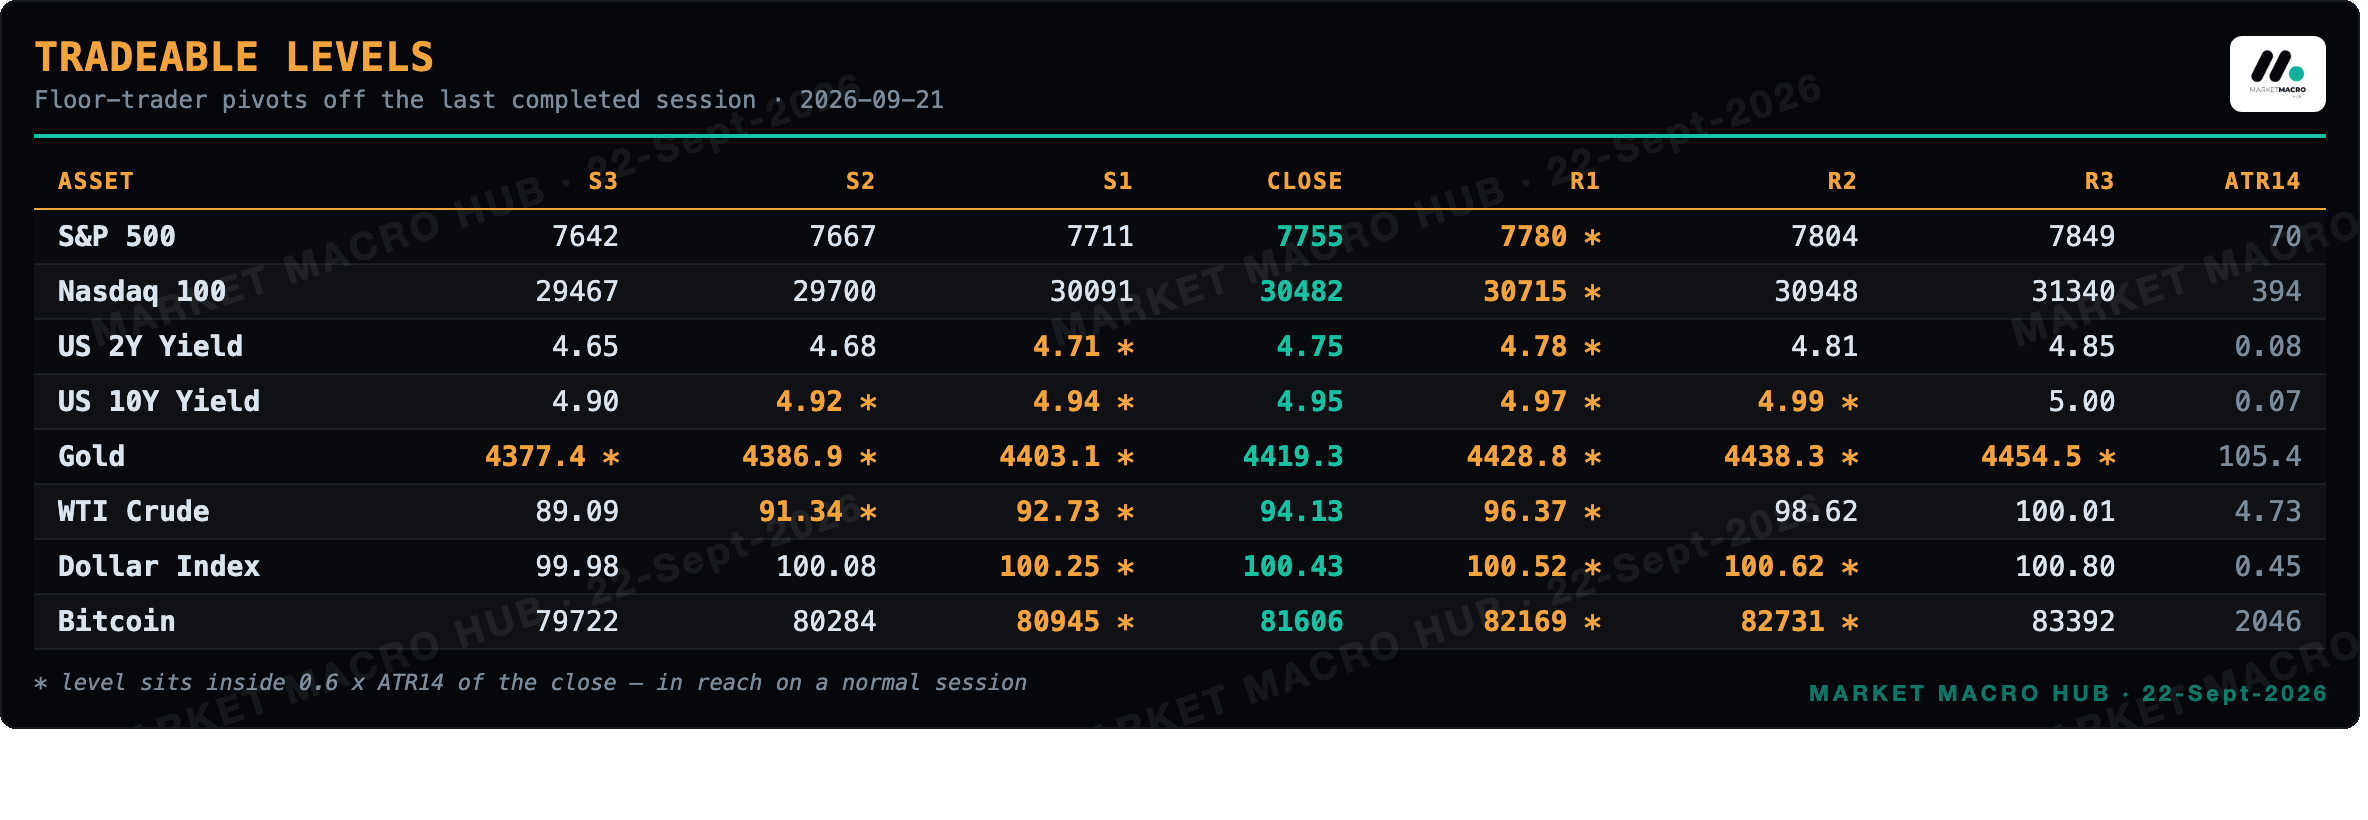
Gold priced off a session whose range was under a third of normal travel, so that board is compressed and nearly every level sits in reach. Weekend crypto and half-day holiday sessions do this; treat the levels as loose rather than precise.
Vol Screen · Rich and Cheap Implied Vol
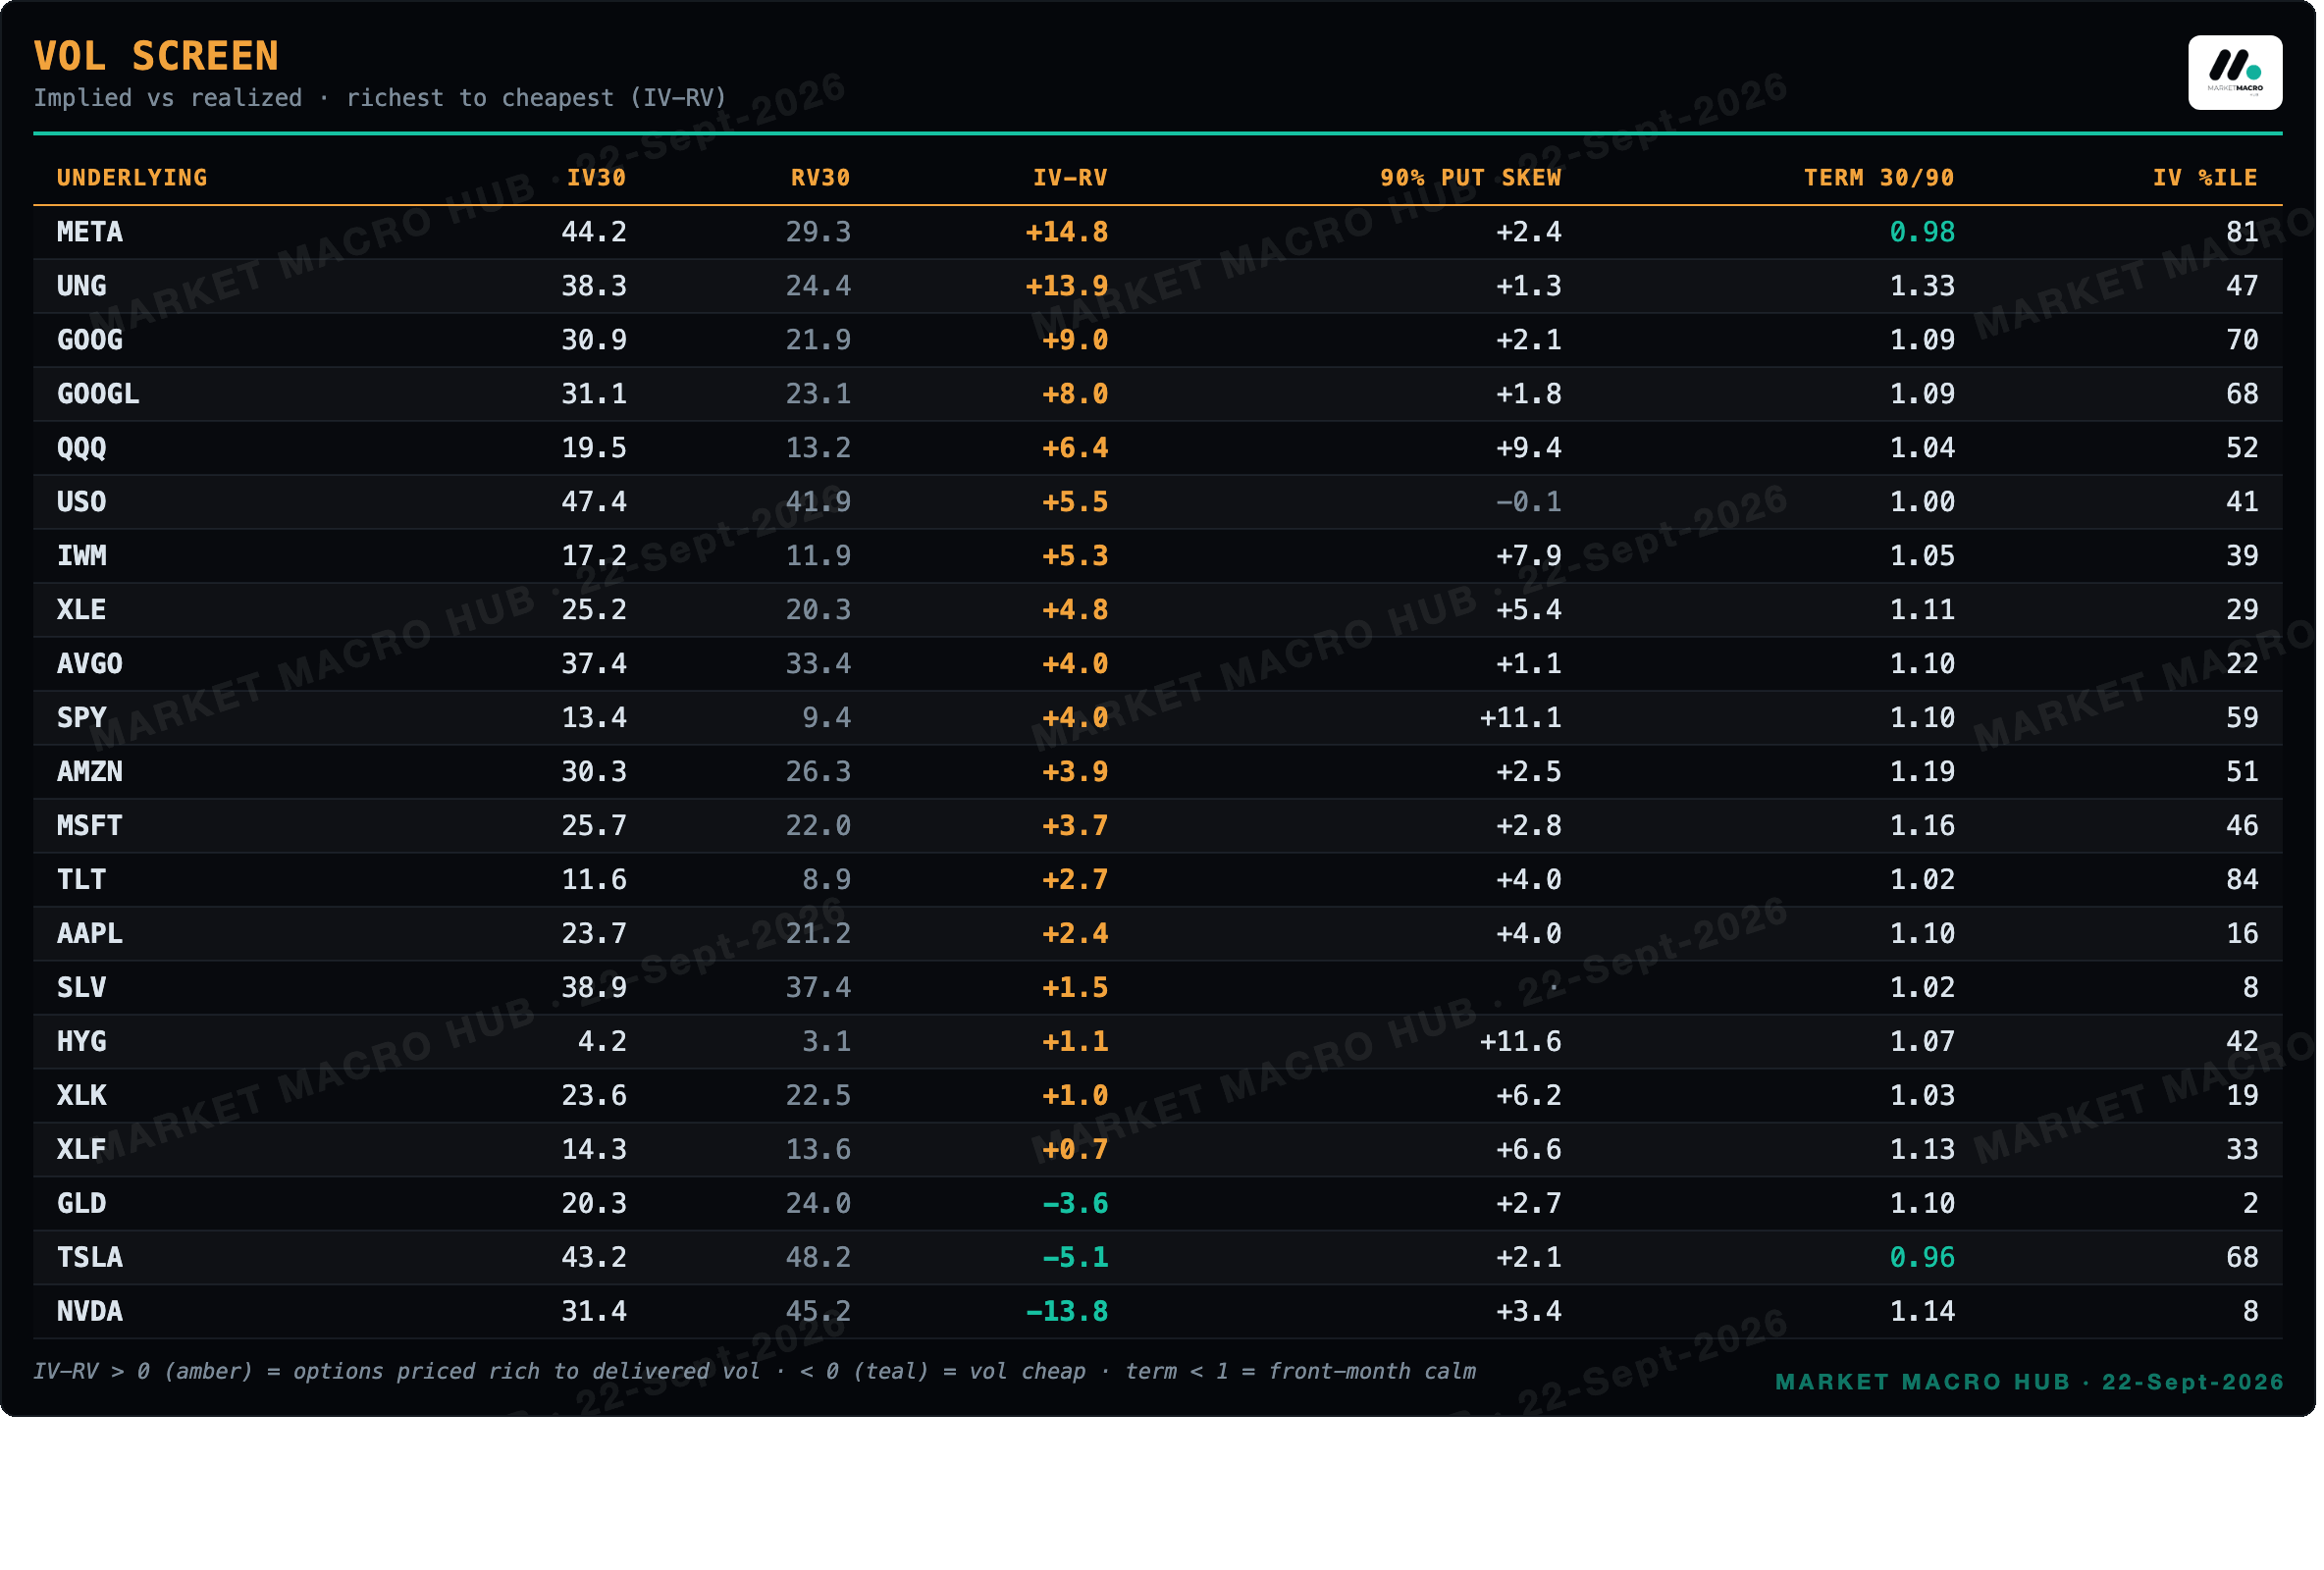
Positive IV-RV = options priced rich to what the tape is delivering (META and UNG richest today); negative = vol going cheap (NVDA and TSLA). Percentiles are each name's own archive history.
Disclaimer
The information in this publication is provided for informational and educational purposes only and is believed to be reliable, but its accuracy and completeness are not guaranteed. Nothing herein constitutes investment advice, an offer, or a solicitation to buy or sell any security, derivative, digital asset, or other financial instrument, nor a recommendation suited to any specific reader. All figures are drawn from the day's computed data set at the time of generation and may be delayed, revised, or superseded. Markets involve risk, including the possible loss of principal; past performance and historical relationships do not guarantee future results. Readers should conduct their own research and consult a qualified financial adviser before making any investment decision. The author may hold positions in instruments discussed. This publication is licensed for the personal use of the subscriber only: redistribution, reproduction, or resale in any form is prohibited. © 2026 MARKET MACRO HUB. All rights reserved.