


![Latest research: [FREE] Market Macro Hub Education & Resources](https://substackcdn.com/image/fetch/$s_!MpKy!,w_1456,c_limit,f_webp,q_auto:good,fl_progressive:steep/https%3A%2F%2Fsubstack-post-media.s3.amazonaws.com%2Fpublic%2Fimages%2F400c3445-5b95-4065-9bfa-3f018ab4853e_2200x380.png "Latest research: [FREE] Market Macro Hub Education & Resources")
Today's Tear Sheets
The full daily pack is attached below · six PDFs generated from the same computed data set as this note:
Macro Regime · curve regimes, growth x inflation quadrant, breadth, credit, vol term structure, liquidity, stock-bond correlation, crypto cross-asset, housing
Fixed Income · UST complex, global curves, Fed/ECB/BoE/BoJ implied policy paths, global 2Y and 10Y panels
Equities · index pages, relatives, vol suite, global relatives, Mag7+ quant sheet, options surfaces
FX · majors dashboards, correlations, COT positioning, crosses
Commodities · energy, metals, agriculture, COT crowding, term structure
Crypto · BTC ladders, ETH, macro correlations, ETF flow proxy

Every number in this note is computed by the desk's own systematic engines across 44 markets, then read in plain language. Five minutes and you're caught up.
Where We Stand
Our oldest live thesis, the short-duration trade opened four days ago, still holds because the two-year sits at 4.26 and September prices a 66% hike. Yesterday's Where We Stand kept the crude short flagged, and this morning that flag remains live as WTI slips again toward 83.35. We treat the overnight tech surge as a sentiment event and decline to chase equity risk into a steepening curve.
Today's Three · Highest-Conviction Signals
The three signals the desk engines rank highest right now, each with the level that proves it wrong.
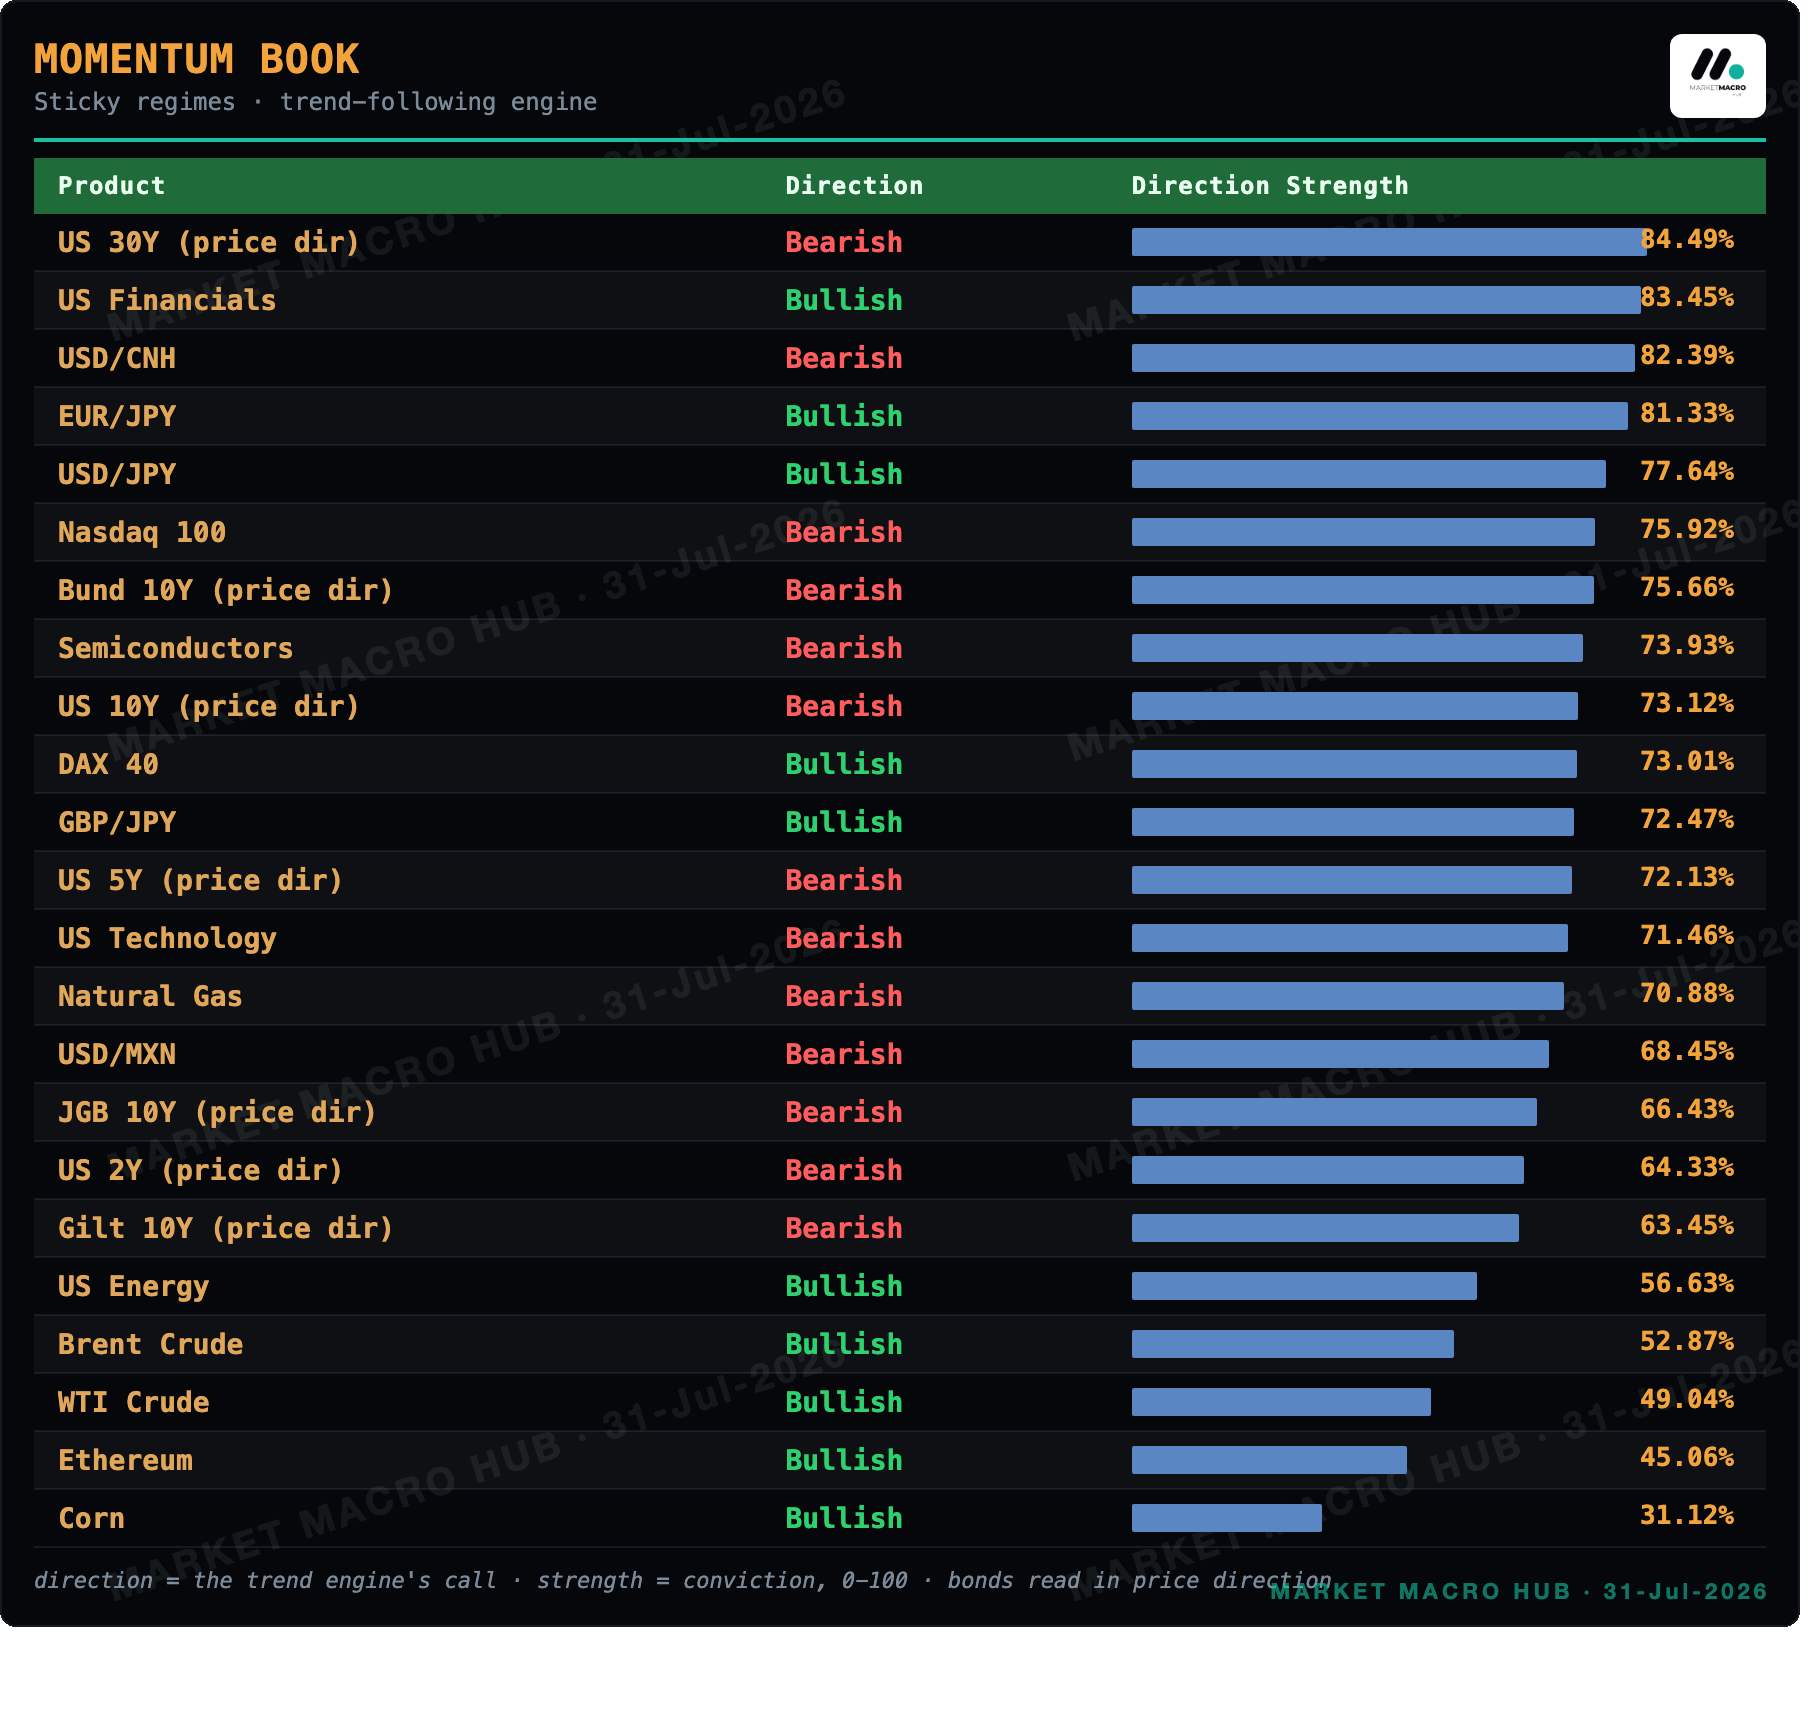
US 30Y (price dir) · levels in yield · momentum short, conviction 84/100, on for 15 sessions. The trend gate holds while the quote stays above the 21-day average at 5.1027; seven consecutive closes back below it kills the call.
US Financials · momentum long, conviction 83/100, on for 31 sessions. The trend gate holds while the quote stays above the 21-day average at 55.84; seven consecutive closes back below it kills the call.
USD/JPY · momentum long, conviction 78/100, on for 12 sessions. The trend gate holds while the quote stays above the 21-day average at 162.7; seven consecutive closes back below it kills the call.
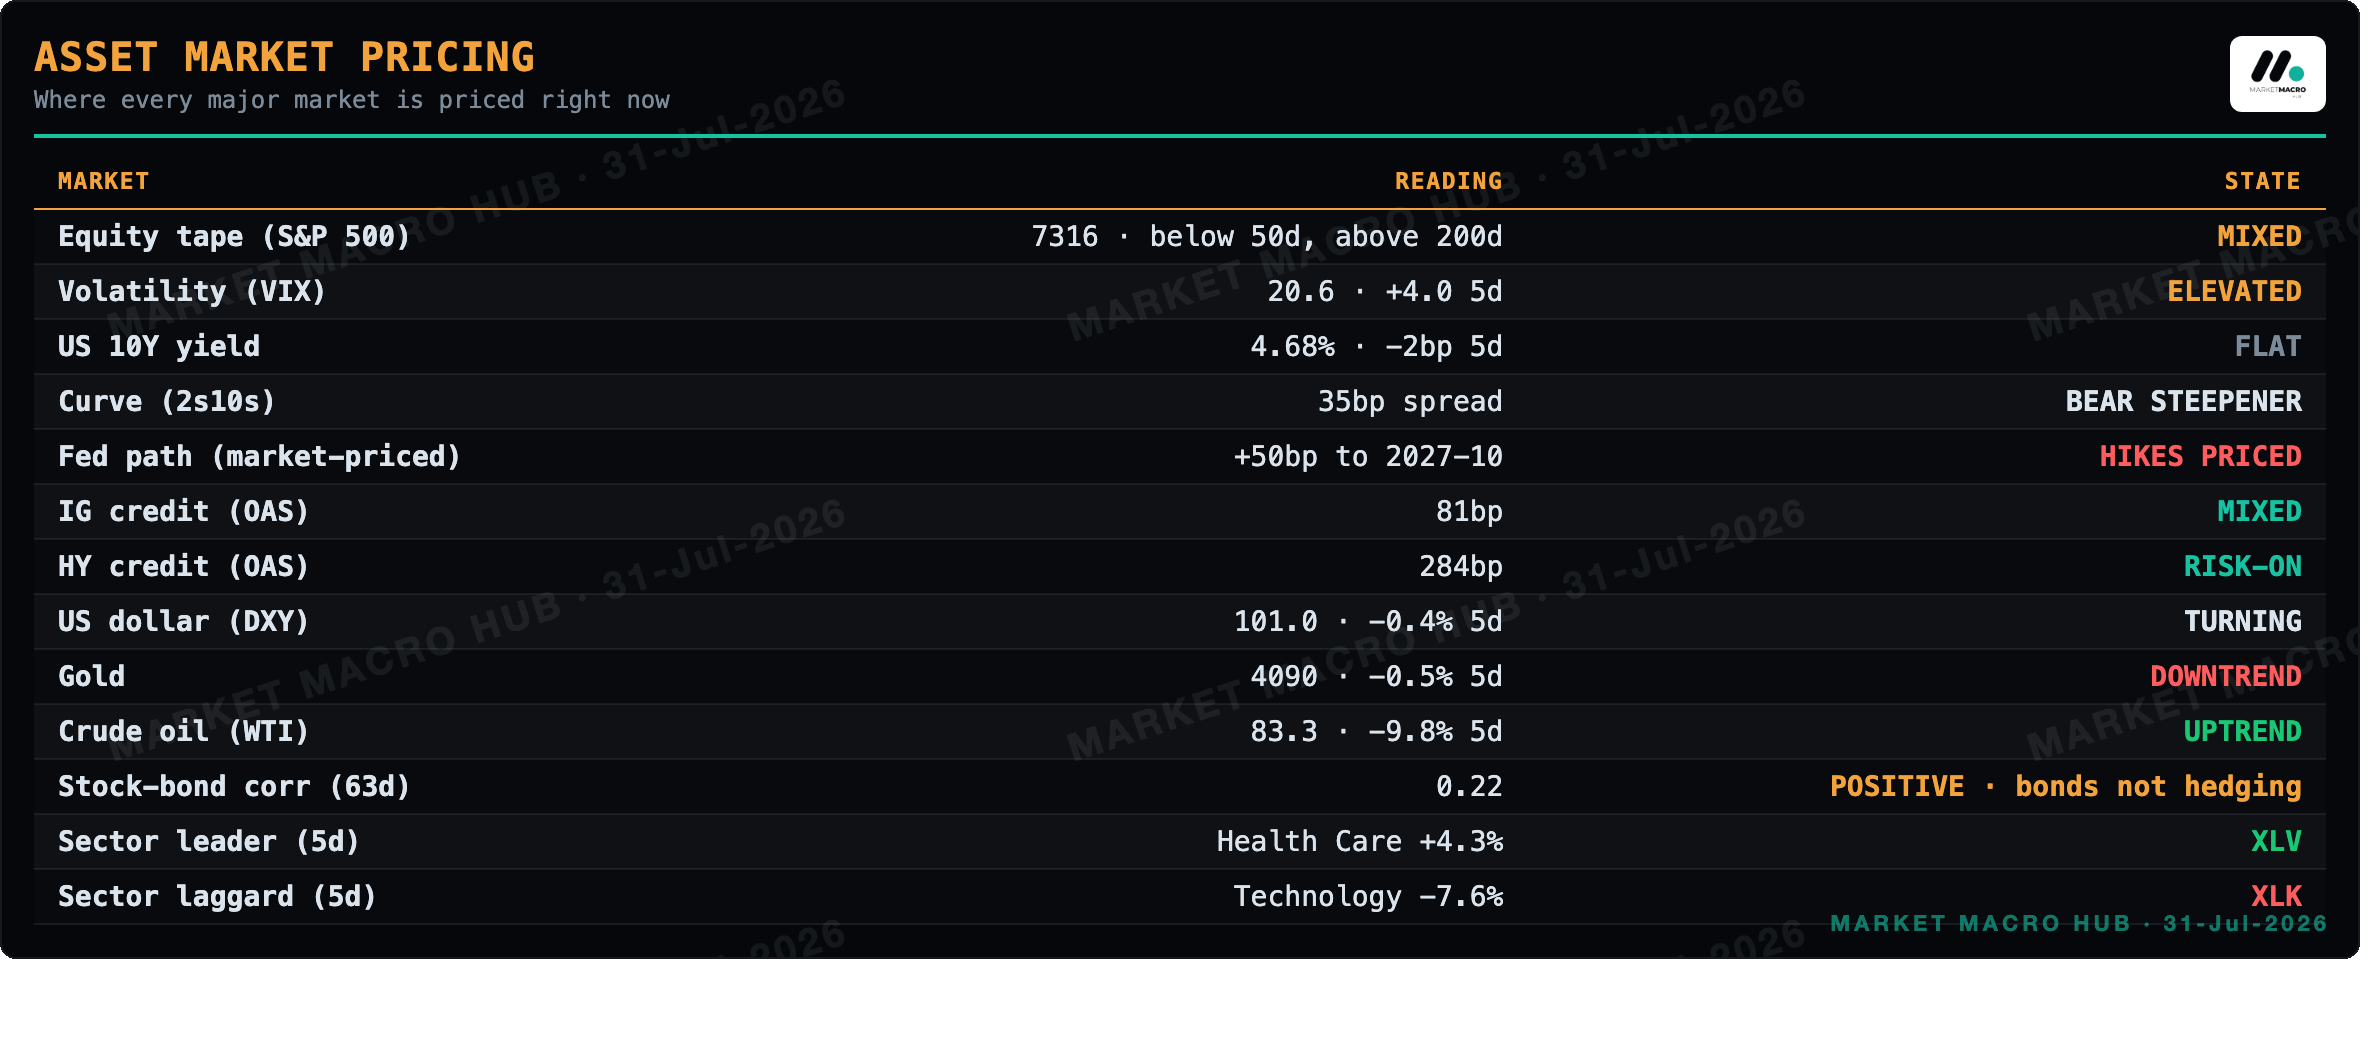
Asset Market Pricing
Momentum Book · Sticky Regimes
Assets whose regime is sticky (Markov persistence 6+ days): trends run, so the momentum engine sets the direction, and conviction rises with the strength bar.
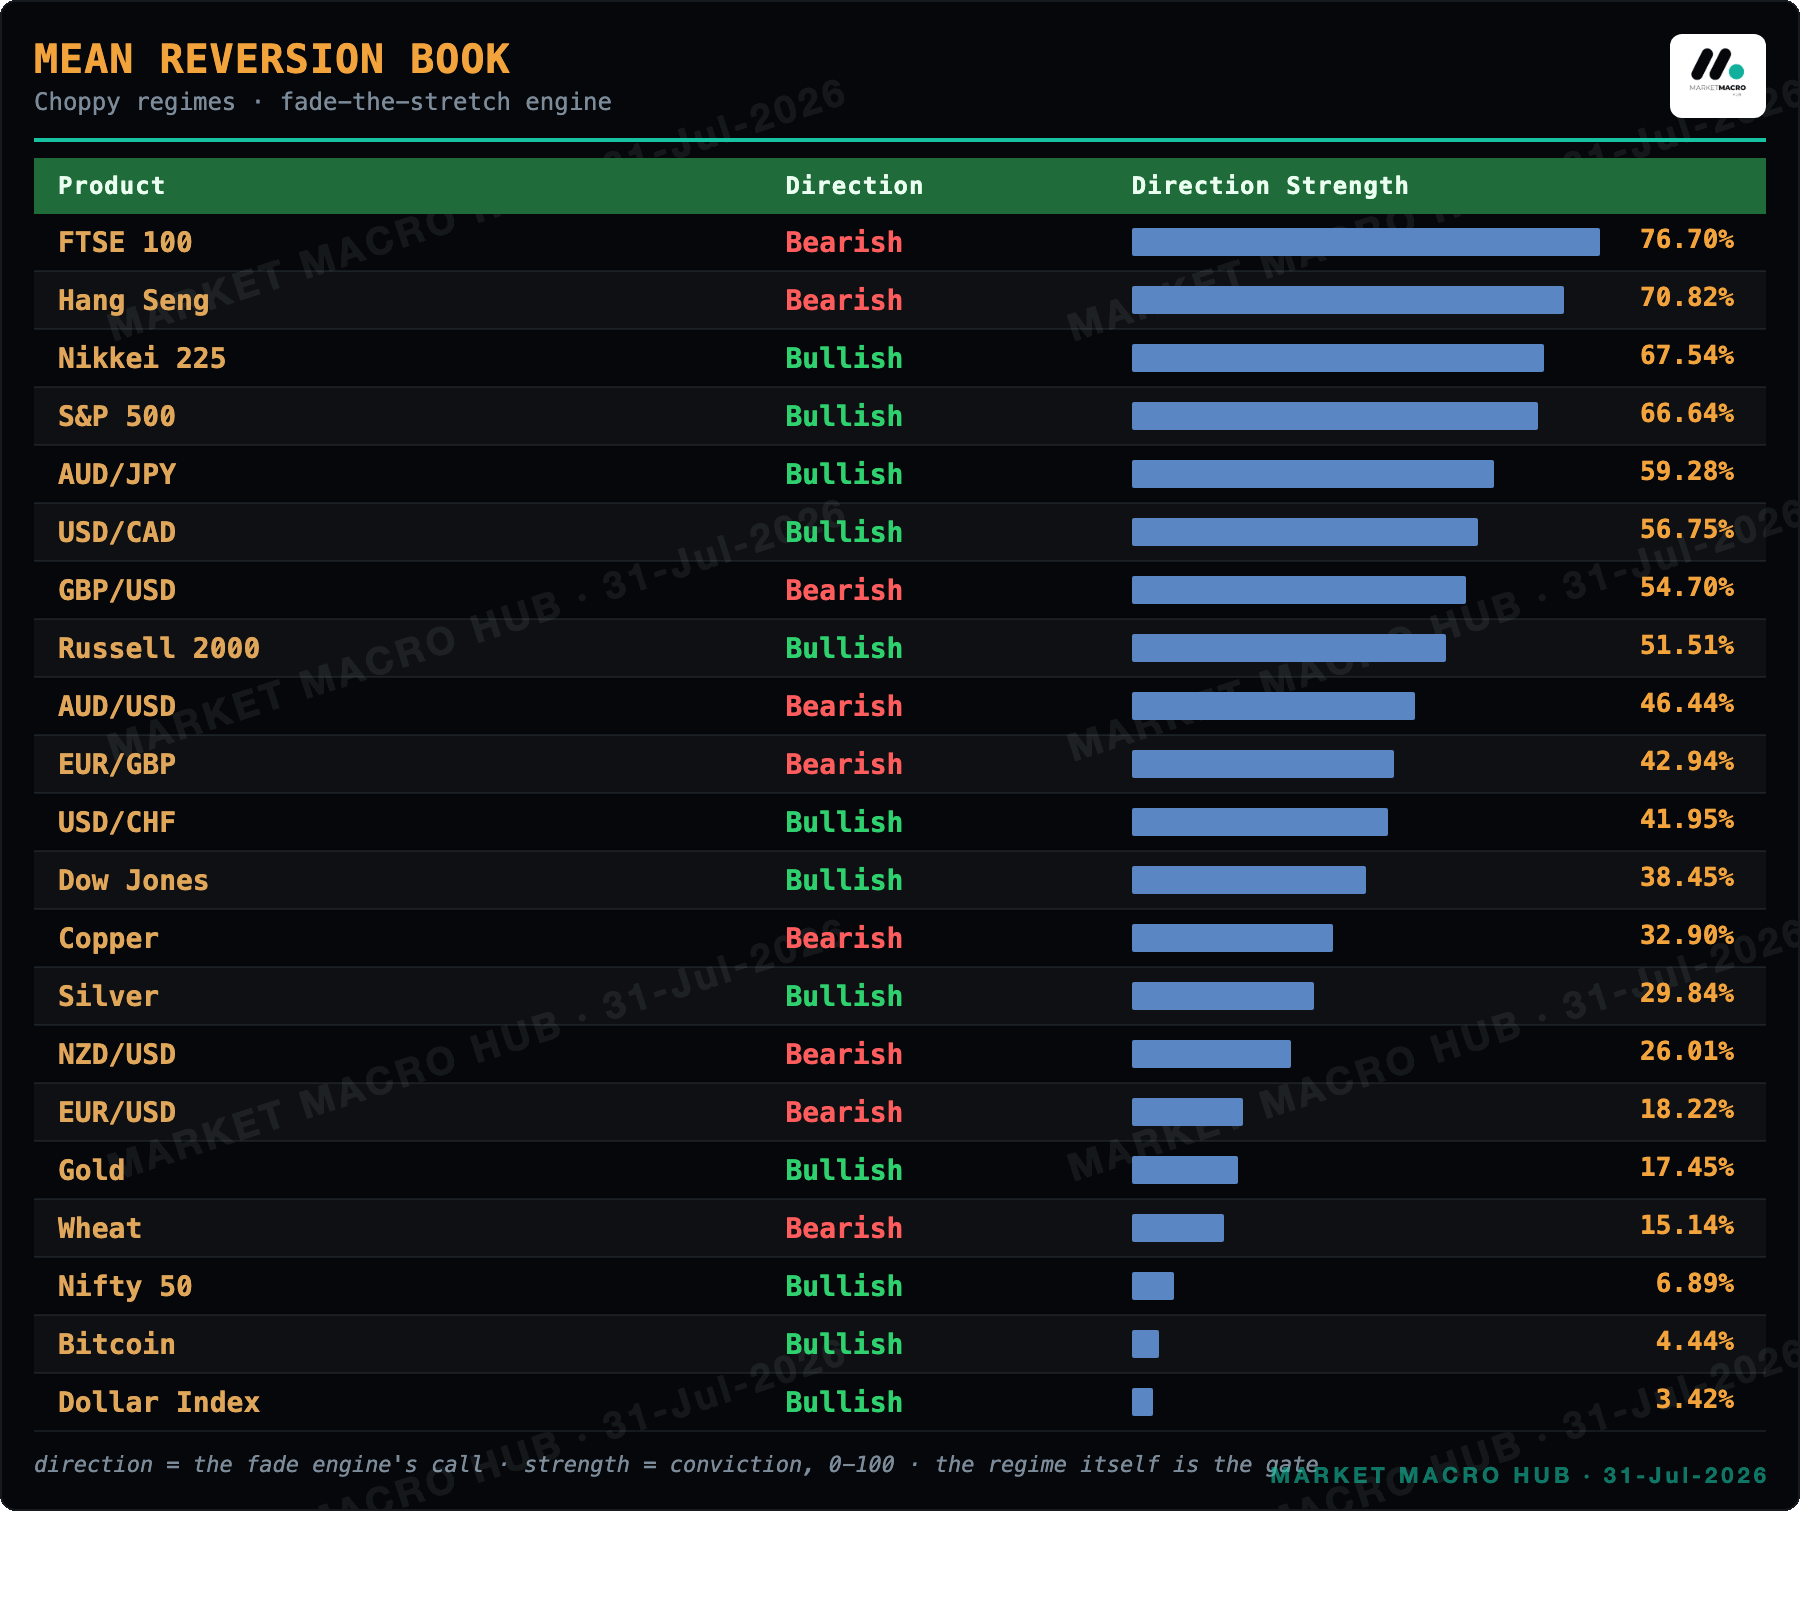
Mean Reversion Book · Choppy Regimes
Assets whose regime is choppy : trends get faded, so the mean-reversion engine sets the direction against the stretch from the 21-day average.
What's Driving the S&P 500
The S&P 500 is in a choppy regime, so mean reversion is driving it: the fade engine reads bullish with conviction 67/100.
Across the 44-market universe, 23 are trend-driven (momentum) and 21 are range-driven (mean reversion).
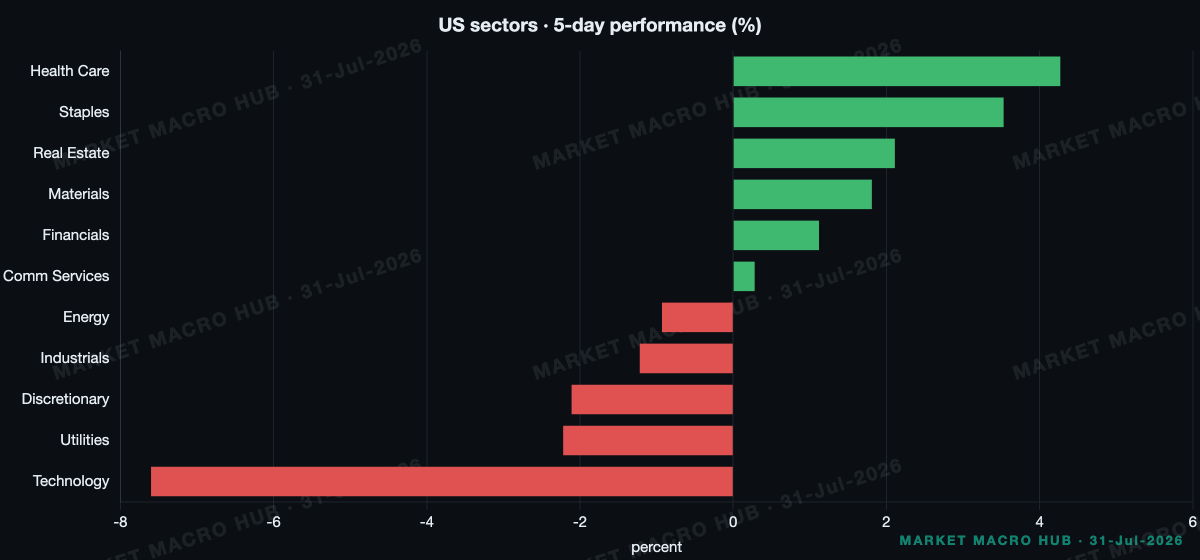
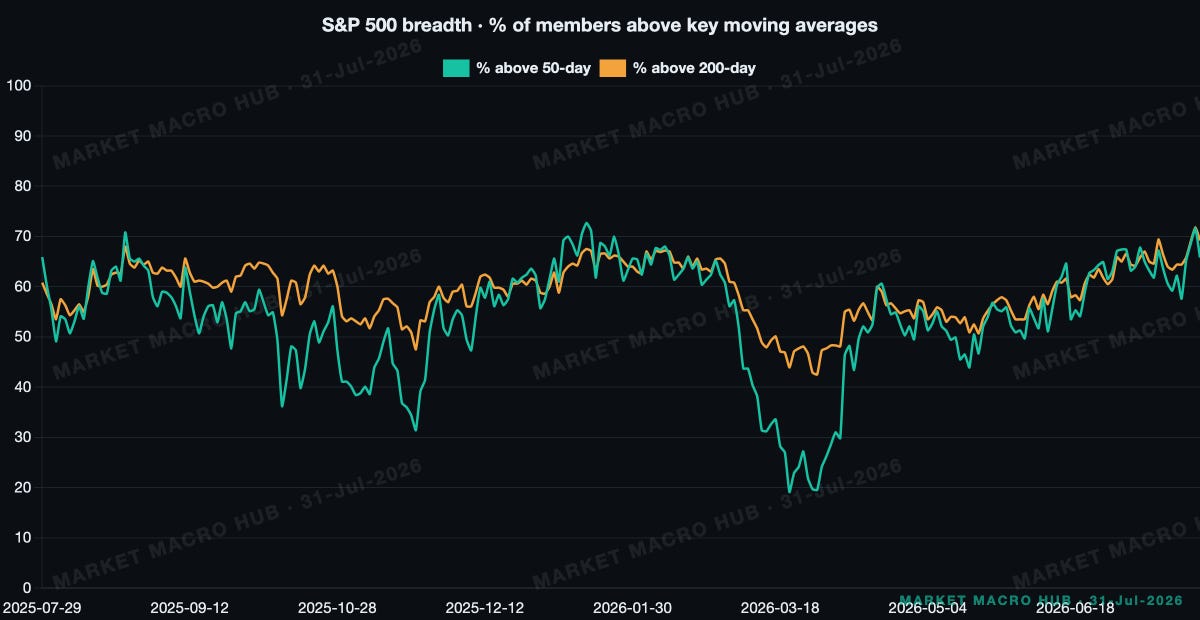
Sector Snapshot & Breadth
Main Developments in Macro
MSFT +15.5% ON AZURE, COPILOT BEATS, BEST DAY IN ROUGHLY 18 YEARS
AMAZON EPS 5.75 VS 1.81 EXPECTED, SHARES +9.6% AFTER HOURS
APPLE BEATS ON REVENUE BUT SHARES FALL 6.3% ON SOFT CHINA, SERVICES
JAPAN AND BOJ INTERVENE BUYING YEN; USD/JPY SAW LARGEST DROP SINCE DECEMBER 2023
BOJ HOLDS RATES UNCHANGED, TOKYO CPI SOFTER THAN EXPECTED
BESSENT: YEN "SUBSTANTIALLY OVERSHOT EQUILIBRIUM", VOLATILITY "UNHEALTHY"
CHINA MANUFACTURING AND NON-MANUFACTURING PMI SLIP INTO CONTRACTION
TRUMP: "BOARD OF PEACE" REACHES GAZA DISARMAMENT DEAL
The US data cut two ways. Advance GDP printed 1.5% against 2.1% consensus, and core PCE cooled to 0.1% versus 0.2% expected. That pairing softens growth while confirming disinflation, which normally reads dovish for the front end.
But the GDP price index came in at 6.3% against a 3.6% consensus, and that keeps the inflation story alive. We read the mix as messy enough to defend a hawkish August strip. This changes nothing for our short-duration stance.
The Tape
On yesterday's cash session, technology drove the tape. XLK cost the index 0.85pp and industrials took another 0.27pp, so leadership broke rather than rotated. We treat that breadth failure as the reason to keep equity sizing light despite the overnight melt-up.
Cross-asset, the correlation board moved under us. SPX versus 10-year yield ran to negative 0.25 from negative 0.63 a month ago, a BIG SHIFT. The consequence is direct: the bond hedge against equity drawdowns is degrading, so a long-gold overlay does the work duration no longer does.
Credit stayed calm through the noise. IG OAS held at 81bp against its 92bp long-run mean, which keeps us in the carry regime and complacent. HY at 284bp confirms no stress. If IG breaks decisively above 92bp, then we cut the carry and respect the regime shift; until then, we fade any panic that leaves the mean intact.
Rates & Fed Pricing
No month on the strip carries a cut, so the debate is entirely about hikes. September is the first month with a hike at least half-priced at roughly 66% odds, and November firms to 92%. We think the disinflation in core PCE argues against that path. We would not act on it because the 6.3% GDP price index keeps the hawkish case funded.
Cumulatively, the strip prices +23.0bp by November and peaks at 4.140% in August 2027. The terminal repriced +4.5bp on the day but sits 6.0bp lower on the week, so the post-FOMC steepening did not lift the far end. We read this as the market pricing near-term hikes without conviction on a higher terminal.
If September confirms with an actual hike, then we add the short-duration trade through the belly; until then, we hold the two-year expression and wait.
Bottom Line
Two-year at 4.26 holds our short-duration thesis into the September meeting.
September's 66% hike odds waits for a confirming print before we extend through the belly.
Gold at 4090.4 holds as the geopolitical hedge while the SPX-yield correlation degrades the bond hedge.
IG at 81bp fades any panic that does not break the mean.
Crude near 83.35 keeps the short flagged as spec longs sit washed out at the 38th percentile.
The Week Ahead
Friday: Employment Cost Index, consensus 0.8%. A print at or above 0.8% funds the hawkish strip and keeps our short-duration stance; a soft sub-0.8% wages read pressures the September hike case and forces us to lighten.
Friday: Chicago PMI, consensus 56 versus 56.7 prior. Above 56 confirms resilient growth and holds our leadership caution; a slide toward 53 tilts the growth read softer.
Friday: Michigan Sentiment Final, consensus 54 against 49.5 prior. A rebound to 54 supports the melt-up; a print back near 49.5 challenges the consumer and our equity sizing.
Monday: ISM Manufacturing, prior 53.3. A hold above 53 keeps growth intact and our carry-in-credit view; a drop below 50 flips the growth read and we would reduce risk.
Tuesday: Balance of Trade, prior negative 77.6. A wider deficit pressures the growth arithmetic and the GDP read; a narrower print supports the resilient-growth stance we currently hold.
Vol Screen · Rich and Cheap Implied Vol
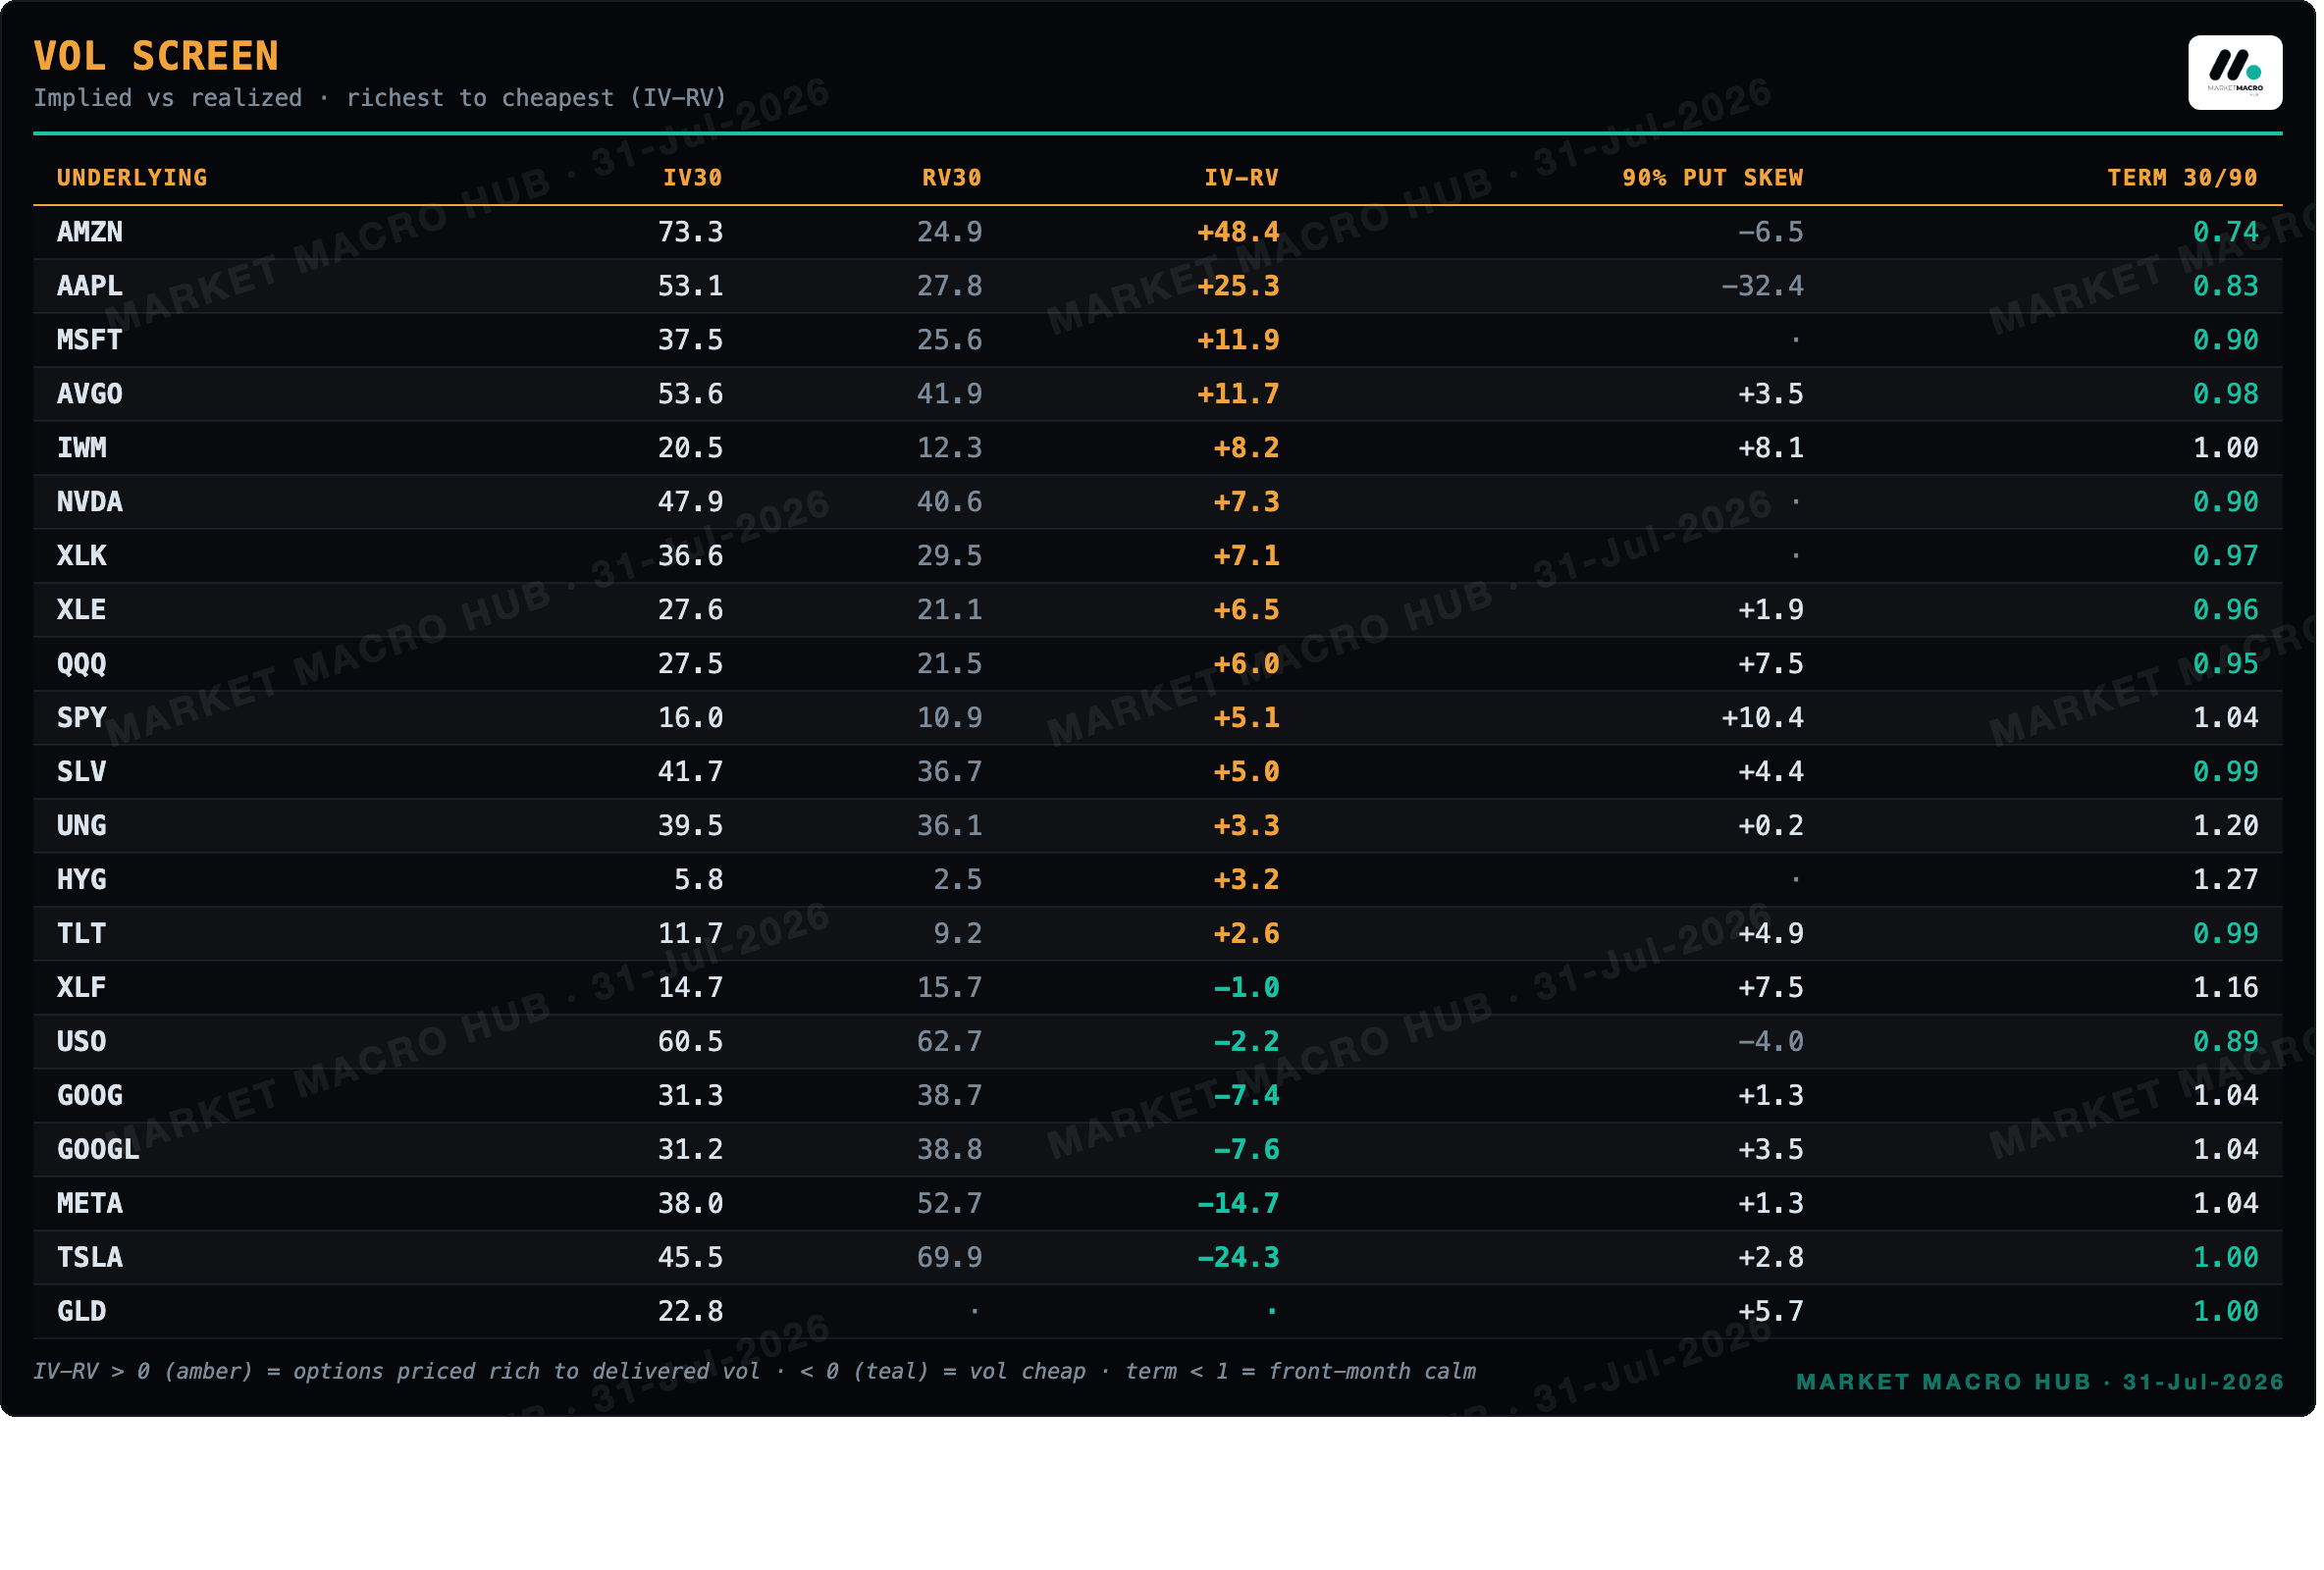
Positive IV-RV = options priced rich to what the tape is delivering (AMZN and AAPL richest today); negative = vol going cheap (TSLA and META). Percentile ranks unlock at 60 archived sessions per name · currently 13/60 · the archive deepens automatically every build.
Positioning Book · Friday COT
market           specs net %OI  percentile                  state  price 5d
------------------------------------------------------------------------
Wheat                    -1.5%          96                            -5.4%
Copper                   27.4%          88   SPEC LONGS STRETCHED     +0.8%
Corn                     10.7%          77                            -3.0%
Soybean Meal             18.4%          75                            -4.1%
Gasoline RBOB            18.5%          71                            -5.3%
Gold                     48.0%          58                            +0.8%
Natural Gas             -10.2%          52                            -5.9%
Soybean                  16.8%          52                            -4.4%
Silver                   22.1%          46                            +0.9%
Crude Oil (WTI)           4.4%          38  SPEC LONGS WASHED OUT     -8.2%
Heating Oil               3.7%          31                            -1.8%
No crowded-and-cracking setups this week · extremes without a price crack are carry, not catalysts.
Disclaimer
The information in this publication is provided for informational and educational purposes only and is believed to be reliable, but its accuracy and completeness are not guaranteed. Nothing herein constitutes investment advice, an offer, or a solicitation to buy or sell any security, derivative, digital asset, or other financial instrument, nor a recommendation suited to any specific reader. All figures are drawn from the day's computed data set at the time of generation and may be delayed, revised, or superseded. Markets involve risk, including the possible loss of principal; past performance and historical relationships do not guarantee future results. Readers should conduct their own research and consult a qualified financial adviser before making any investment decision. The author may hold positions in instruments discussed. This publication is licensed for the personal use of the subscriber only: redistribution, reproduction, or resale in any form is prohibited. © 2026 MARKET MACRO HUB. All rights reserved.