



Today's Tear Sheets
The full daily pack is attached below · six PDFs generated from the same computed data set as this note:
Macro Regime · curve regimes, growth x inflation quadrant, breadth, credit, vol term structure, liquidity, stock-bond correlation, crypto cross-asset, housing
Fixed Income · UST complex, global curves, Fed/ECB/BoE/BoJ implied policy paths, global 2Y and 10Y panels
Equities · index pages, relatives, vol suite, global relatives, Mag7+ quant sheet, options surfaces
FX · majors dashboards, correlations, COT positioning, crosses
Commodities · energy, metals, agriculture, COT crowding, term structure
Crypto · BTC ladders, ETH, macro correlations, ETF flow proxy

TL;DR
Long the hike story, November at 56% is the first hike half-priced and no cut sits on the strip.
Terminal at 4.65% repriced +46bp on the week on hawkish Fed speak, I'm watching whether the front end fade sticks.
2s10s at 27bp is dead flat and decides my steepener, steepening confirms the market doubts the full path.
IG at 78bp anchors me, credit is not corroborating any equity anxiety, invalidation stays 90bp.
Gold is my hedge with the dollar link at -0.67, and the Hormuz headlines keep the oil tail live.
Where We Stand
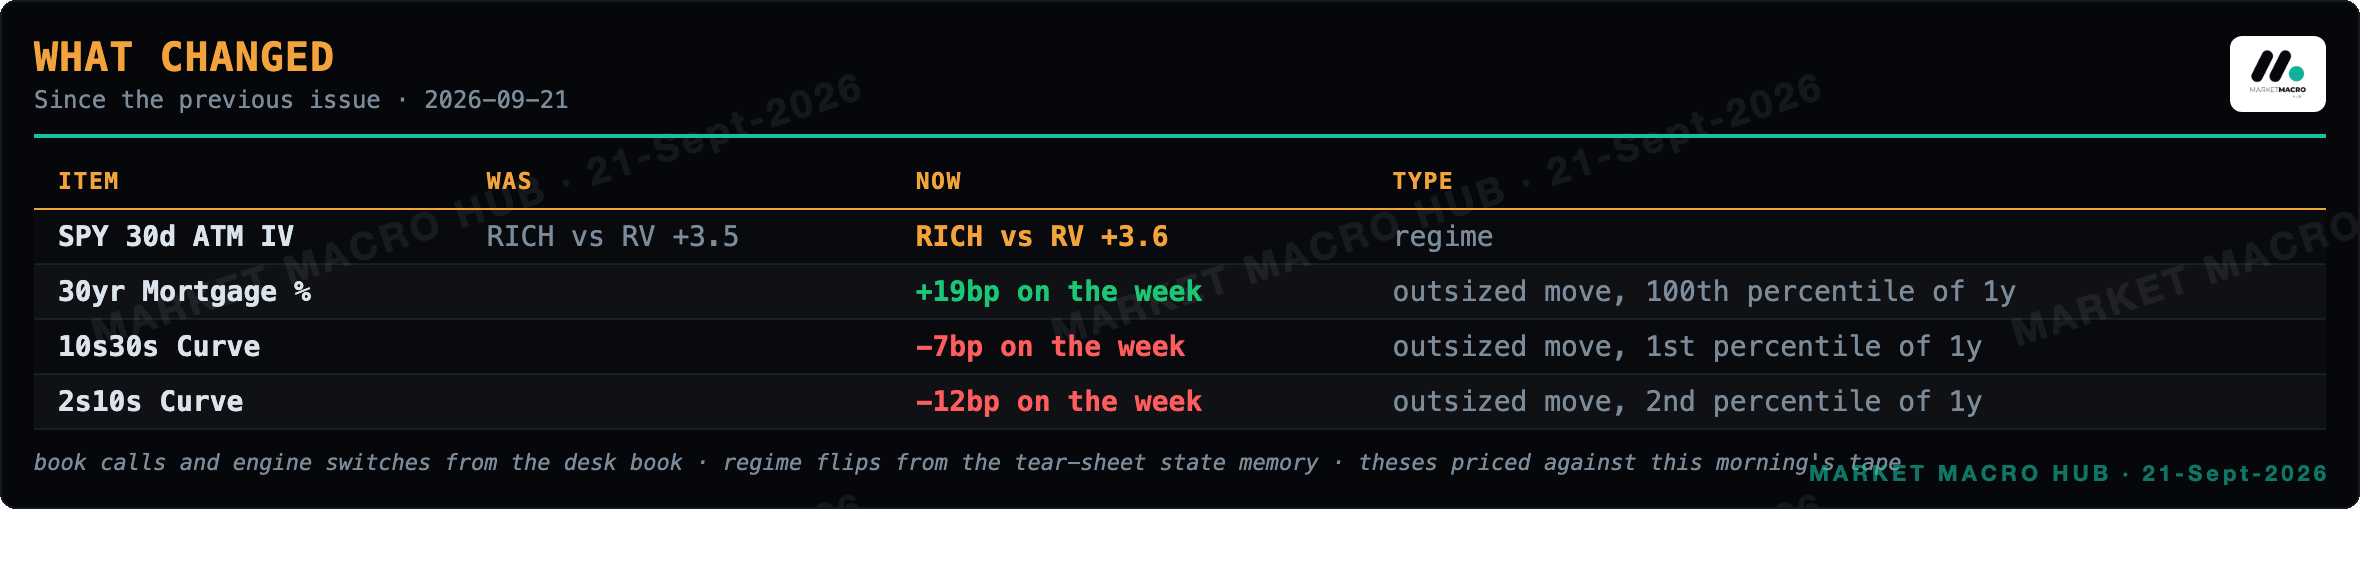
Yesterday I stayed long the hike story, November near 56% as the first hike at least half-priced and no cut anywhere on the strip. This morning's tape half challenges that. The 2Y grabbed 7bp lower on the day even as the strip added +46bp to terminal on the week, so the front end is buying duration while the curve keeps pricing more tightening. I'm not changing my read, the hike is intact at 4.02% implied for November, but that gap is the thing I'm watching. My oldest live thesis, the 2s10s steepener from 27bp opened two days ago, sat dead flat today at 27bp, so it is neither paid nor invalidated. IG at 78bp still anchors me and credit is not corroborating any equity nerves.
What Changed
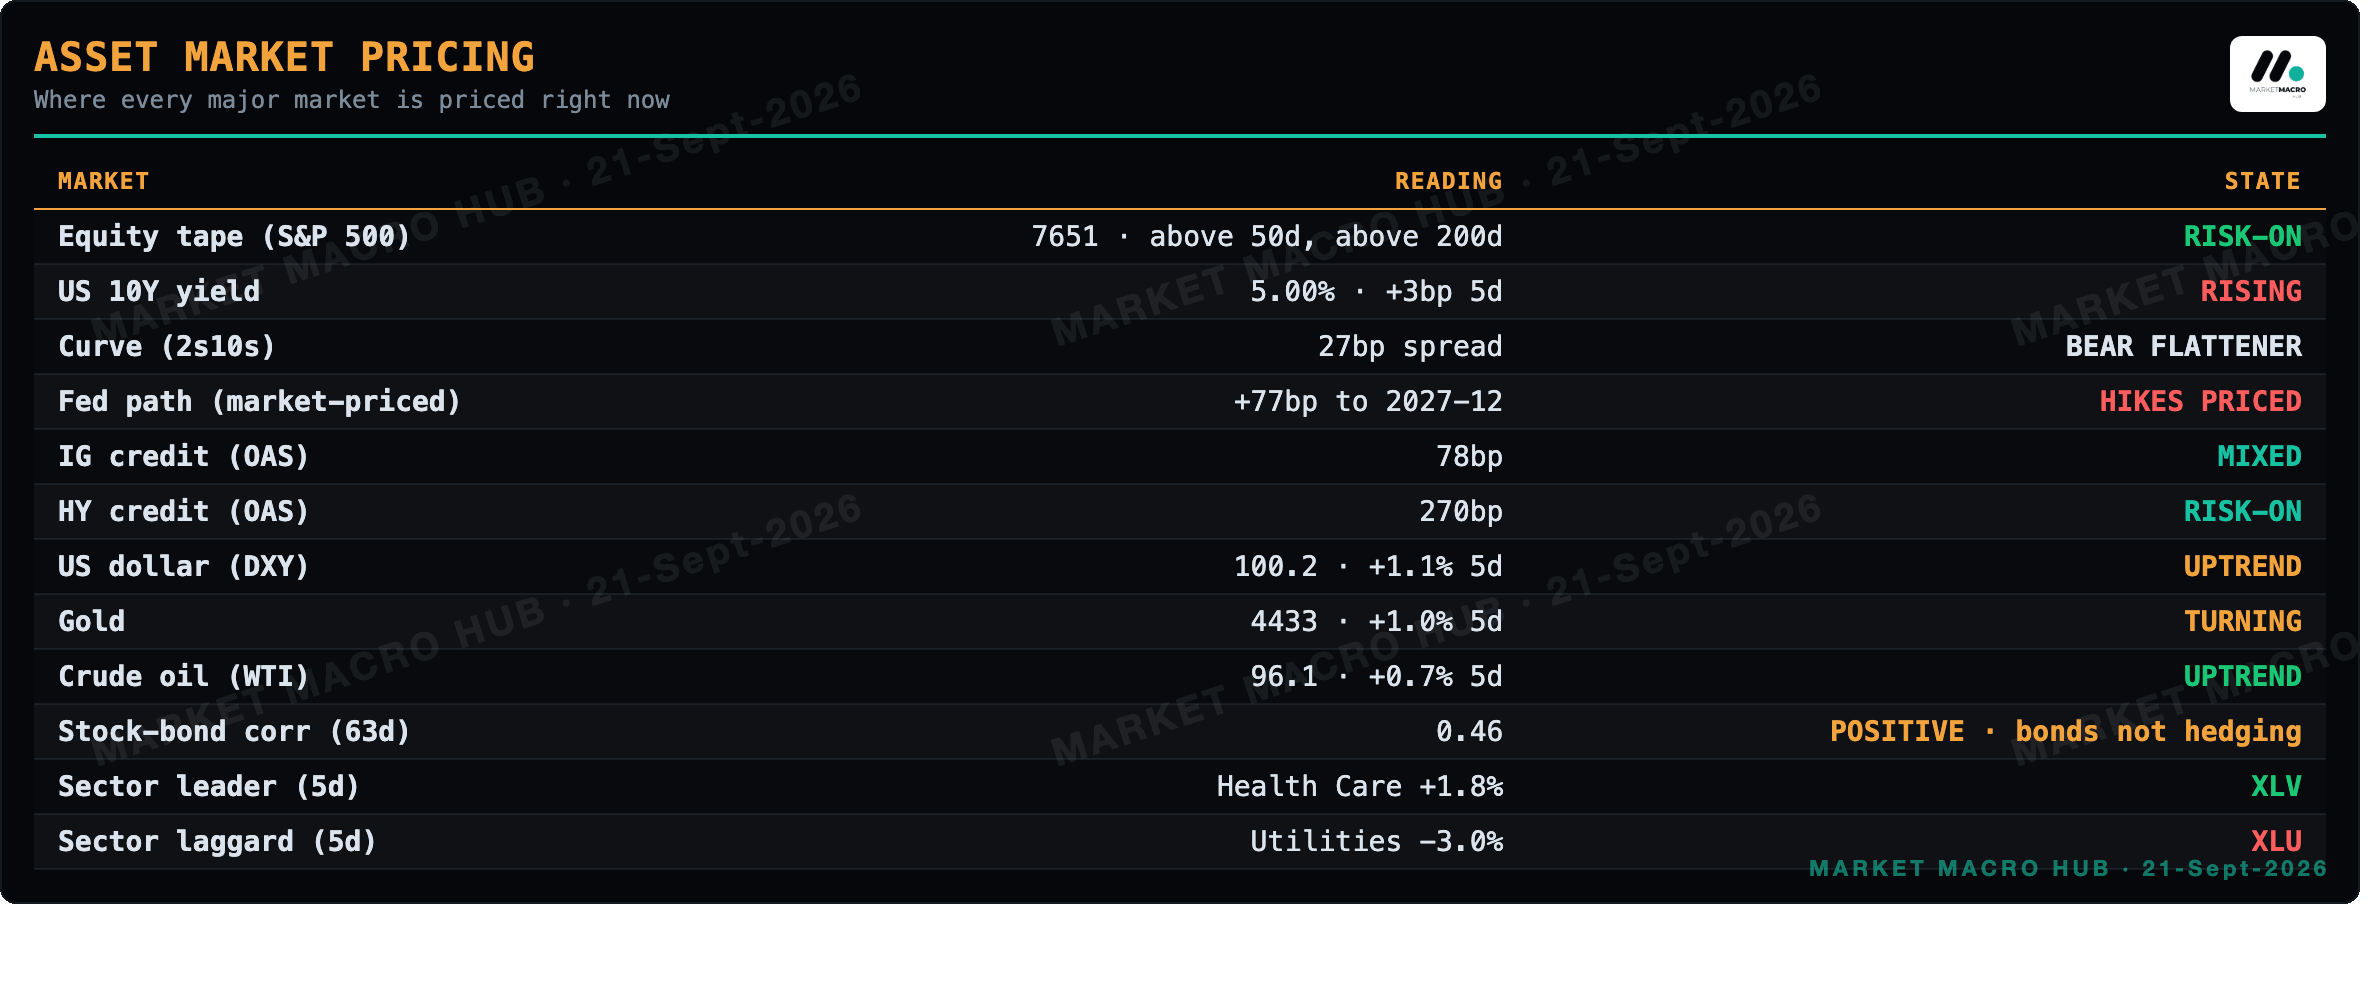
Asset Market Pricing
Sector Attribution
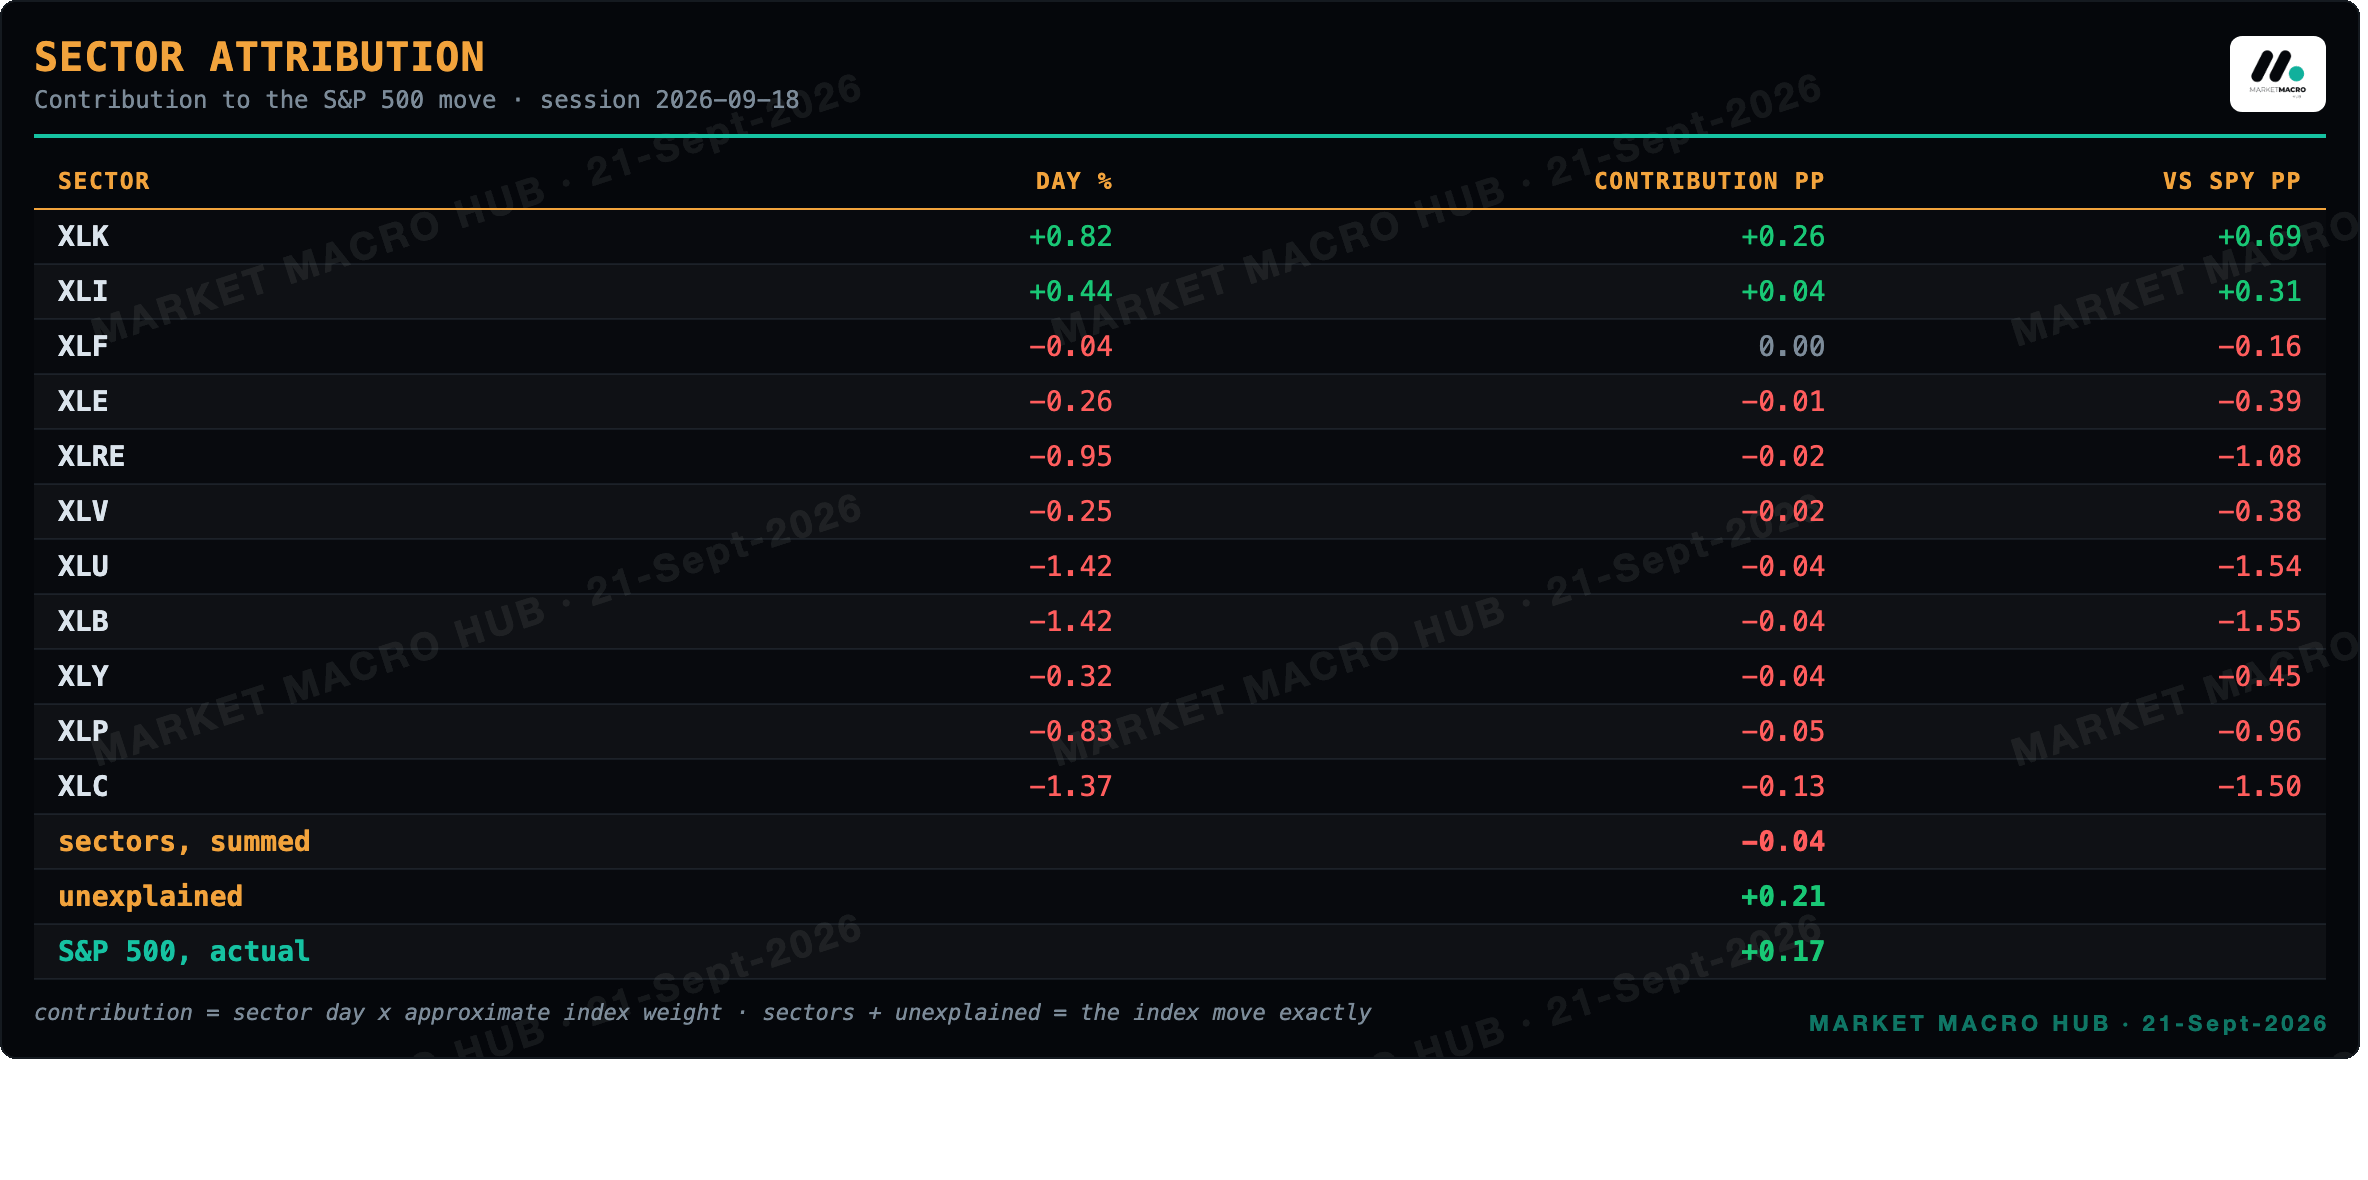
Session 2026-09-18. Sectors plus the unexplained remainder sum to the index move.
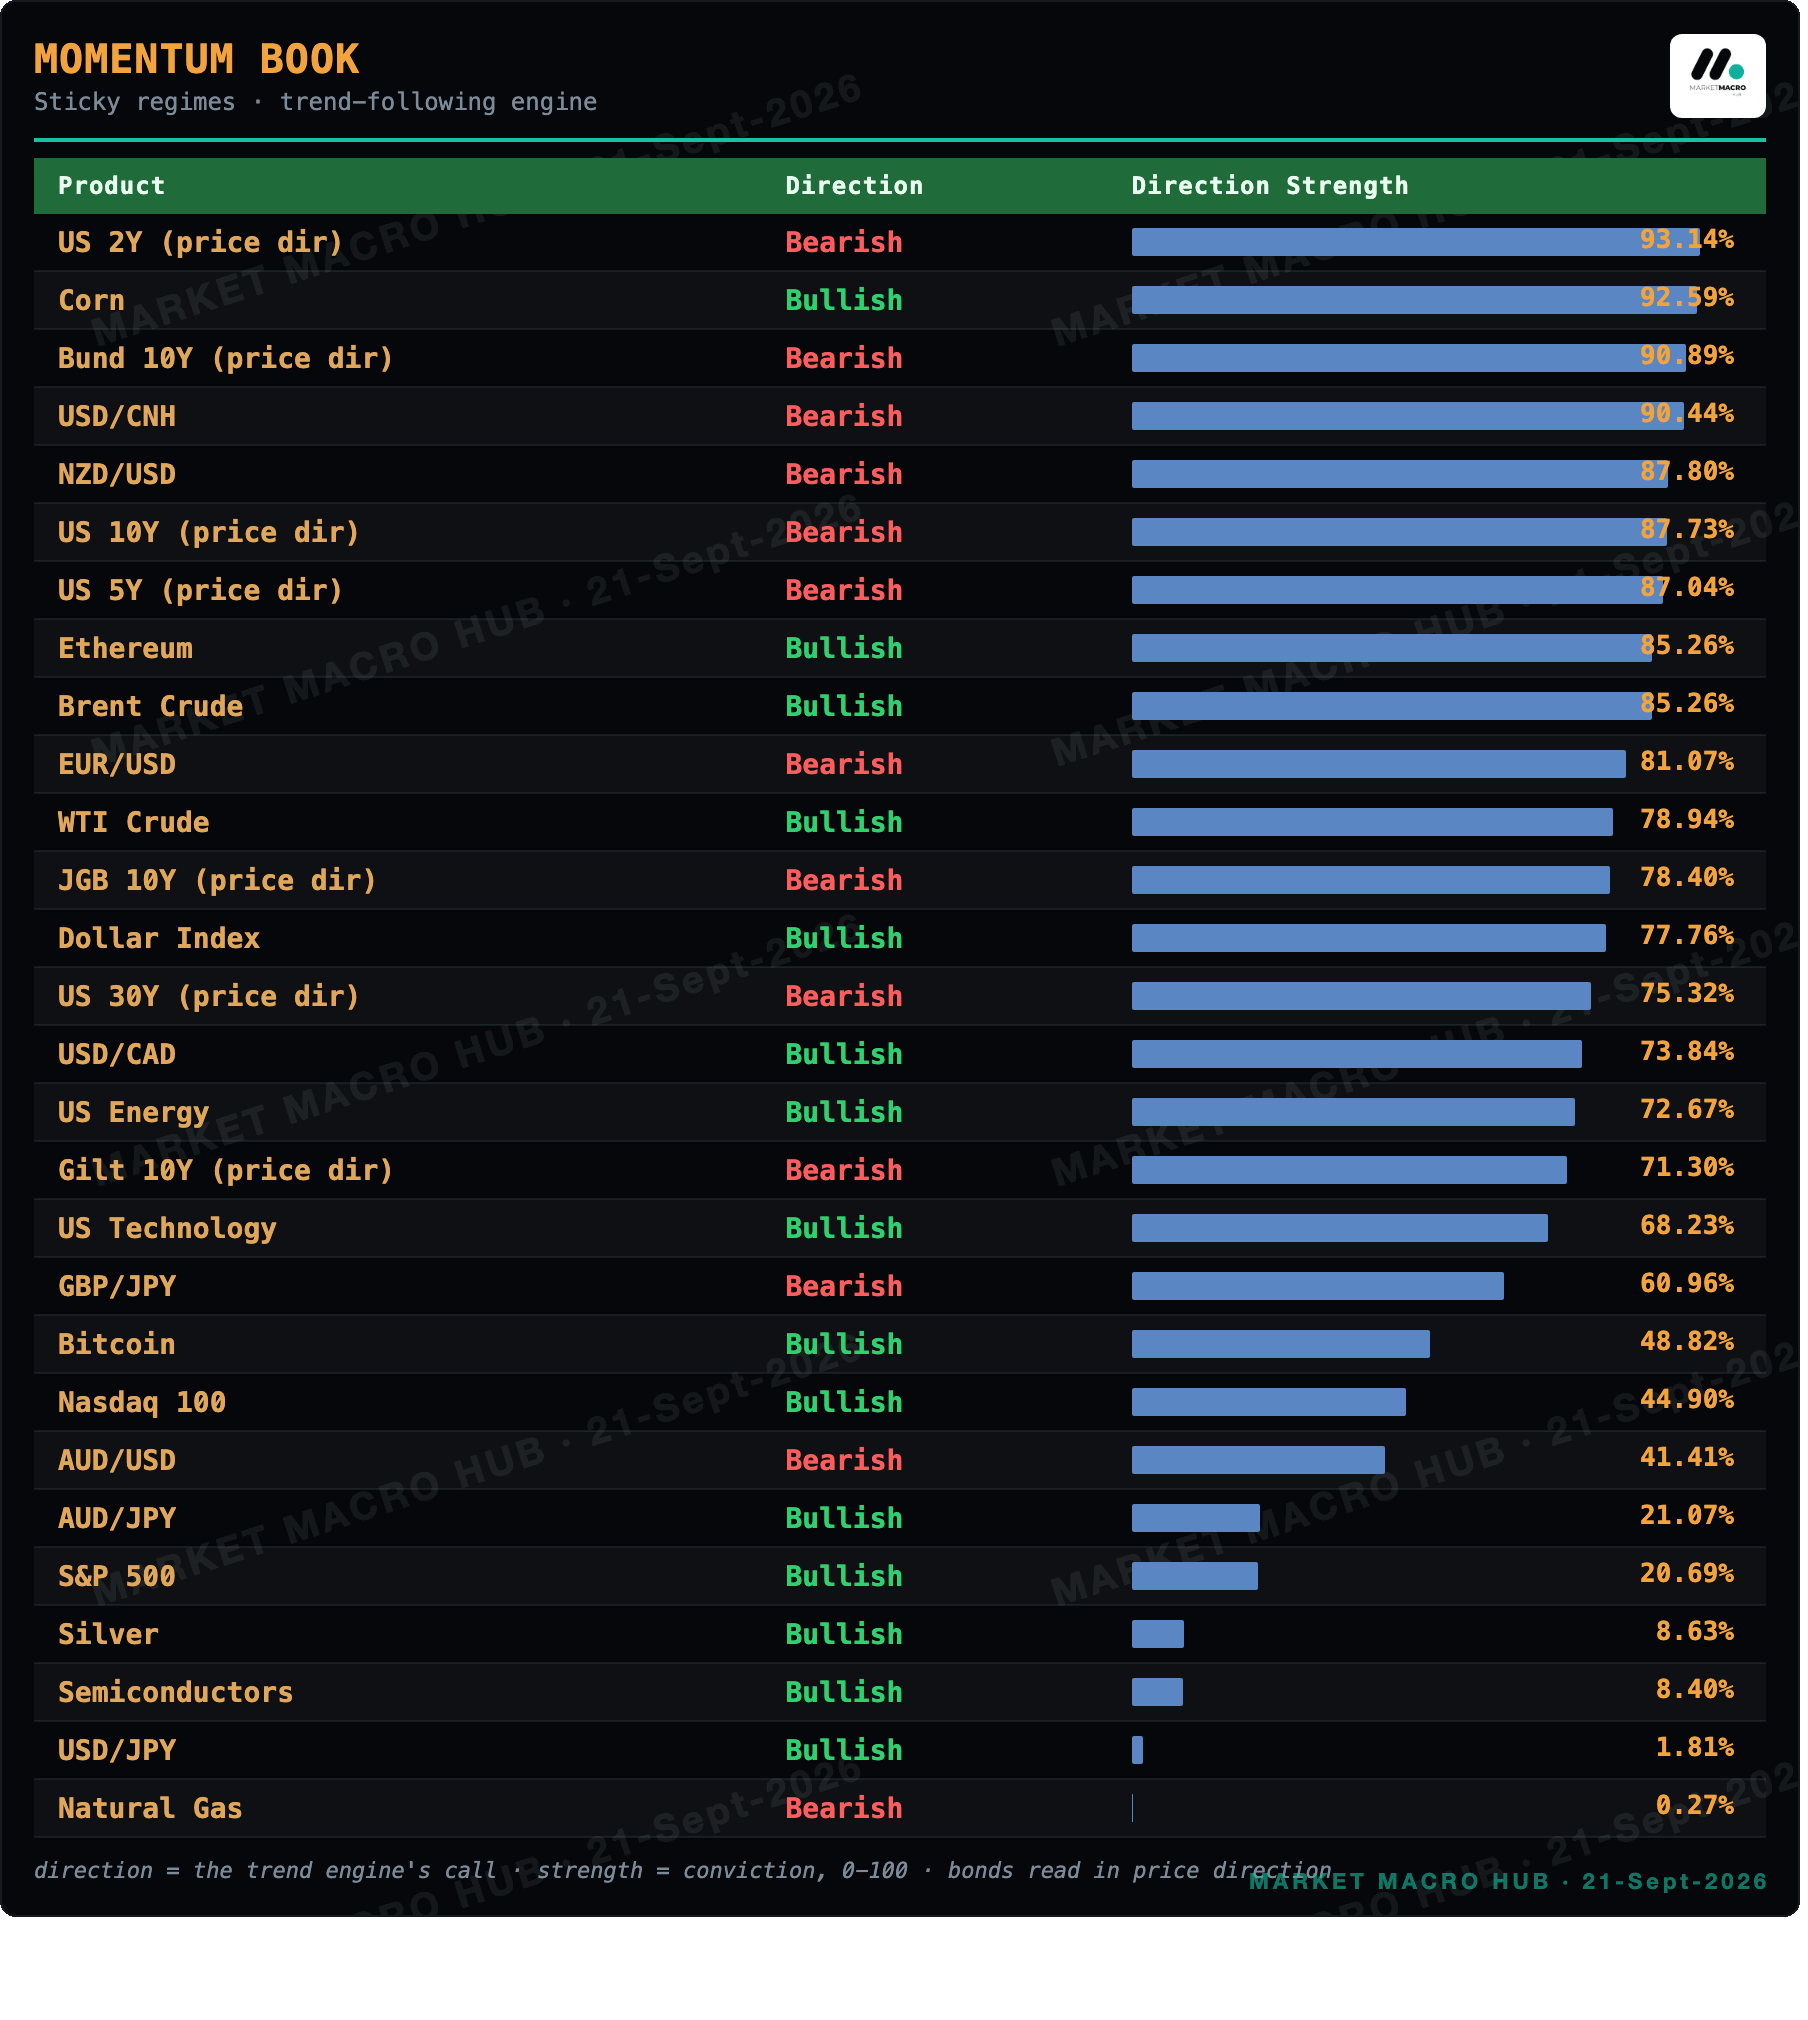
Momentum Book · Sticky Regimes
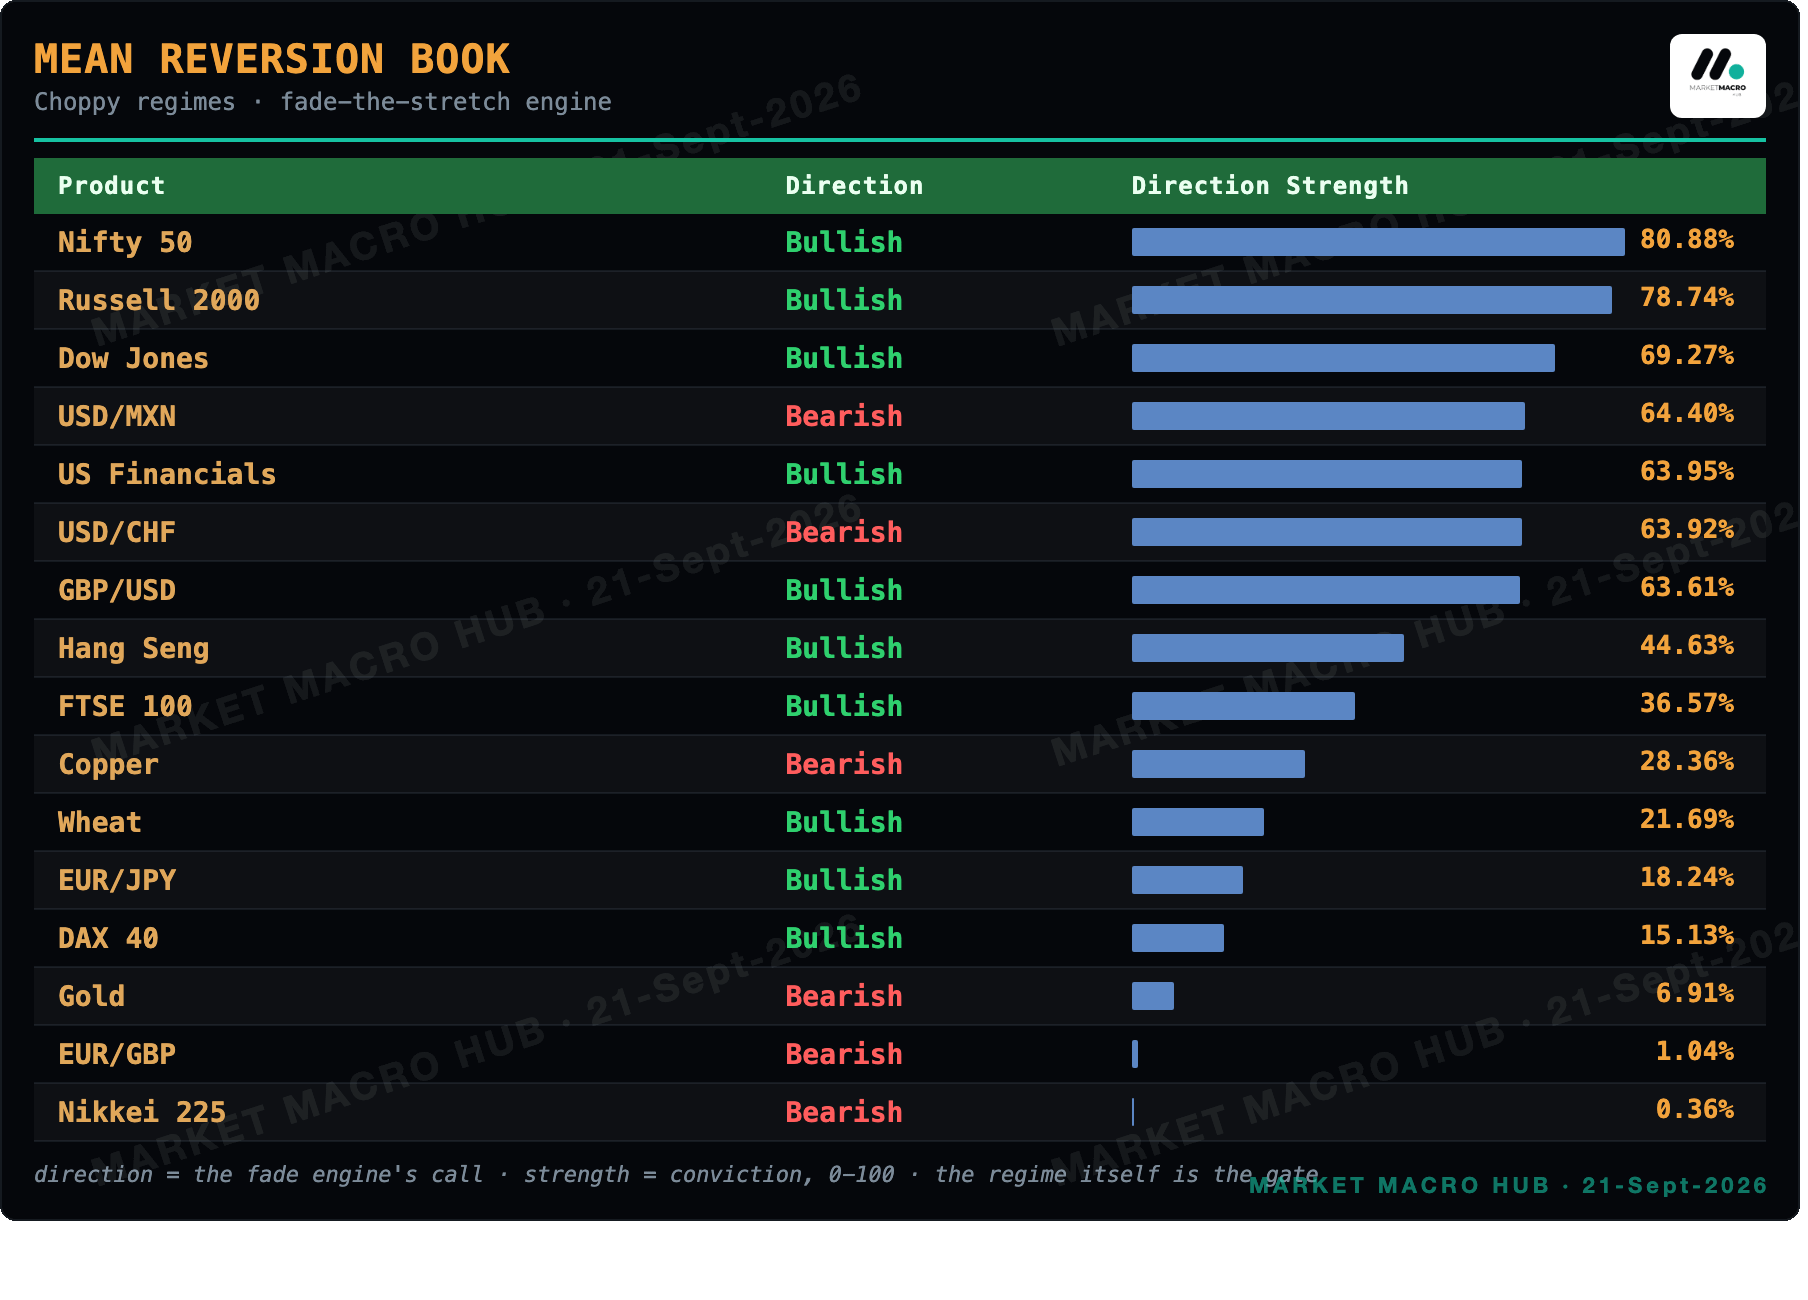
Mean Reversion Book · Choppy Regimes
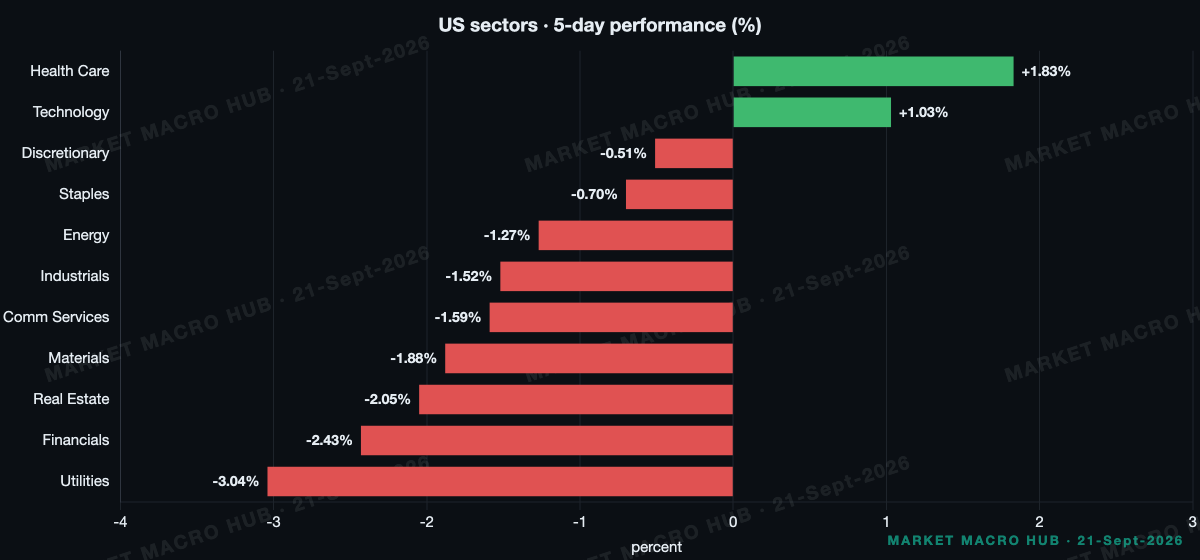
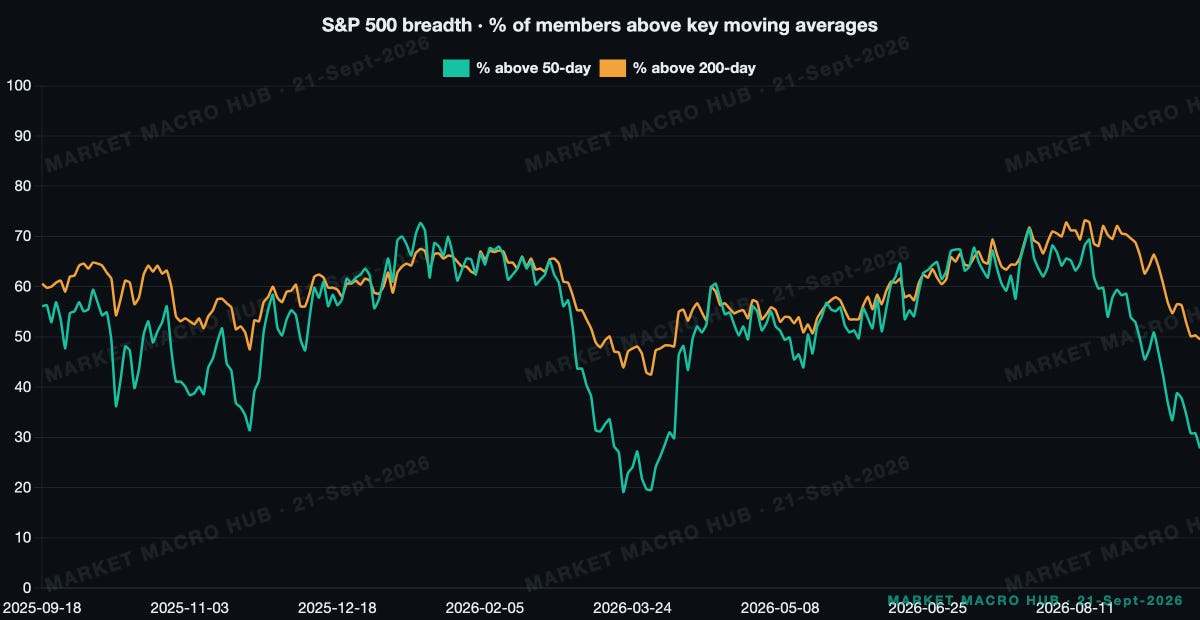
Sector Snapshot & Breadth
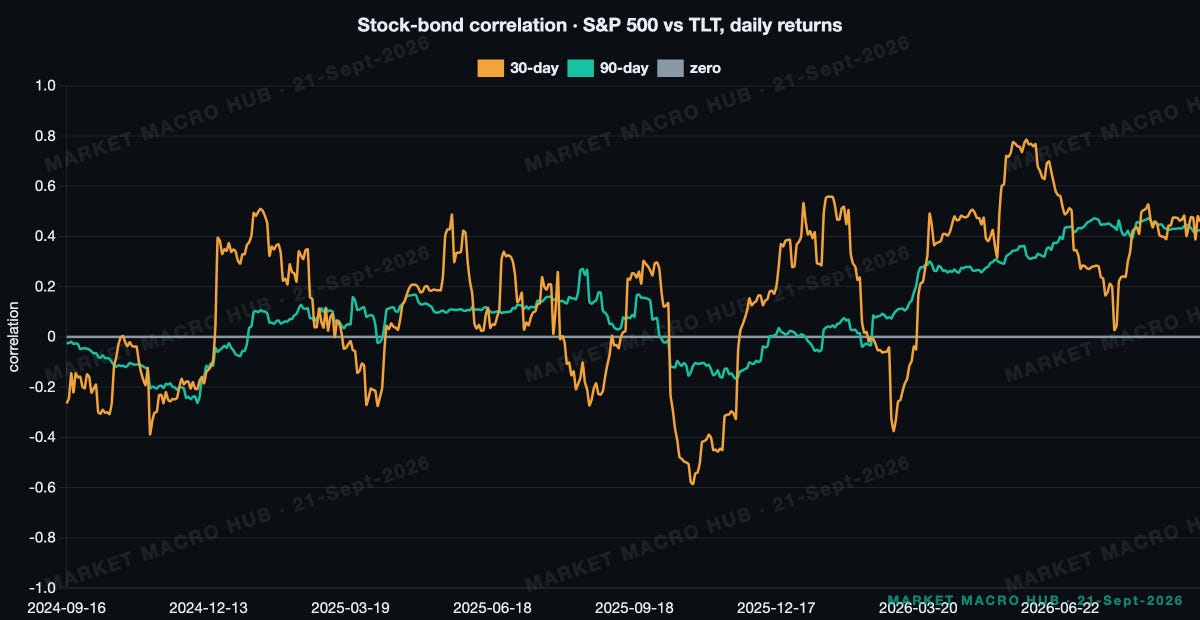
Stock-Bond Correlation
S&P 500 vs TLT, daily returns: 30-day 0.46, 90-day 0.42, positive, so bonds are not hedging equity risk.
Main Developments in Macro
TRUMP SAYS THINKING OF "BLOWING UP" ALL OF IRAN, LEAVES CAMP DAVID EARLY; IRAN KEEPS HORMUZ CLOSED UNTIL CONDITIONS MET - GHALIBAF
FED'S KASHKARI (VOTER): INFLATION TOO HIGH, PRICE PRESSURES SPREAD BEYOND IRAN OIL SHOCK INTO BROADER ECONOMY
FED'S SCHMID: SUPPORTED THE HIKE, DATA SUGGESTS INFLATION TRENDING ABOVE 3%, PROBLEM "NOT JUST ENERGY"
US-CHINA HOLD NEW YORK TALKS AHEAD OF TRUMP-XI SUMMIT, POTENTIAL USD 30BLN RECIPROCAL TARIFF CUTS ON LNG DISCUSSED
HOUTHIS STRIKE SAUDI ARAMCO YANBU FACILITY WITH DRONES, MISSILES; SAUDIS SAY REPELLED
CBA, ANZ BRING FORWARD RBA HIKE CALLS; JAPANESE MARKETS SHUT THROUGH WEDNESDAY THINS CONDITIONS
The data run leans hawkish on inflation, soft on activity. Industrial Production came in at 0% against a 0.3% consensus, and housing kept sagging with starts and permits both under expectations. But the Philadelphia Fed print landed at 37.8 against a 30.5 consensus and claims ran hot at 196. Growth is wobbling at the edges while the Fed's own voters tell me the inflation problem has broadened.
Cross-Asset Read
Thin, tech-led session. On the S&P's +0.17% day, technology carried +0.26pp and industrials added +0.04pp, and the residual did the rest, so I won't read leadership into a move the sectors barely explain. Nasdaq did the work at +0.67%, Russell lagged at -0.63%.
Gold rose 1.2% and its inverse link to the dollar tightened to -0.67, which keeps my gold hedge doing its job while the dollar sits flat. Copper firmed 1.3%. Credit gives me nothing to worry about, IG at 78bp against a 90bp mean, HY at 270bp with risk appetite intact at the low-quality end.
Rates & Fed Pricing
No cut is priced anywhere, the strip never reaches -12.5bp cumulative. The first hike at least half-priced is November at roughly 56%, with December all but locked at 100%. Kashkari said inflation remains too high and that price pressures have expanded beyond the oil shock into the broader economy, and Schmid backed the hike, said data suggests inflation trending above 3% and called the problem "not just about energy". That is why terminal repriced +46bp on the week to peak at 4.65% in December 2027, +77bp cumulative. What changes my mind is the front end, the 2Y buying 7bp of duration against that repricing tells me someone doubts the back half of the path. If the 2s10s starts to steepen off 27bp, that is my steepener paying and my signal the market is fading the terminal.
The Week Ahead
Monday: Goolsbee and the Chicago Fed activity index, tone matters more than the print given how loud the voters have been on inflation.
Tuesday: Williams, Jefferson and Barkin back to back, three voices that could harden or soften the November pricing.
Wednesday: flash PMIs, services consensus 56, this is the release that decides my week, a soft services number is the growth wobble that pressures the hike story.
Wednesday: MBA 30-year mortgage rate after the +19bp weekly jump, watching whether the housing drag deepens.
Through Wednesday: Japanese markets shut, so expect thinner tape and sharper moves on headlines out of the Trump-Xi summit and Iran.
Tradeable Levels
Pivots off the last completed session (2026-09-18). Levels marked * sit within 0.6 x ATR14 of the close.
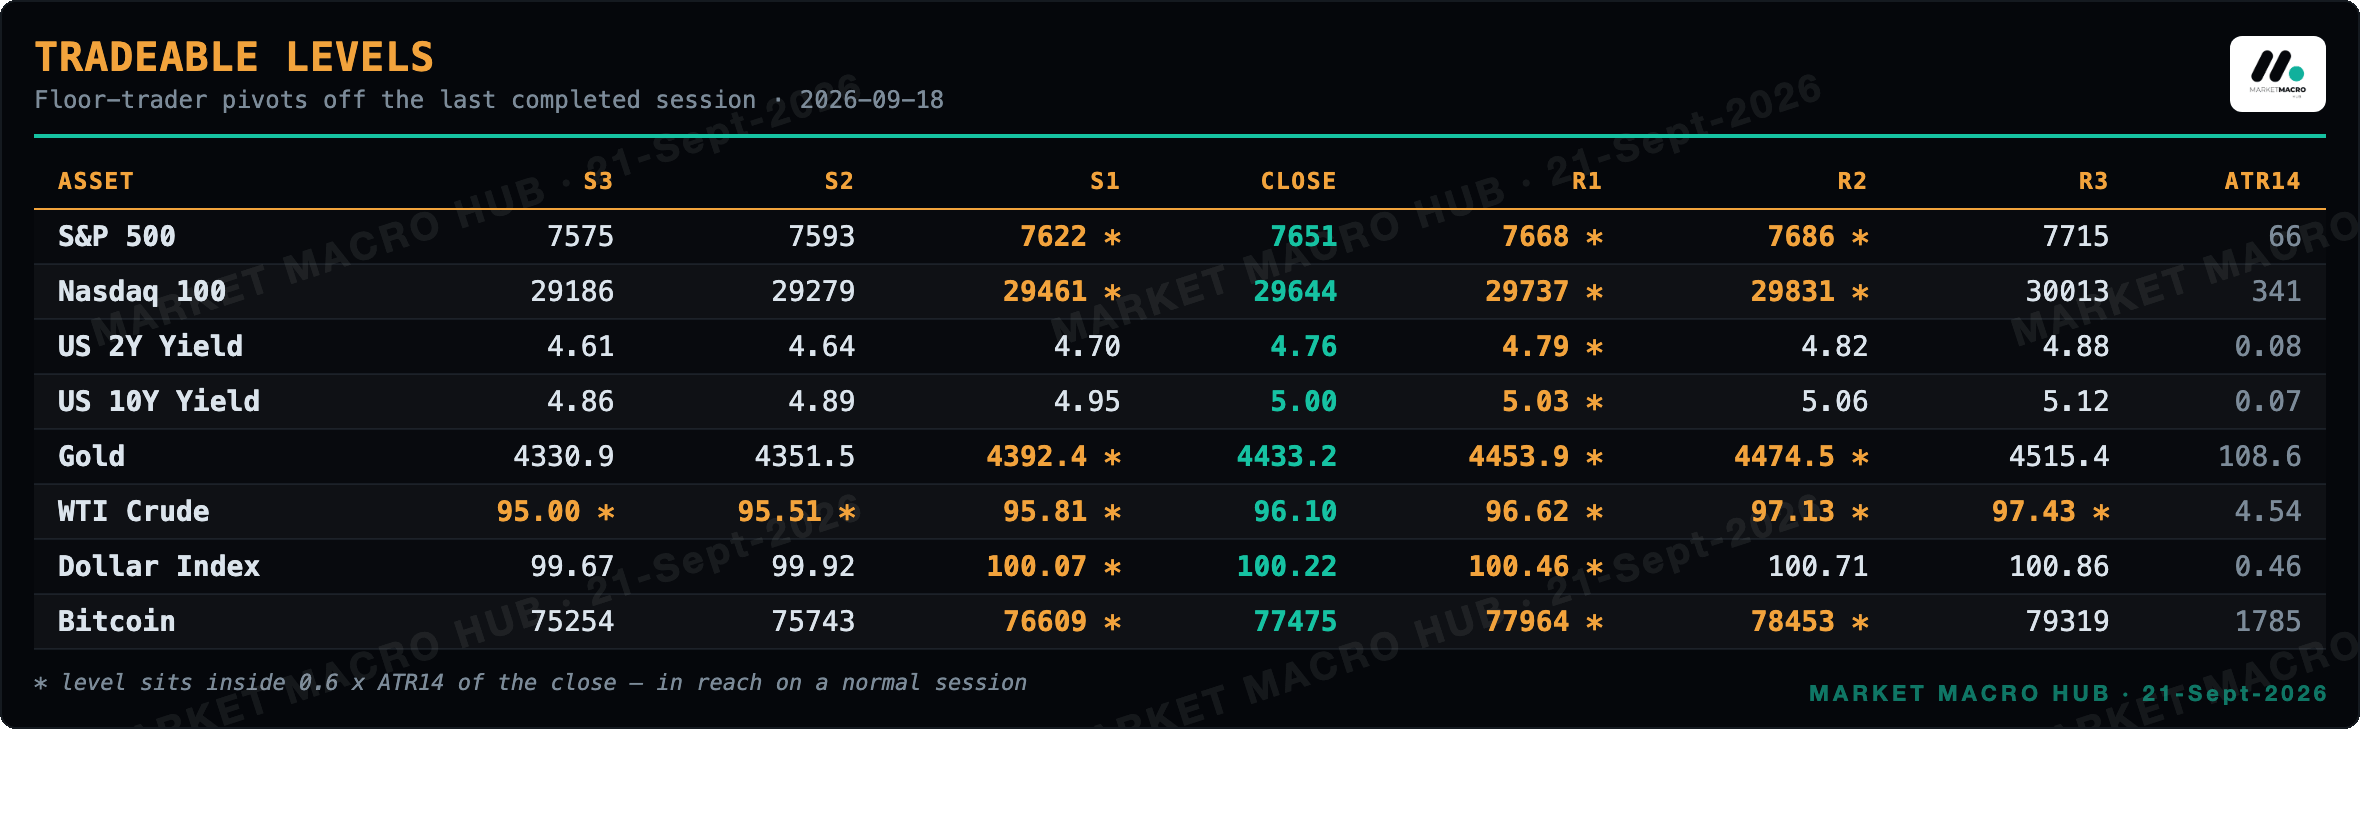
WTI Crude priced off a session whose range was under a third of normal travel, so that board is compressed and nearly every level sits in reach. Weekend crypto and half-day holiday sessions do this; treat the levels as loose rather than precise.
Vol Screen · Rich and Cheap Implied Vol
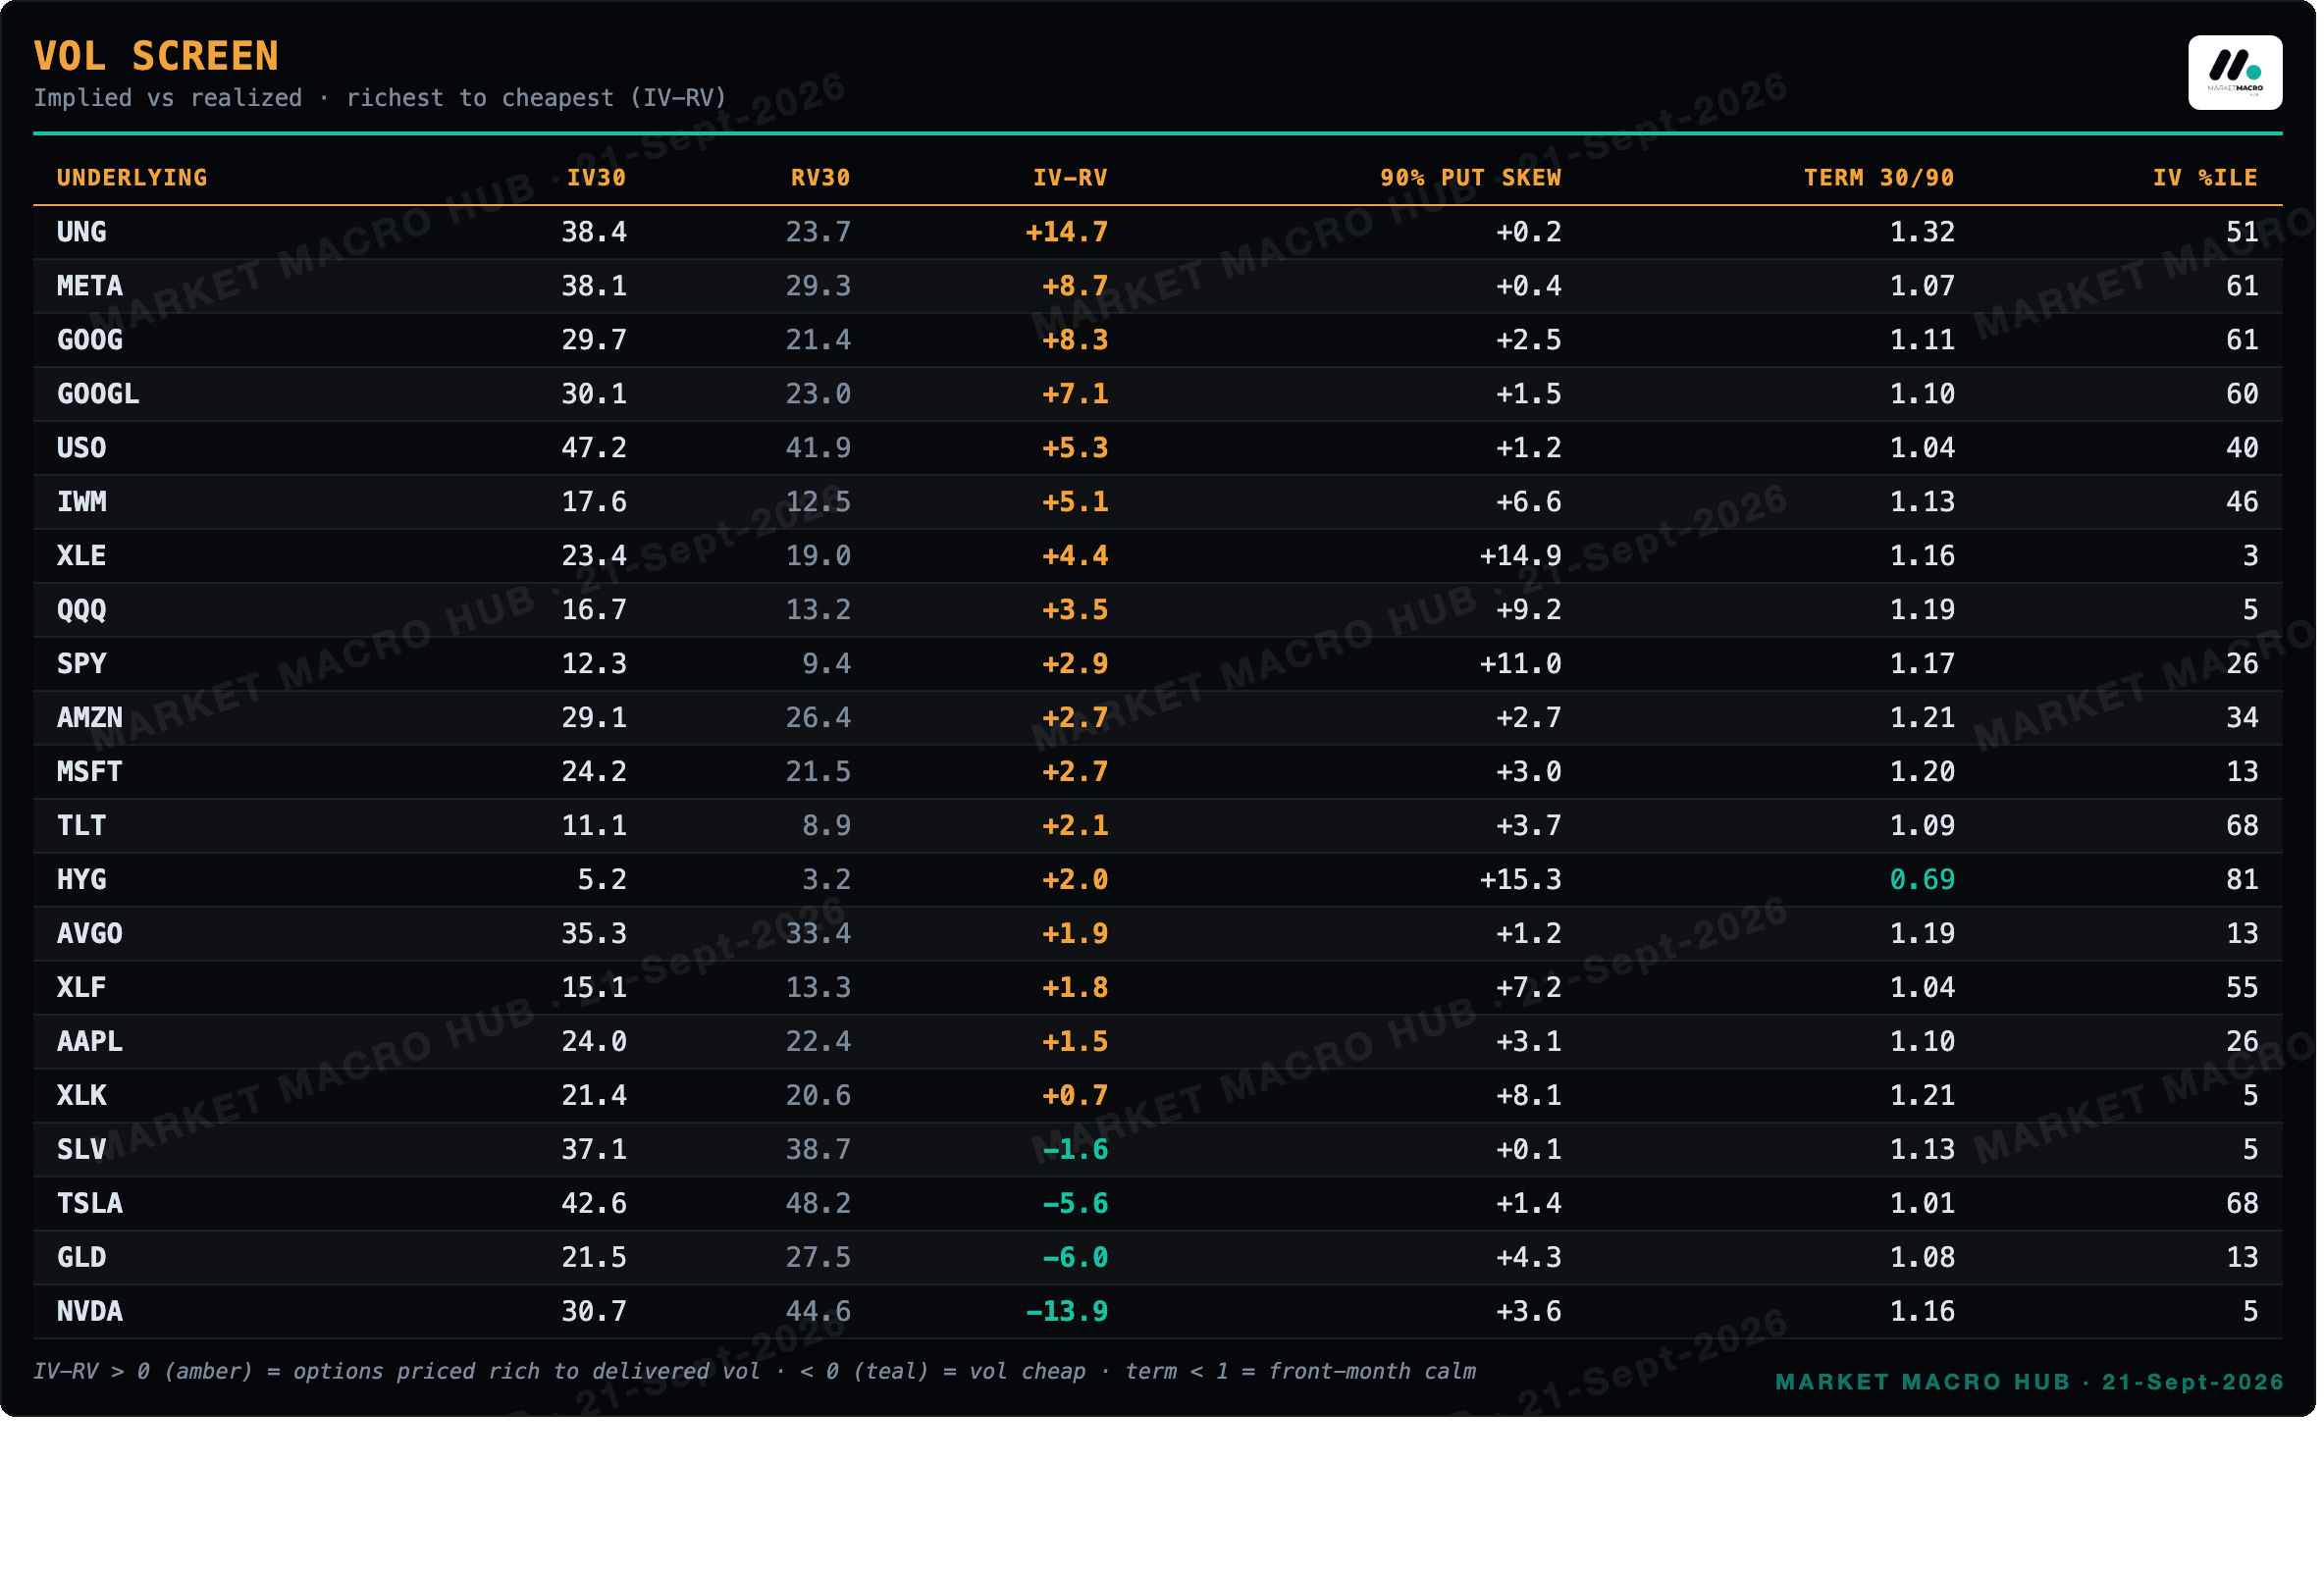
Positive IV-RV = options priced rich to what the tape is delivering (UNG and META richest today); negative = vol going cheap (NVDA and GLD). Percentiles are each name's own archive history.
The Measured Books · Monday Edges
E1 · Slow trend (12-1): live on equities and crypto only (measured noise elsewhere): US Energy LONG · Semiconductors LONG · Russell 2000 LONG · FTSE 100 LONG · Nikkei 225 LONG · S&P 500 LONG · +9 more
E2 · FX carry: signal only when the policy differential is 1%+ wide: EUR/JPY LONG (+26.99%) · EUR/GBP LONG (+24.51%) · EUR/USD LONG (+24.24%) · USD/CHF LONG (+4.00%) · AUD/JPY LONG (+3.10%) · the edge concentrates in the JPY-funded crosses
E3 · Curve (2s10s momentum): slope 27bp, -2bp over 63 sessions → 63d trend FLATTENER (shorter-horizon state can differ · see appendix) · short 2Y (ZT) / long 10Y (ZN), roughly 2:1 DV01
E4 · Variance risk premium: POSITIVE, harvest is on (long SPX) · 48th percentile of its own history
E5 · Net liquidity (WALCL-TGA-RRP): $5.86tn, +15bn over 13 weeks → rising, supportive for NDX/SPX
Disclaimer
The information in this publication is provided for informational and educational purposes only and is believed to be reliable, but its accuracy and completeness are not guaranteed. Nothing herein constitutes investment advice, an offer, or a solicitation to buy or sell any security, derivative, digital asset, or other financial instrument, nor a recommendation suited to any specific reader. All figures are drawn from the day's computed data set at the time of generation and may be delayed, revised, or superseded. Markets involve risk, including the possible loss of principal; past performance and historical relationships do not guarantee future results. Readers should conduct their own research and consult a qualified financial adviser before making any investment decision. The author may hold positions in instruments discussed. This publication is licensed for the personal use of the subscriber only: redistribution, reproduction, or resale in any form is prohibited. © 2026 MARKET MACRO HUB. All rights reserved.