



Today's Tear Sheets
The full daily pack is attached below · six PDFs generated from the same computed data set as this note:
Macro Regime · curve regimes, growth x inflation quadrant, breadth, credit, vol term structure, liquidity, stock-bond correlation, crypto cross-asset, housing
Fixed Income · UST complex, global curves, Fed/ECB/BoE/BoJ implied policy paths, global 2Y and 10Y panels
Equities · index pages, relatives, vol suite, global relatives, Mag7+ quant sheet, options surfaces
FX · majors dashboards, correlations, COT positioning, crosses
Commodities · energy, metals, agriculture, COT crowding, term structure
Crypto · BTC ladders, ETH, macro correlations, ETF flow proxy

Every number in this note is computed by the desk's own systematic engines across 44 markets, then read in plain language. Five minutes and you're caught up.
In This Issue
Where We Stand
Asset Market Pricing
Sector Attribution
Momentum Book · Sticky Regimes
Mean Reversion Book · Choppy Regimes
Sector Snapshot & Breadth
Stock-Bond Correlation
Main Developments in Macro
Cross-Asset Read
Rates & Fed Pricing
Bottom Line
The Week Ahead
Tradeable Levels
Vol Screen · Rich and Cheap Implied Vol
The Measured Books · Monday Edges
Where We Stand
Yesterday we held that core CPI at 0.3% waited for the FOMC to confirm, and this morning's tape confirms it as the strip lifts to a hike. On our oldest view, short oil versus equities opened eight days ago, the crude-equity correlation has deepened to -0.65, and the position holds. The copper crowding flag stays live at the 100th percentile of positioning, and we would still not chase the metal.
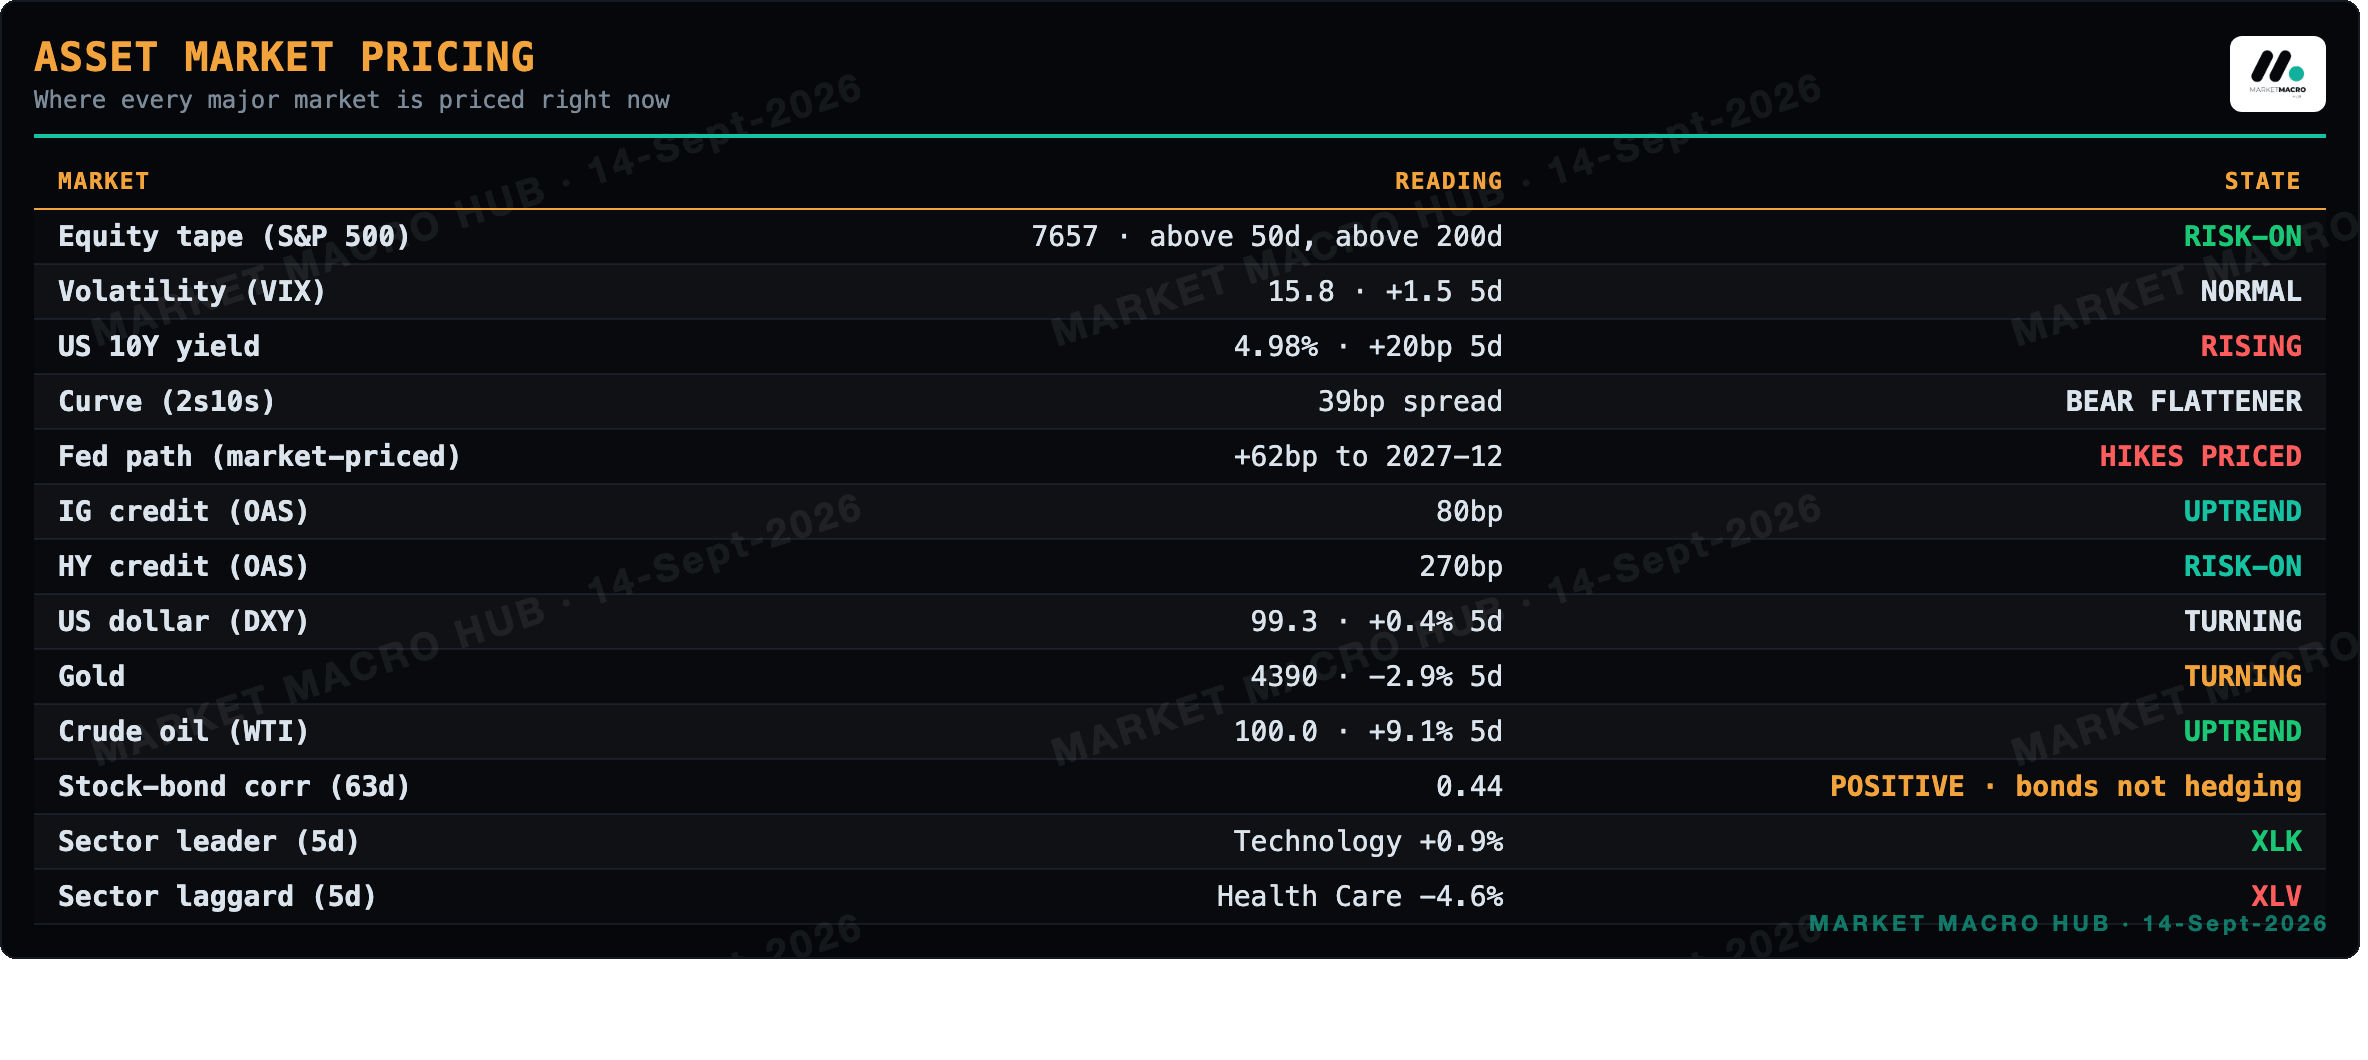
Asset Market Pricing
Sector Attribution
Where the index move came from on 2026-09-11. Each sector's day multiplied by its approximate index weight gives its contribution in percentage points. The sectors and the unexplained remainder sum exactly to the index move, and the sector split accounts for 96% of it.
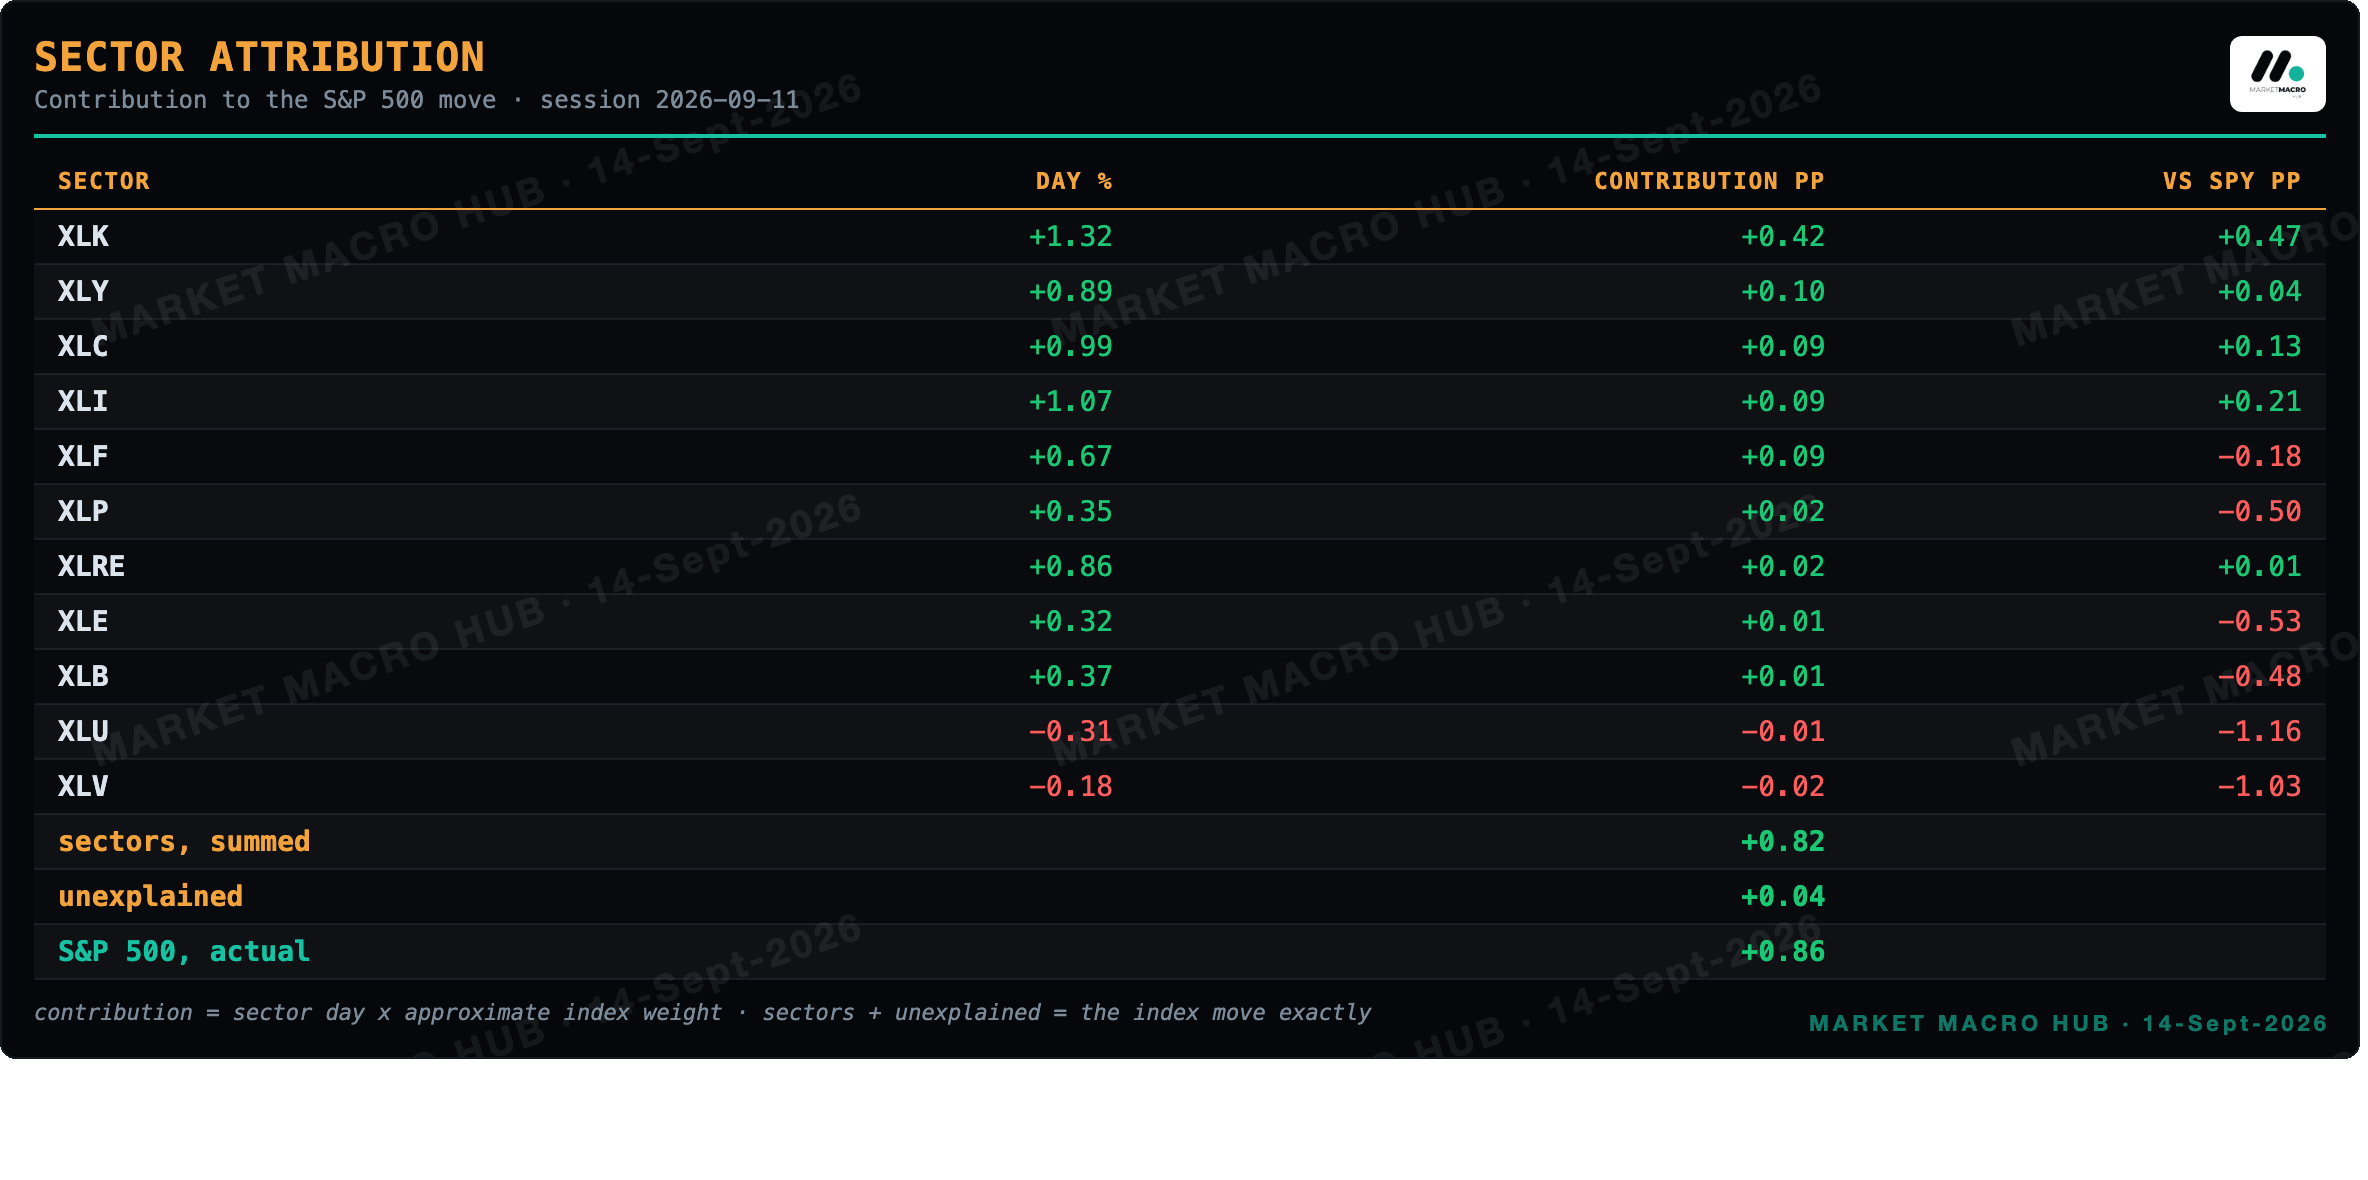
The remainder is not an error term to ignore. Index weights drift and sector ETFs are not the index's own constituents, so a decomposition of this kind never closes on its own. Reading the residual is how you know whether the sector story explains the day or only decorates it.
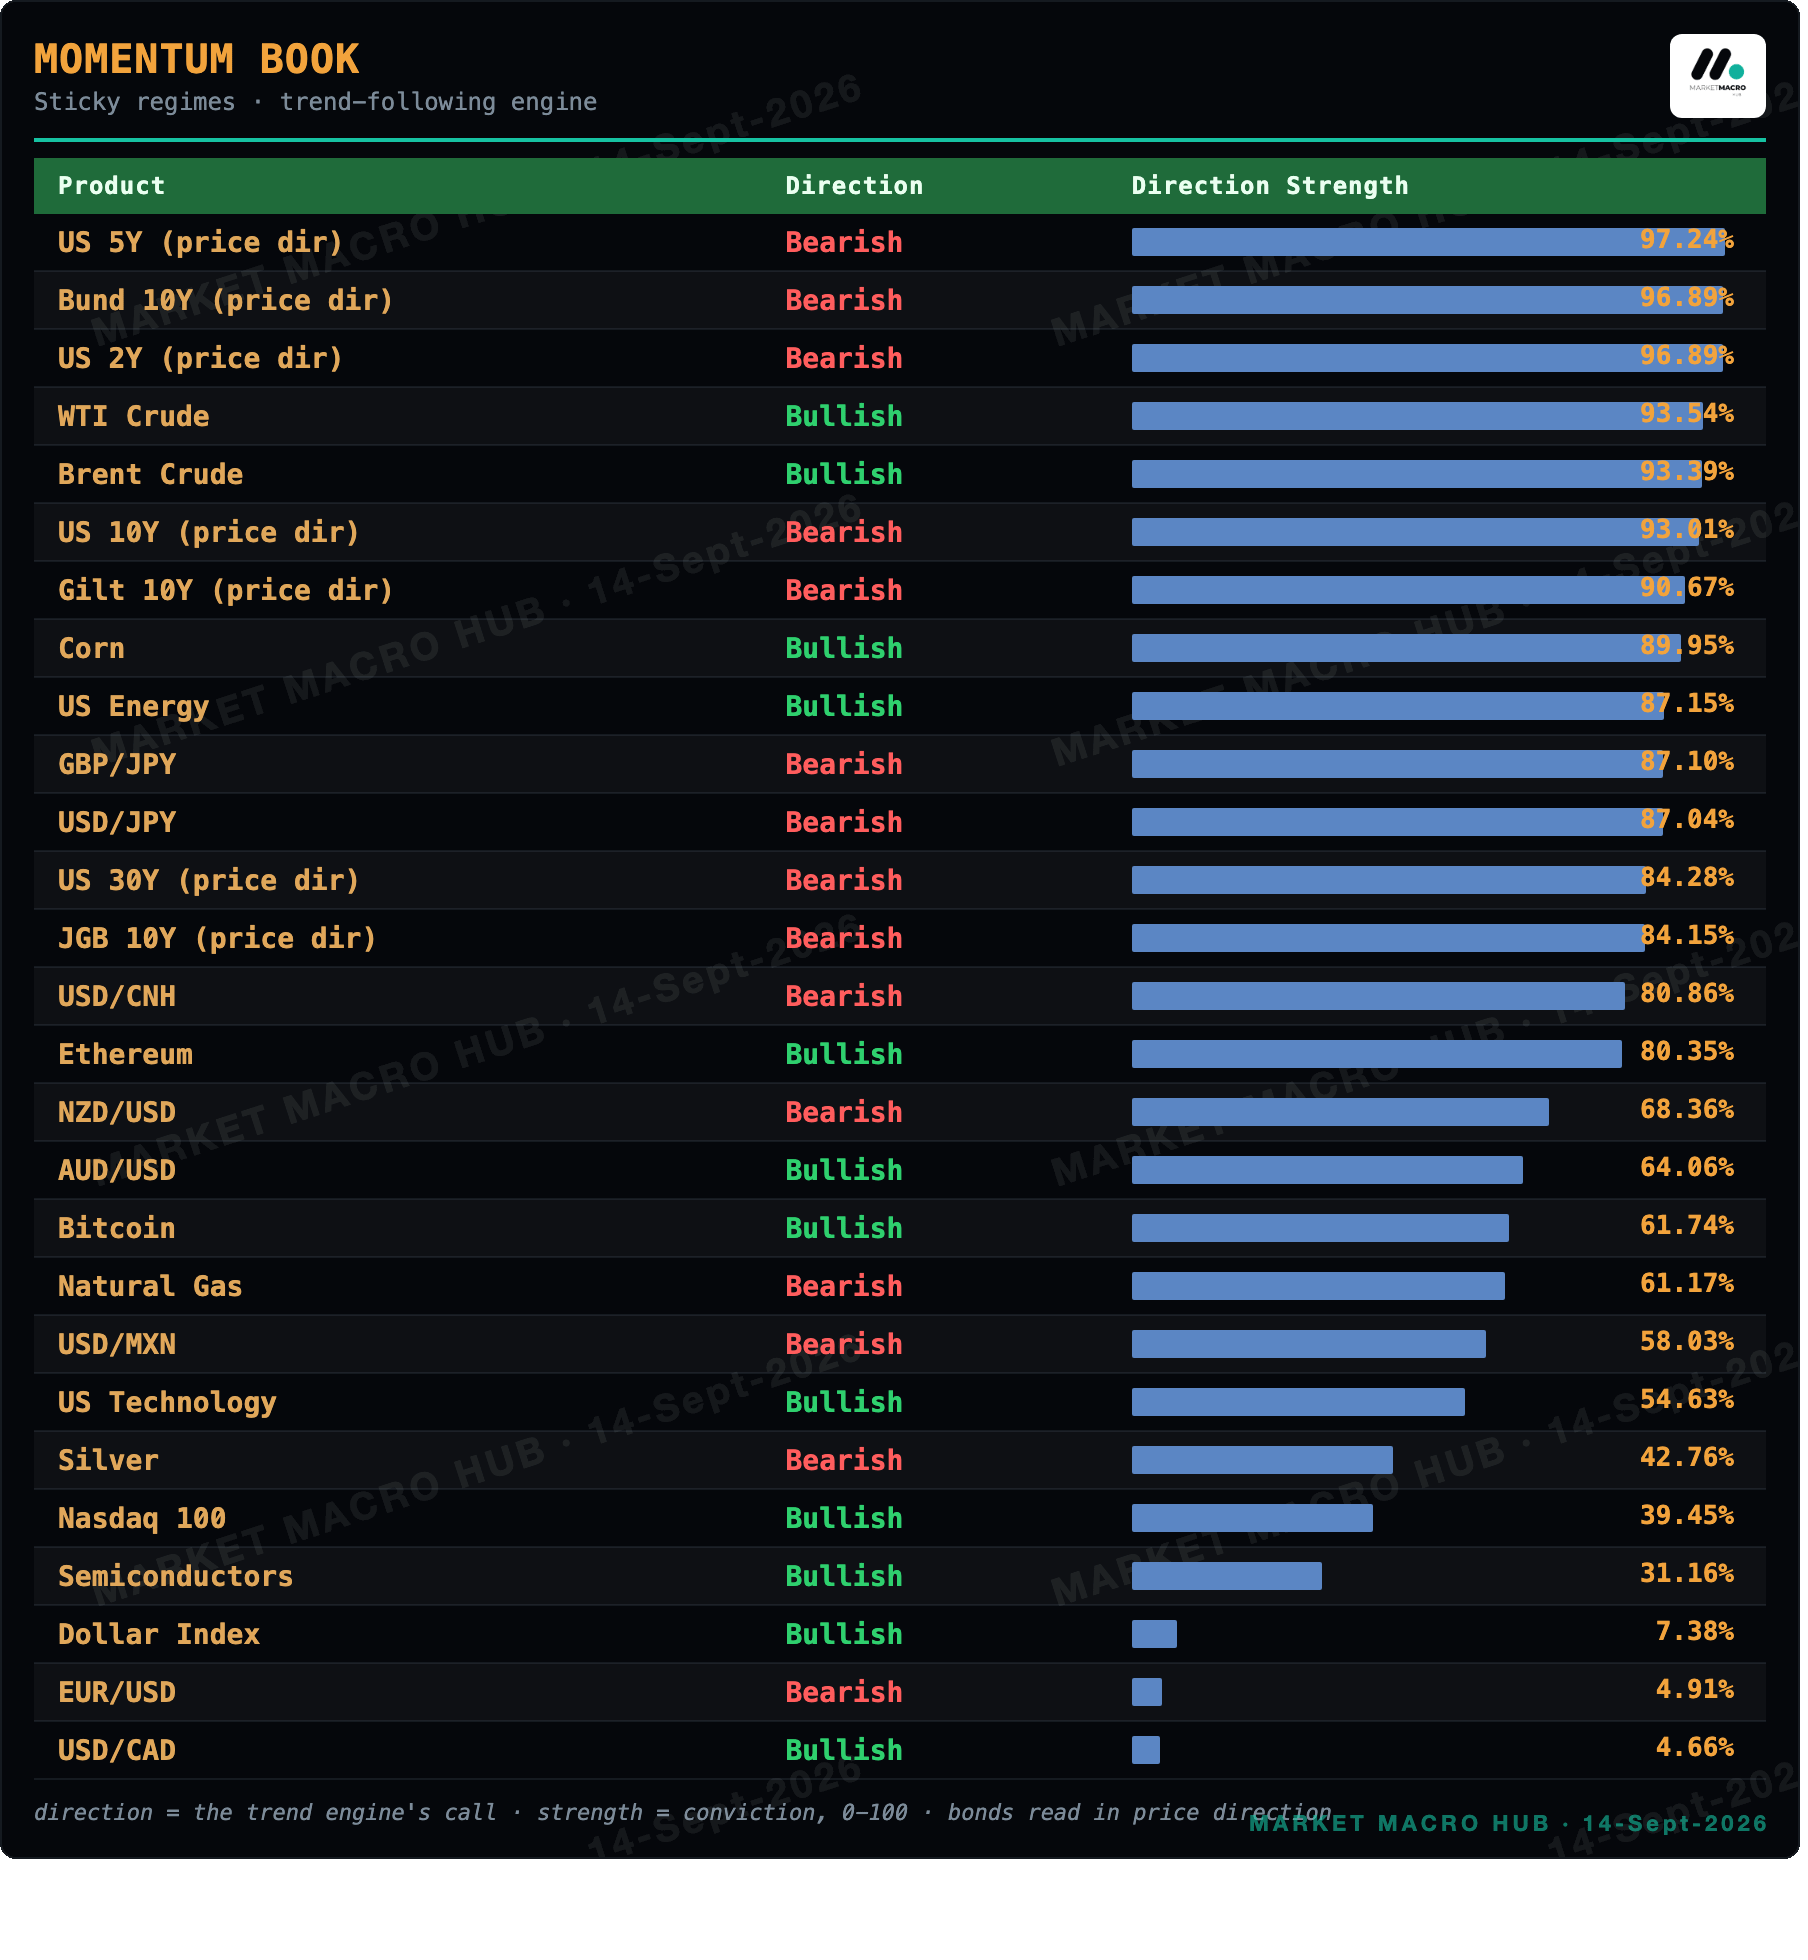
Momentum Book · Sticky Regimes
Assets whose regime is sticky (Markov persistence 6+ days): trends run, so the momentum engine sets the direction, and conviction rises with the strength bar.
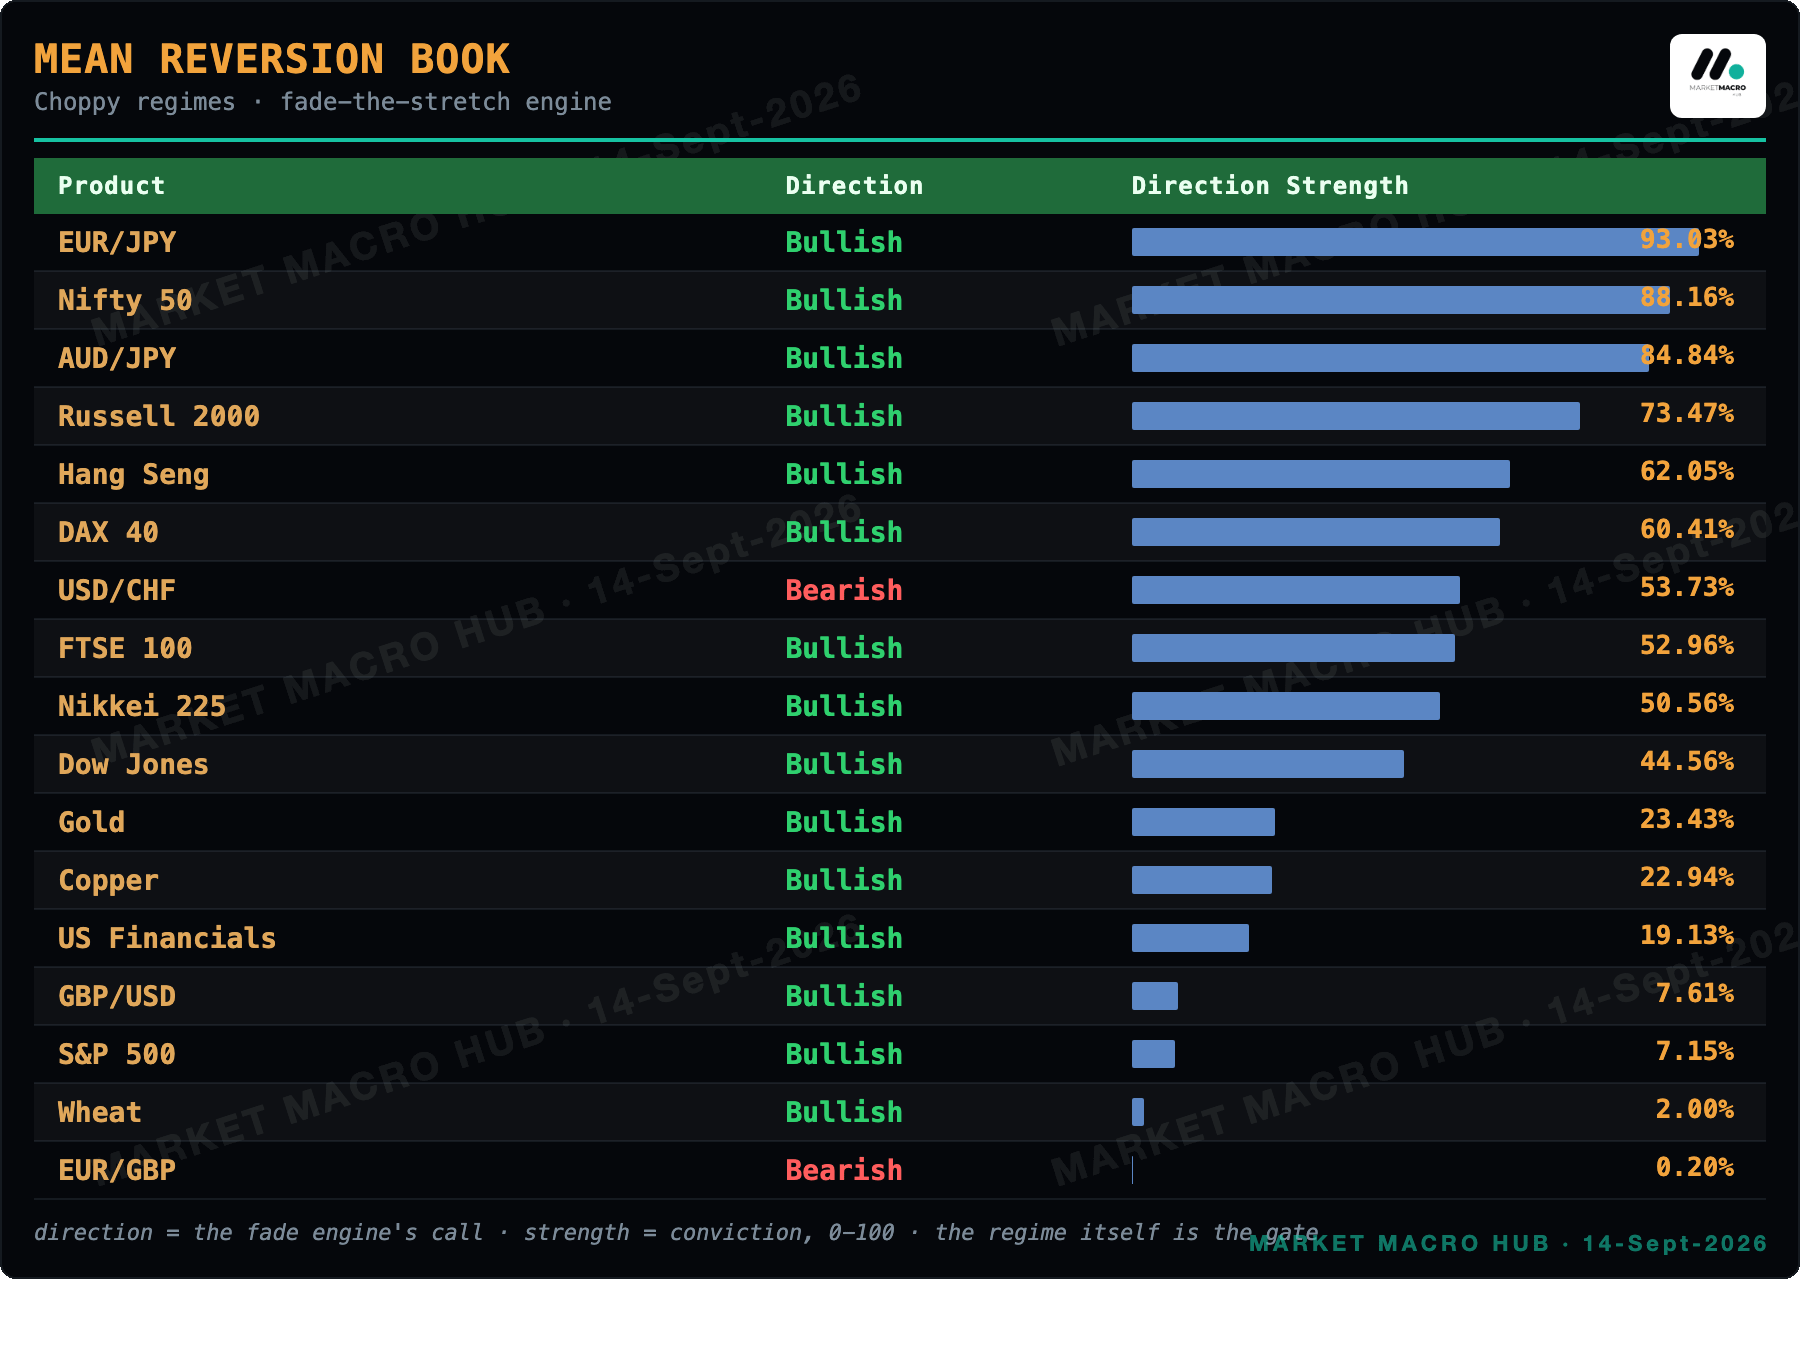
Mean Reversion Book · Choppy Regimes
Assets whose regime is choppy : trends get faded, so the mean-reversion engine sets the direction against the stretch from the 21-day average.
Sector Snapshot & Breadth
Stock-Bond Correlation
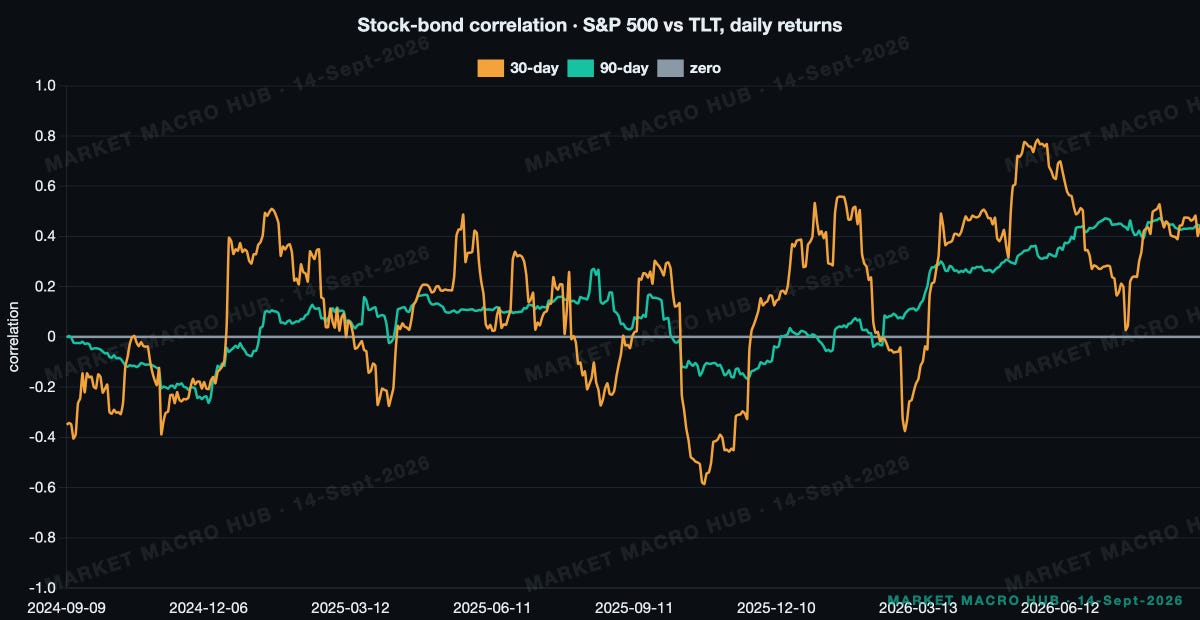
Rolling correlation of S&P 500 and TLT daily returns. The 30-day reads 0.44 against 0.44 on the 90-day: positive · bonds are NOT hedging equity risk. This is the number that decides whether a 60/40 book is diversified or simply levered to one factor.
Main Developments in Macro
US CORE CPI ROSE 0.3% M/M VS 0.2% CONSENSUS, MARKETS NOW PRICE A HIKE THIS WEEK NEAR 86% FROM 70% PRE-DATA
SAUDI ARABIA SHUT EAST-WEST PIPELINE AFTER DRONE ATTACKS, THREATENING 4% OF GLOBAL SUPPLY, WTI +2.5%
OMAN POSTPONED PERSIAN GULF MEETING INDEFINITELY, IRAN HORMUZ SHIPPING-LANE DEAL UNVEILING DELAYED
AI SLOWDOWN CALLS FROM ANTHROPIC, OPENAI AND SPACEX CEOS DRAG NASDAQ FUTURES, NQ -1.3%
DXY FIRMER AT 99.34 INTO MID-WEEK FOMC, MONEY MARKETS LEAN TOWARDS A HIKE
ECB'S LAGARDE SAID CURRENT INFLATION SHOCK IS LONGER-LASTING; SCHNABEL, CIPOLLONE AND LAGARDE DUE TO SPEAK
The growth-inflation split is the story into the meeting. Core CPI rose 0.3% M/M, above the 0.2% forecast, while headline stayed in line at 3.4%. That is a sticky-core read with cooling breadth, and we treat it as enough for a hike while stopping short of calling it a trend.
The soft patch is real underneath. Michigan sentiment printed 47.8 against a 51 consensus, and core PPI at 0.2% came in below the 0.3% call. Our read is that the Fed hikes on the core beat and the growth wobble waits behind it.
Cross-Asset Read
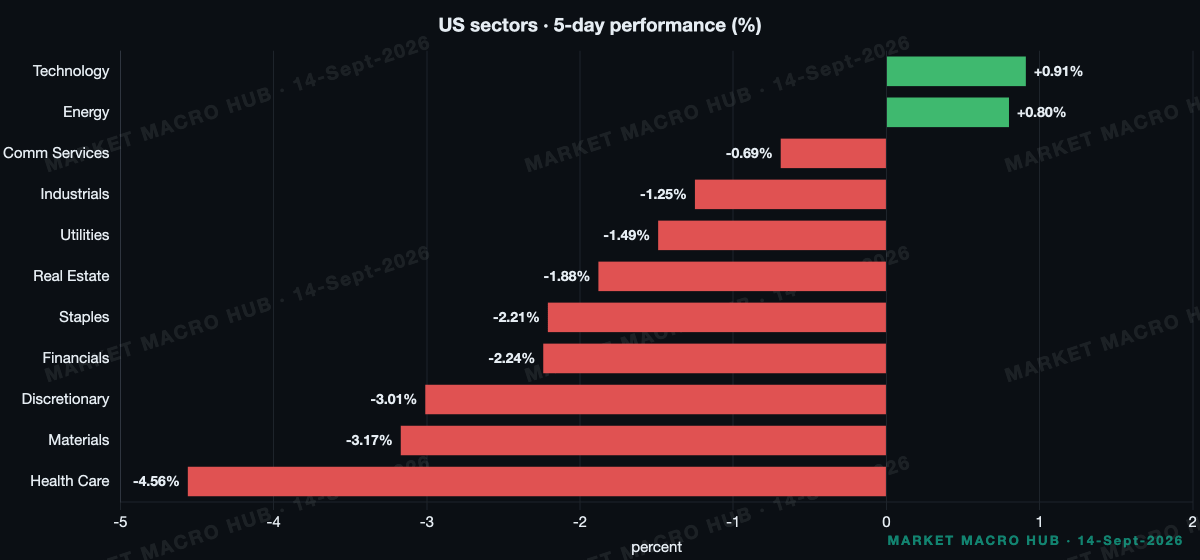
Technology did the leading again. XLK contributed +0.42pp of the +0.86% session, with consumer discretionary next at +0.10pp, so the tape leant on the same megacap complex the AI-slowdown headlines now threaten overnight.
The scoreboard that matters is the front end. US 2Y rose +13bp and 10Y +12bp as the strip repriced the hike, while VIX fell 2pts to 15.85 at the calm end of its range. The SPX-crude correlation at -0.65 flagged a BIG SHIFT from -0.57, which means our oil hedge against equity risk works again.
Credit is not corroborating any anxiety. IG OAS sits at 80bp, at the tight end of its own range, a carry regime versus a 90bp mean; HY at 270bp shows risk appetite intact at the low-quality end. If IG breaks 90bp, then we close the carry view; until then, the 80bp level holds and we stay long the carry.
Rates & Fed Pricing
No cut is priced anywhere on the strip. The first move fully in the money is a 25bp hike at the October meeting, near 92% odds, and we treat that as the market's base case into Wednesday. Cumulative tightening builds to +23bp by October and the strip peaks at 4.55% in October 2027, +92bp above the 3.63% effective rate.
The reason is this week's repricing. The terminal repriced +14.5bp on the week while sitting flat on the day, so the hot core print did the work and Friday's reversal did not undo it. If Wednesday's FOMC delivers the hike the strip already holds, then the front end has little left to chase; until then, we would fade the temptation to press 2Y shorts here.
Bottom Line
Core CPI at 0.3% holds our pre-FOMC stance into Wednesday.
The 2Y at +13bp leads a front-end selloff we do not chase.
IG carry at 80bp holds, with invalidation still pinned at 90.
Short oil versus equities holds on a -0.65 correlation that keeps deepening.
Copper at the 100th percentile of positioning waits, and stretched longs keep us clear.
The Week Ahead
Tuesday's Empire State Manufacturing (cons 14.75 vs prev 20.6): a print holding above 14 keeps our growth-wobble-behind-inflation read; a sharp miss below brings the soft patch forward.
Wednesday's FOMC decision: the 25bp hike the strip prices keeps our stance; a hold reverses the whole front-end read.
Wednesday's Retail Sales (cons 0.9% vs prev -0.6%): a rebound to consensus confirms the consumer holds and backs the hike; a second negative print challenges it.
Wednesday's Retail Sales Control Group (cons 0.4% vs prev -0.4%): a positive turn keeps the growth read intact; another negative keeps the Michigan warning alive.
Wednesday's Import Prices (cons 0.4% vs prev -0.4%): an in-line print leaves the inflation read unchanged; a hot surprise adds to the sticky-core case.
Tradeable Levels
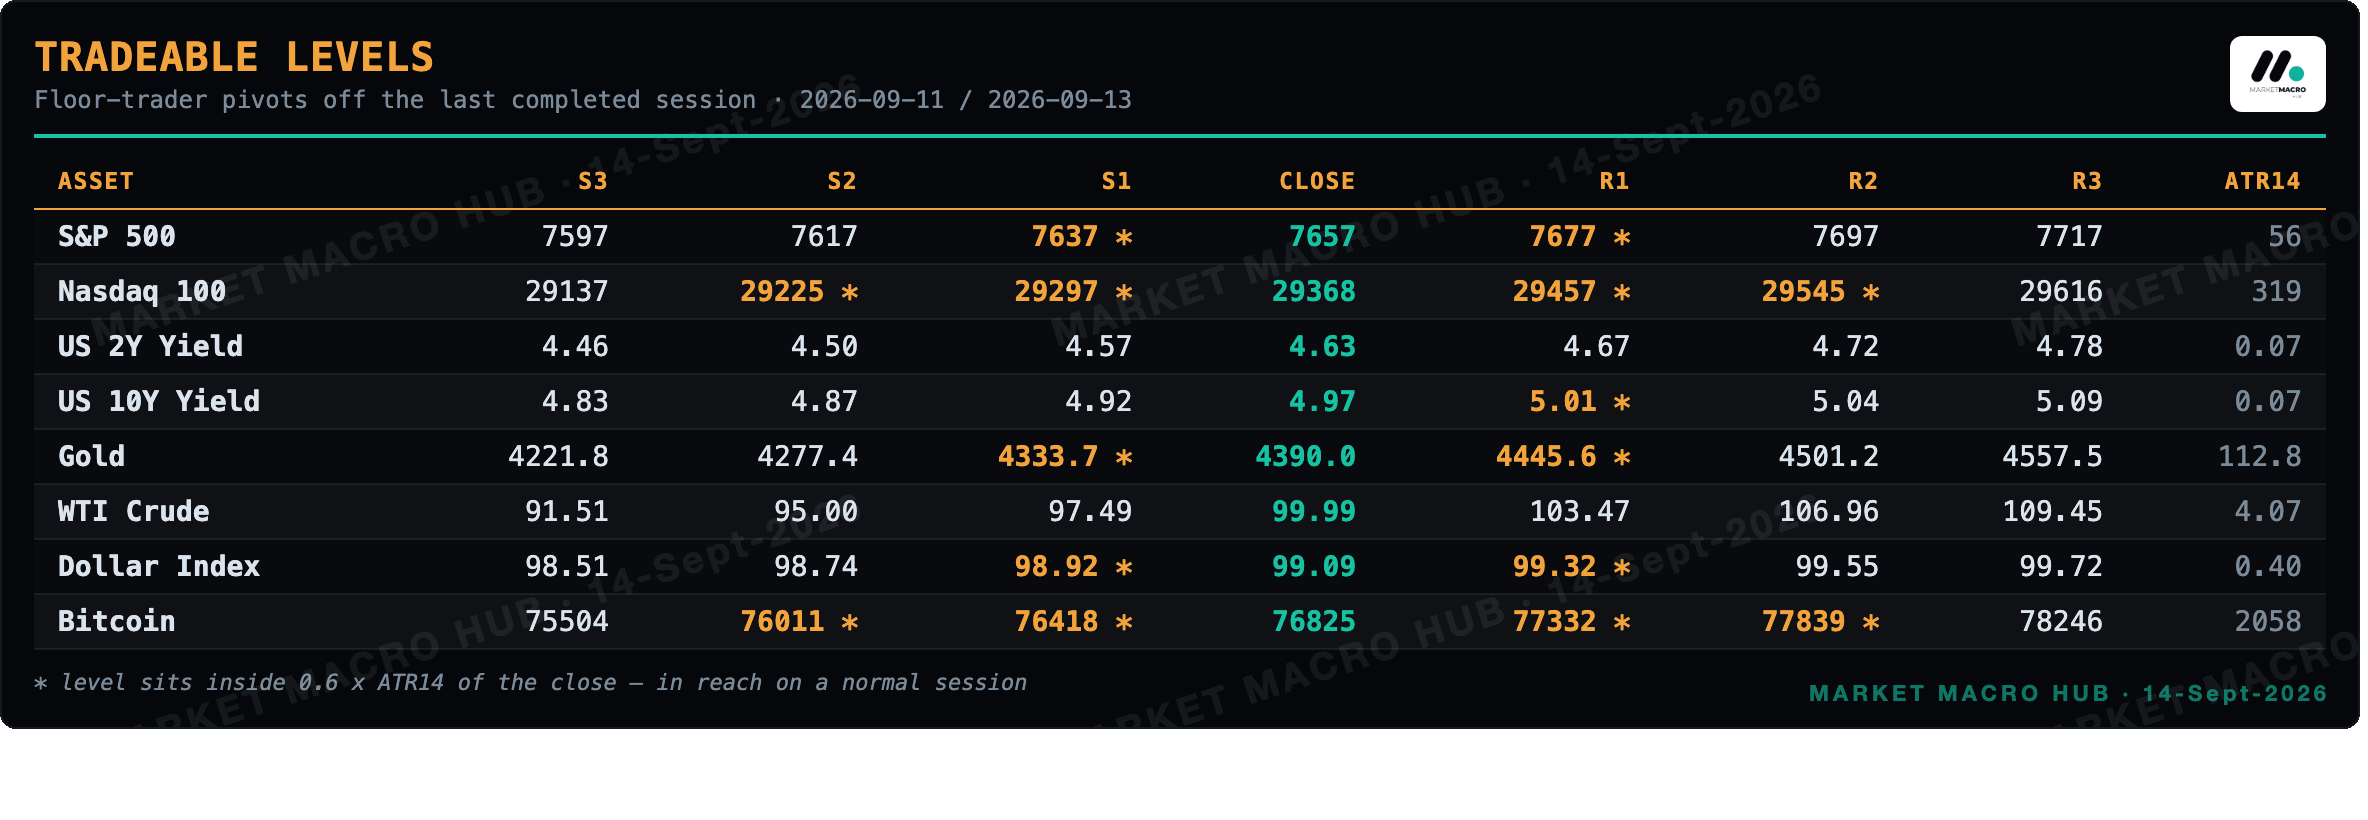
Floor-trader pivots off the last completed session (2026-09-11 / 2026-09-13), with the 14-day average true range as the day's expected travel. Levels marked * sit inside 0.6 x ATR of the close, which is the band the session usually reaches. These are reference geometry drawn from the market's own range, not a directional call.
Vol Screen · Rich and Cheap Implied Vol
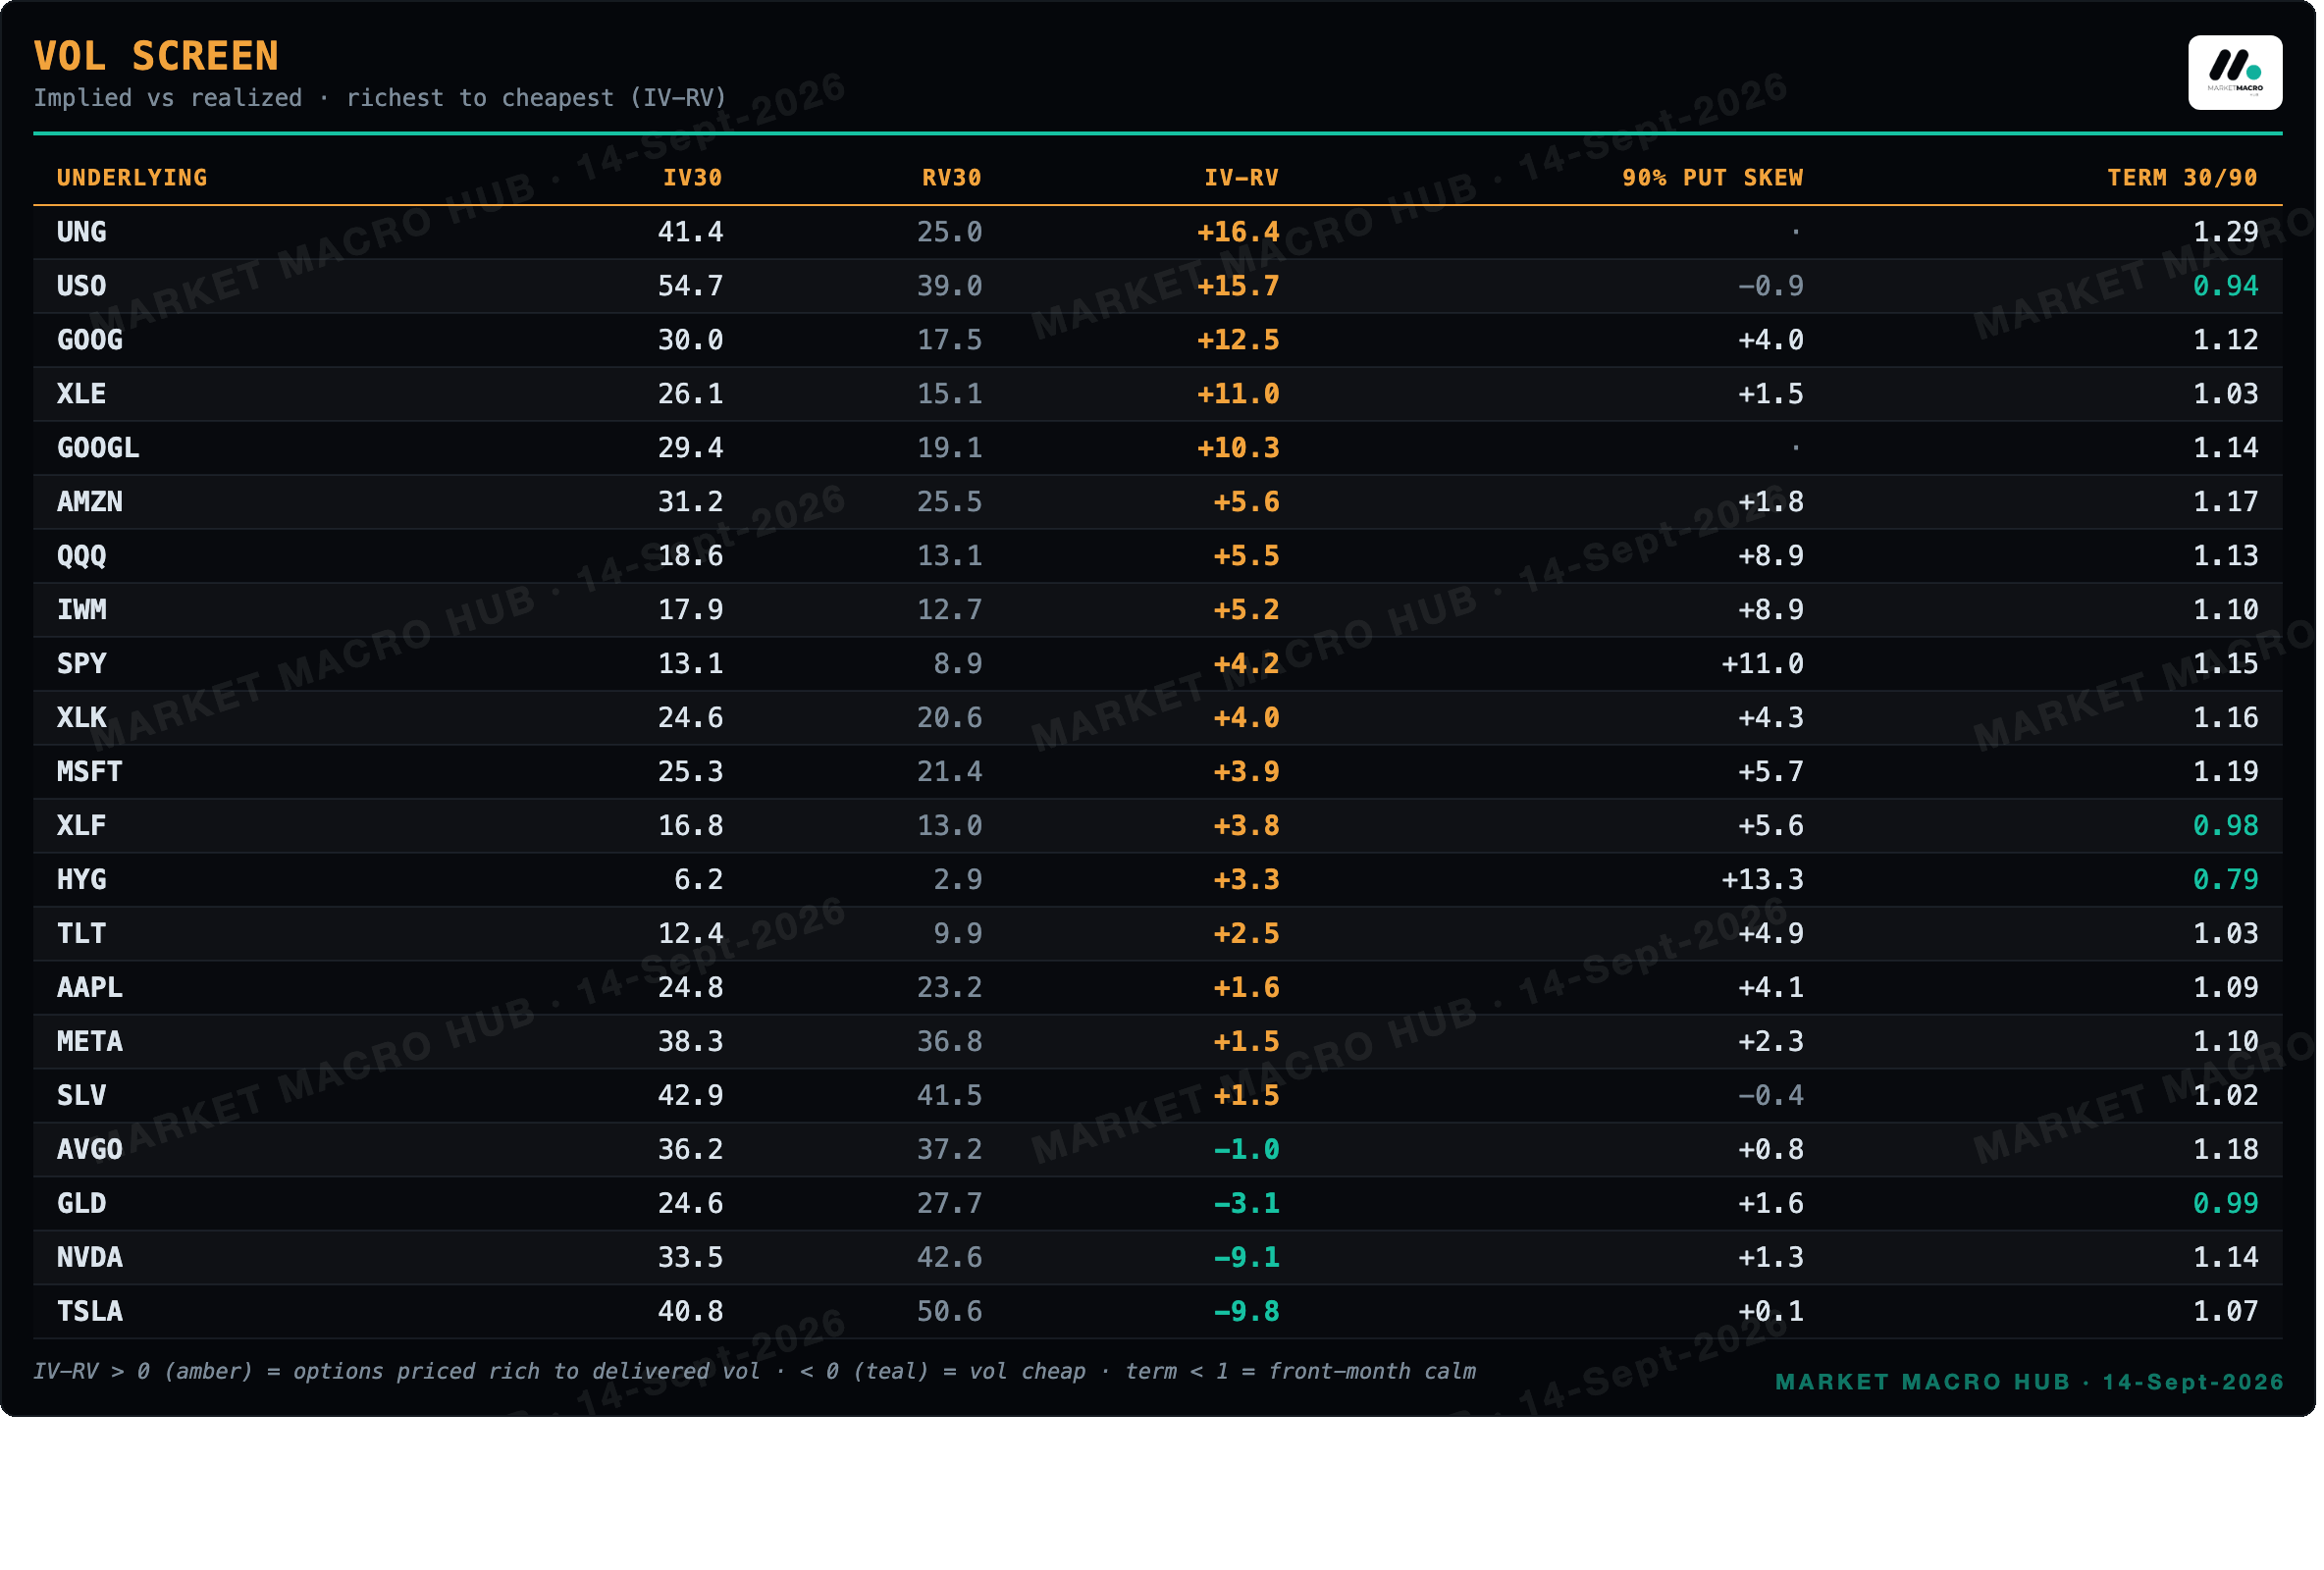
Positive IV-RV = options priced rich to what the tape is delivering (UNG and USO richest today); negative = vol going cheap (TSLA and NVDA). Percentile ranks unlock at 60 archived sessions per name · currently 54/60 · the archive deepens automatically every build.
The Measured Books · Monday Edges
Five rules, each backtested on the desk's own data before it may speak; rules that failed the measurement are named as context, never traded.
E1 · Slow trend (12-1) · live on equities and crypto only (measured noise elsewhere): Semiconductors LONG · US Energy LONG · Russell 2000 LONG · FTSE 100 LONG · Nikkei 225 LONG · S&P 500 LONG · +9 more
E2 · FX carry · signal only when the policy differential is 1%+ wide: EUR/JPY LONG (+27.24%) · EUR/GBP LONG (+24.51%) · EUR/USD LONG (+24.49%) · USD/CHF LONG (+3.75%) · AUD/JPY LONG (+3.35%) · the edge concentrates in the JPY-funded crosses
E3 · Curve (2s10s momentum) · slope 39bp, -3bp over 63 sessions → 63d trend FLATTENER (shorter-horizon state can differ · see appendix) · short 2Y (ZT) / long 10Y (ZN), roughly 2: 1 DV01
E4 · Variance risk premium · POSITIVE, harvest is on (long SPX) · 62nd percentile of its own history
E5 · Net liquidity (WALCL-TGA-RRP) · $5.86tn, -40bn over 13 weeks → falling, a headwind
Disclaimer
The information in this publication is provided for informational and educational purposes only and is believed to be reliable, but its accuracy and completeness are not guaranteed. Nothing herein constitutes investment advice, an offer, or a solicitation to buy or sell any security, derivative, digital asset, or other financial instrument, nor a recommendation suited to any specific reader. All figures are drawn from the day's computed data set at the time of generation and may be delayed, revised, or superseded. Markets involve risk, including the possible loss of principal; past performance and historical relationships do not guarantee future results. Readers should conduct their own research and consult a qualified financial adviser before making any investment decision. The author may hold positions in instruments discussed. This publication is licensed for the personal use of the subscriber only: redistribution, reproduction, or resale in any form is prohibited. © 2026 MARKET MACRO HUB. All rights reserved.