



Today's Tear Sheets
The full daily pack is attached below · six PDFs generated from the same computed data set as this note:
Macro Regime · curve regimes, growth x inflation quadrant, breadth, credit, vol term structure, liquidity, stock-bond correlation, crypto cross-asset, housing
Fixed Income · UST complex, global curves, Fed/ECB/BoE/BoJ implied policy paths, global 2Y and 10Y panels
Equities · index pages, relatives, vol suite, global relatives, Mag7+ quant sheet, options surfaces
FX · majors dashboards, correlations, COT positioning, crosses
Commodities · energy, metals, agriculture, COT crowding, term structure
Crypto · BTC ladders, ETH, macro correlations, ETF flow proxy

TL;DR
Long the near-certain hike story, which already landed; September is fully priced and no cut sits anywhere on the strip.
Doubting the full SEP tail; 2s10s at 33bp is my tell, and steepening from here changes my read.
Off copper despite the 3.45% rip, because specs are at the 100th percentile and that book is a fire risk.
IG carry anchors me at 80bp, invalidation 90bp; credit isn't corroborating any equity anxiety.
Watching the dollar for gold hedges now that the inverse link has tightened to -0.67.
Where We Stand
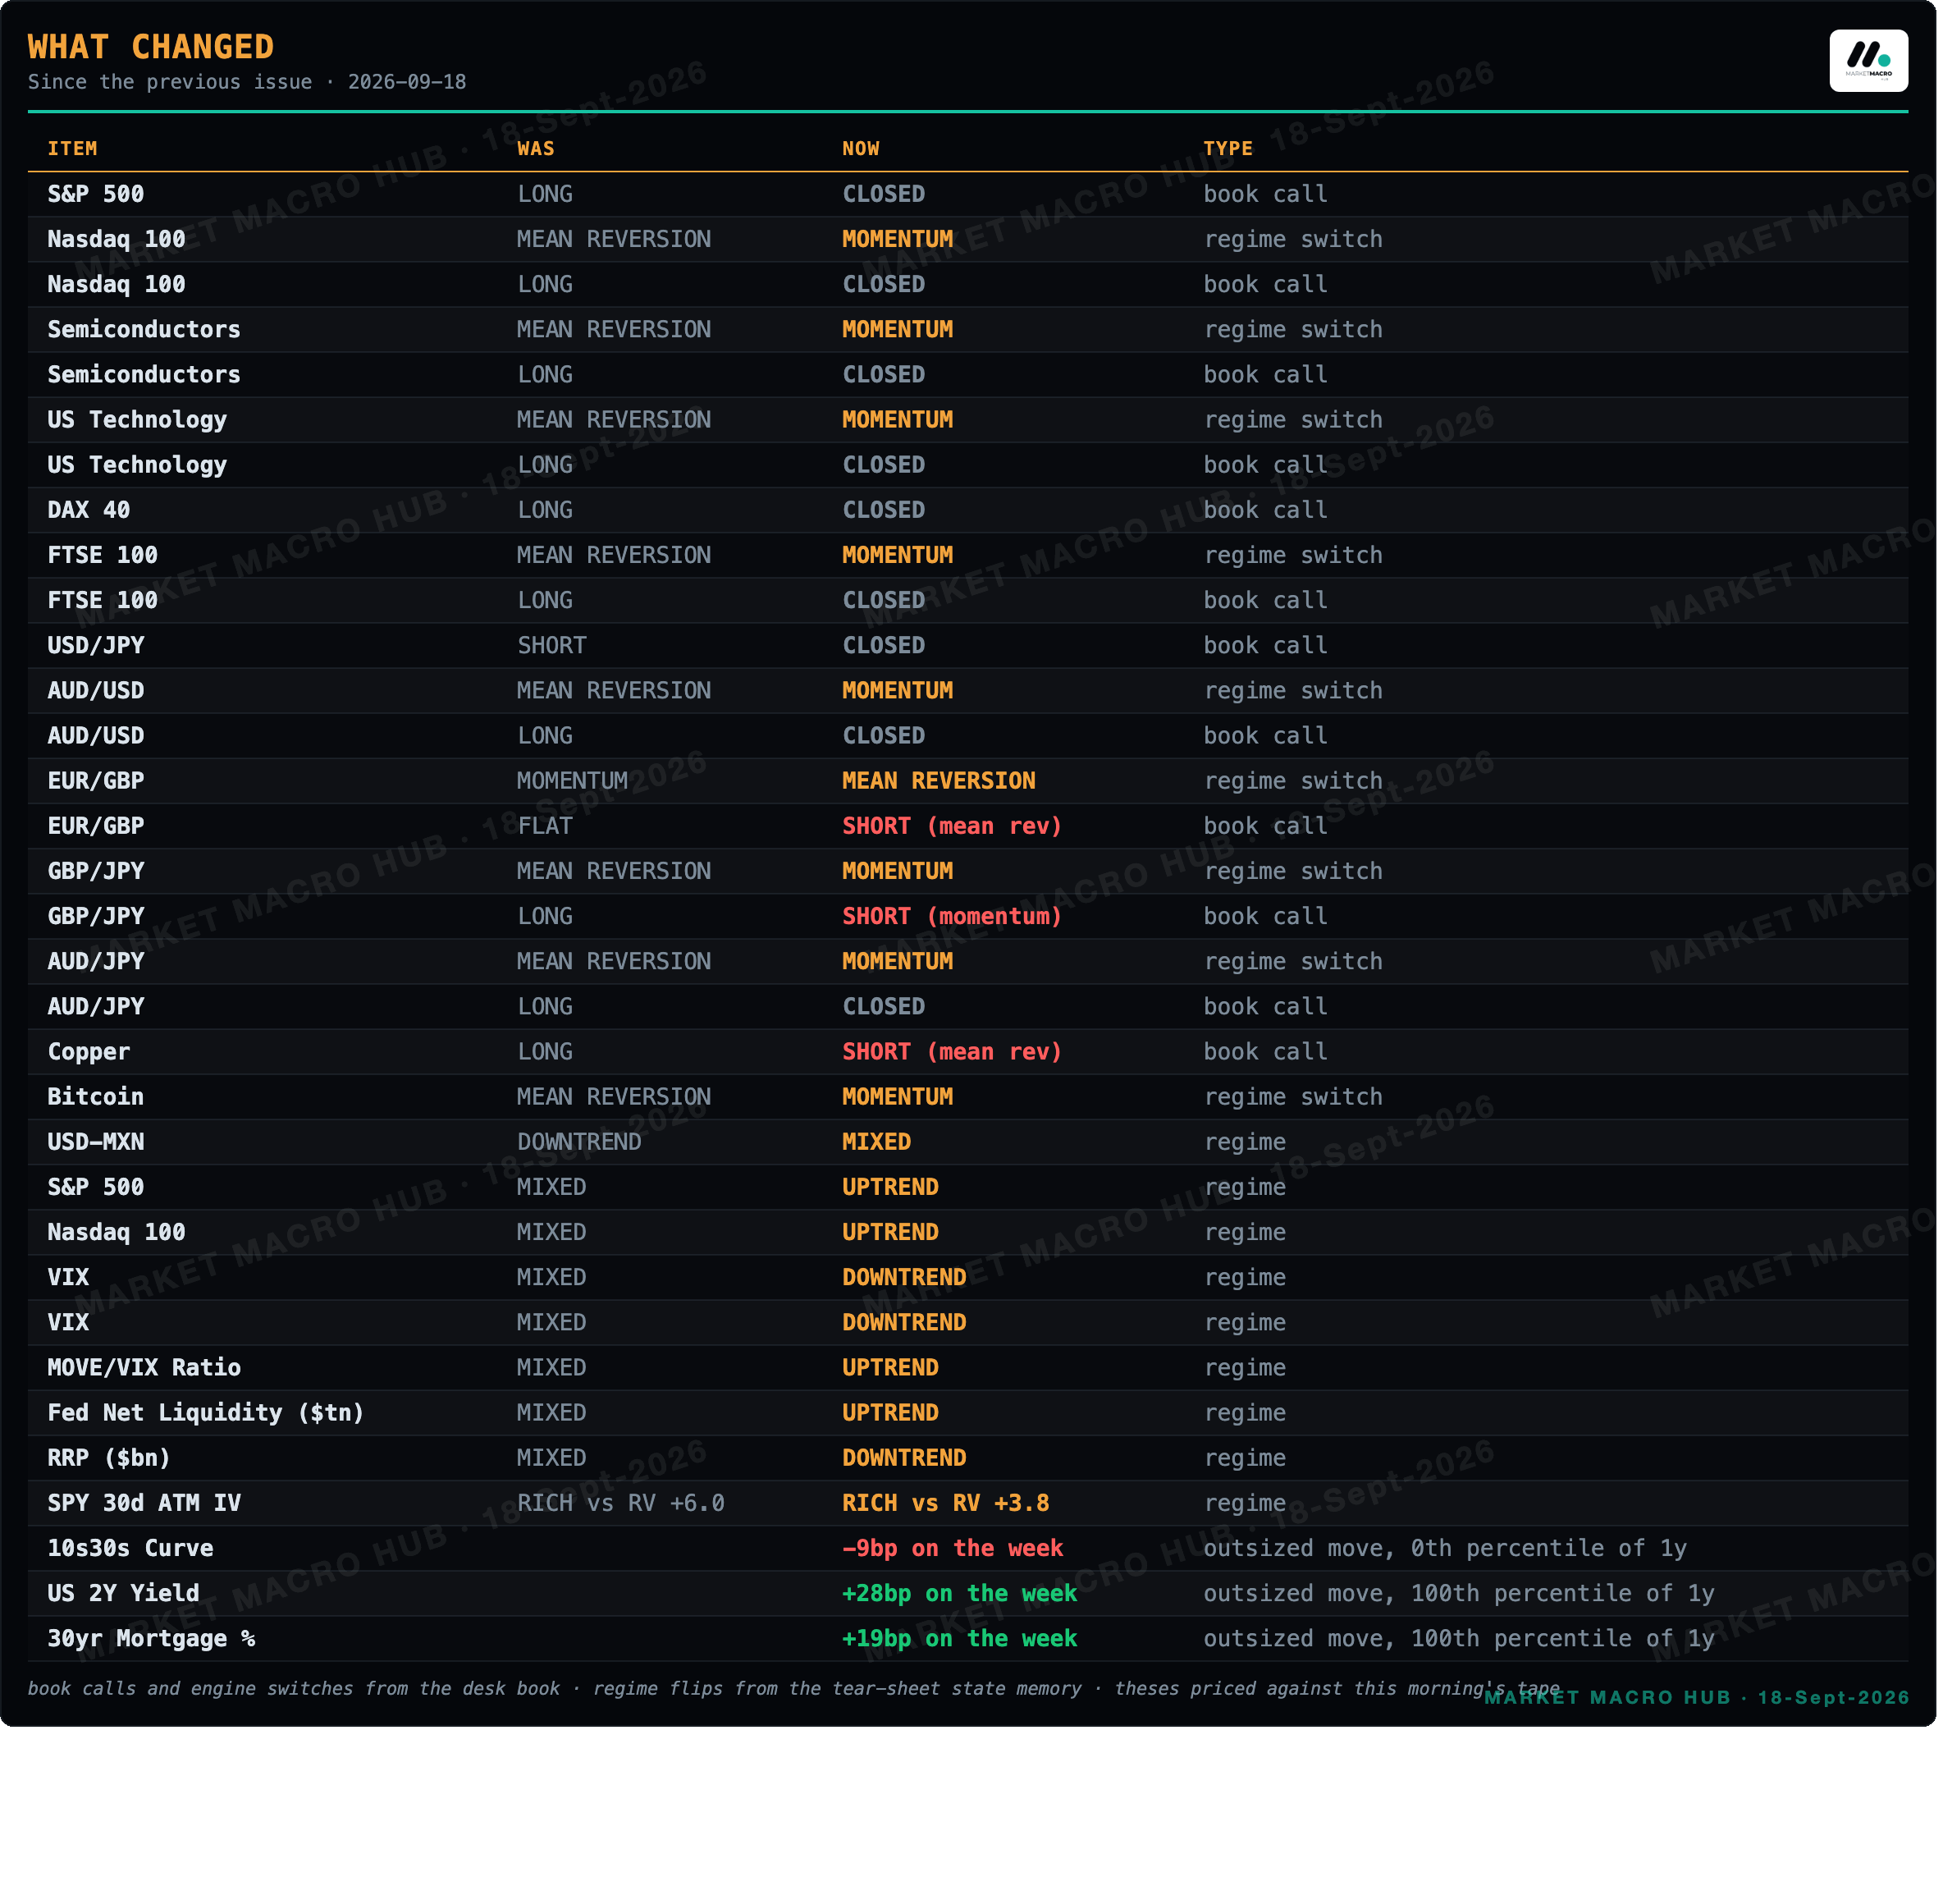
Yesterday I said I was long the near-certain hike story while doubting the full SEP path gets realised, and this morning's tape does nothing to change that. The hike landed at 4% in line, and the strip still prices no cut anywhere, so the near-certain leg is intact. My oldest open thesis, the 2s10s flattening call from three days ago, is holding by a thread: the curve sits at 33bp with a 1bp move on the day, so the flattening has stalled rather than reversed. I'm keeping the thesis alive because the 5d still shows -8bp, but if the curve steepens from here I'll change my read. The copper crowding flag is still live, and after today's rip it matters even more.
What Changed
Asset Market Pricing
Sector Attribution
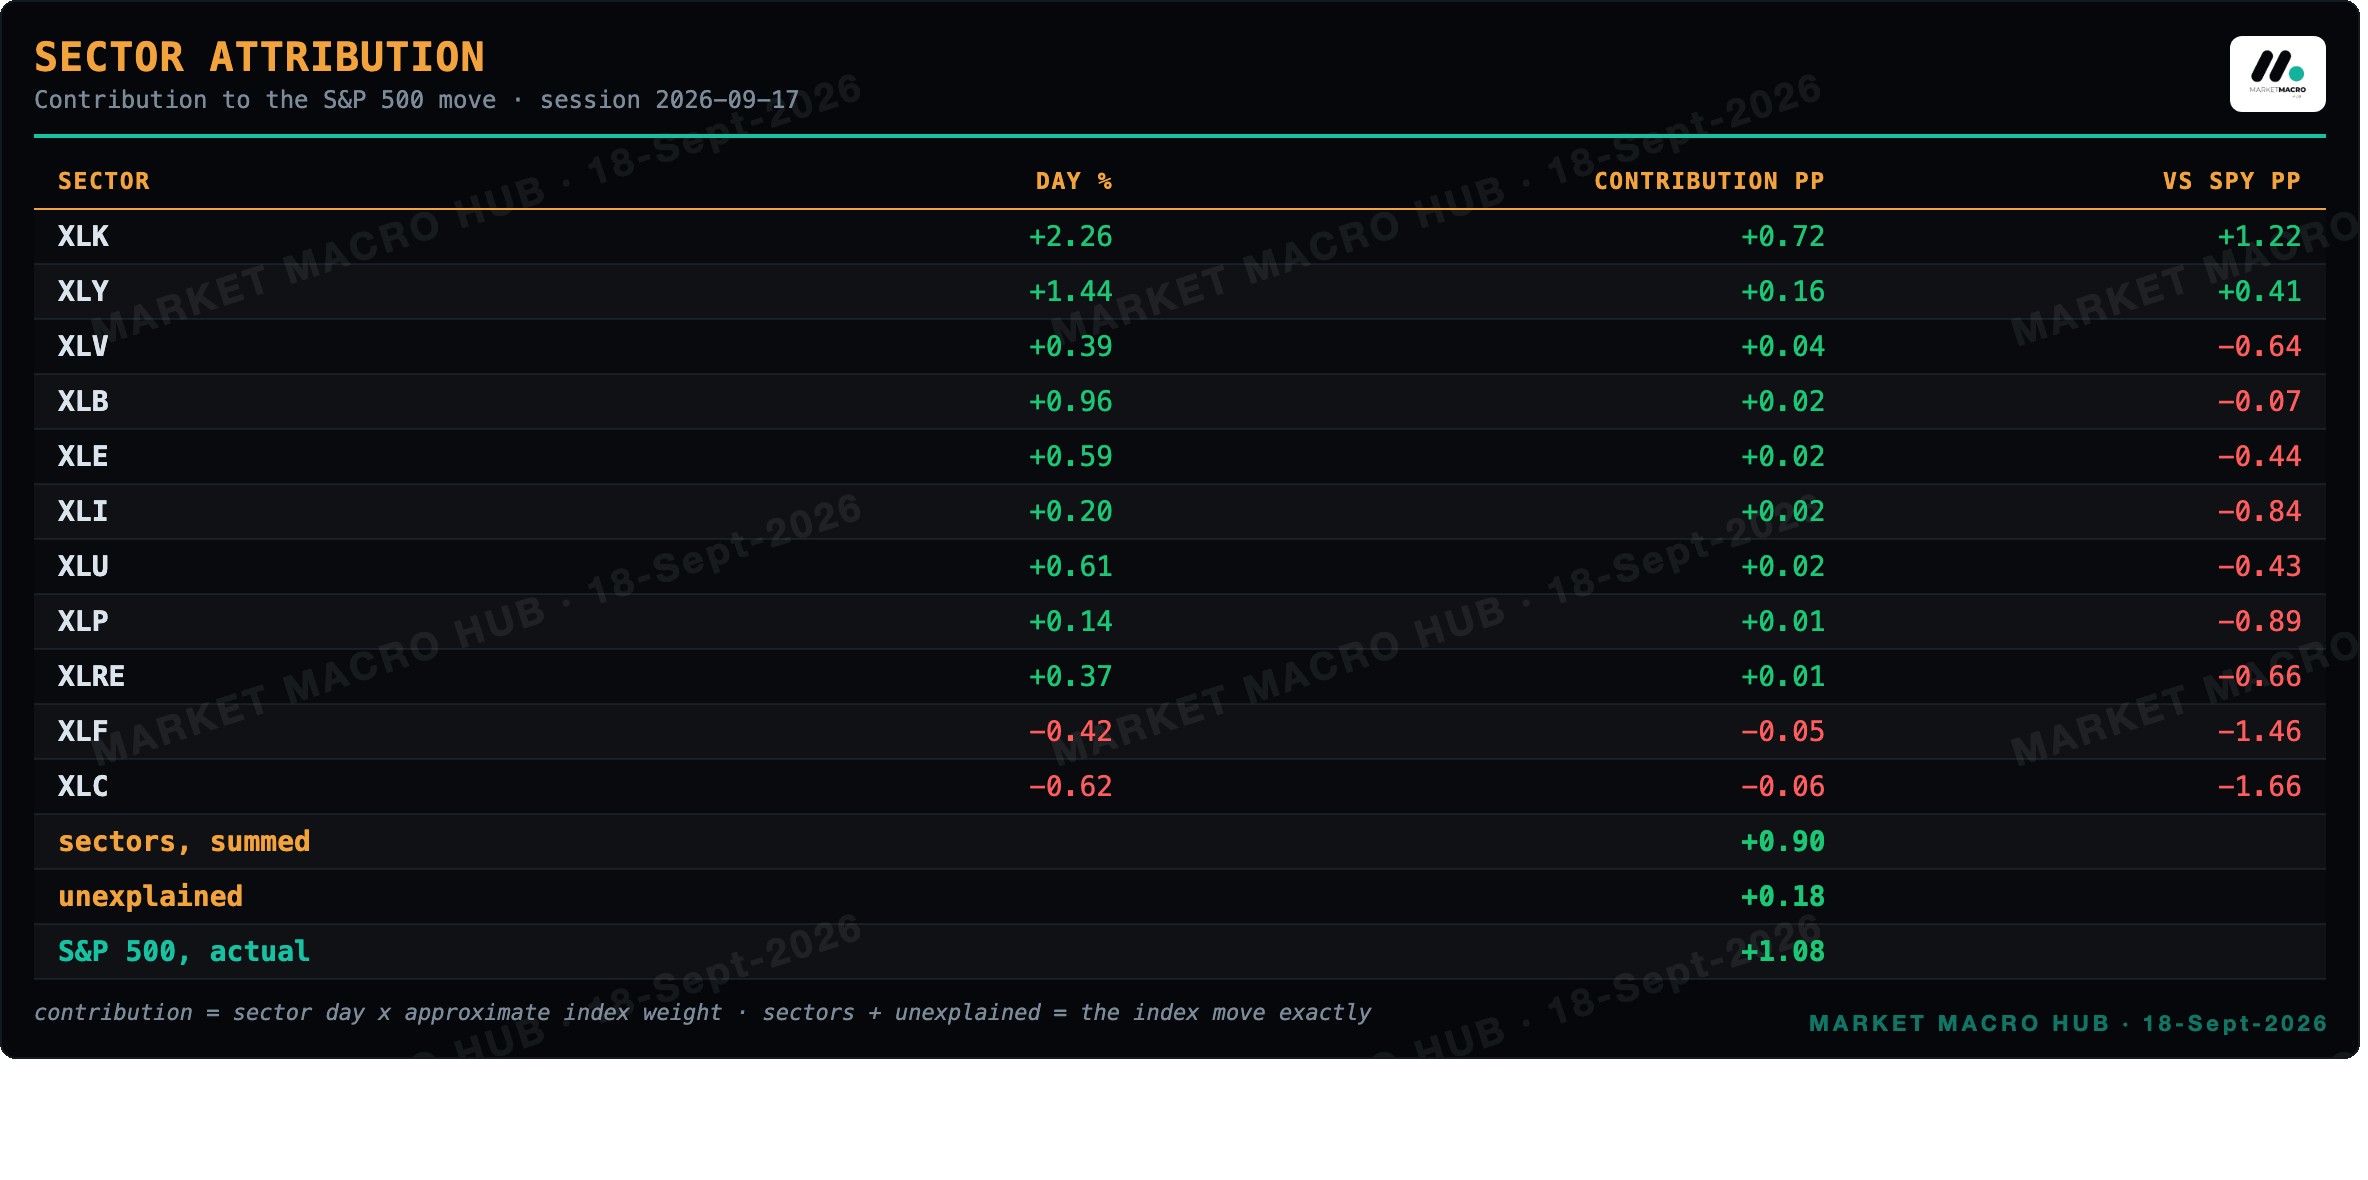
Session 2026-09-17. Sectors plus the unexplained remainder sum to the index move, and the sector split accounts for 83% of it.
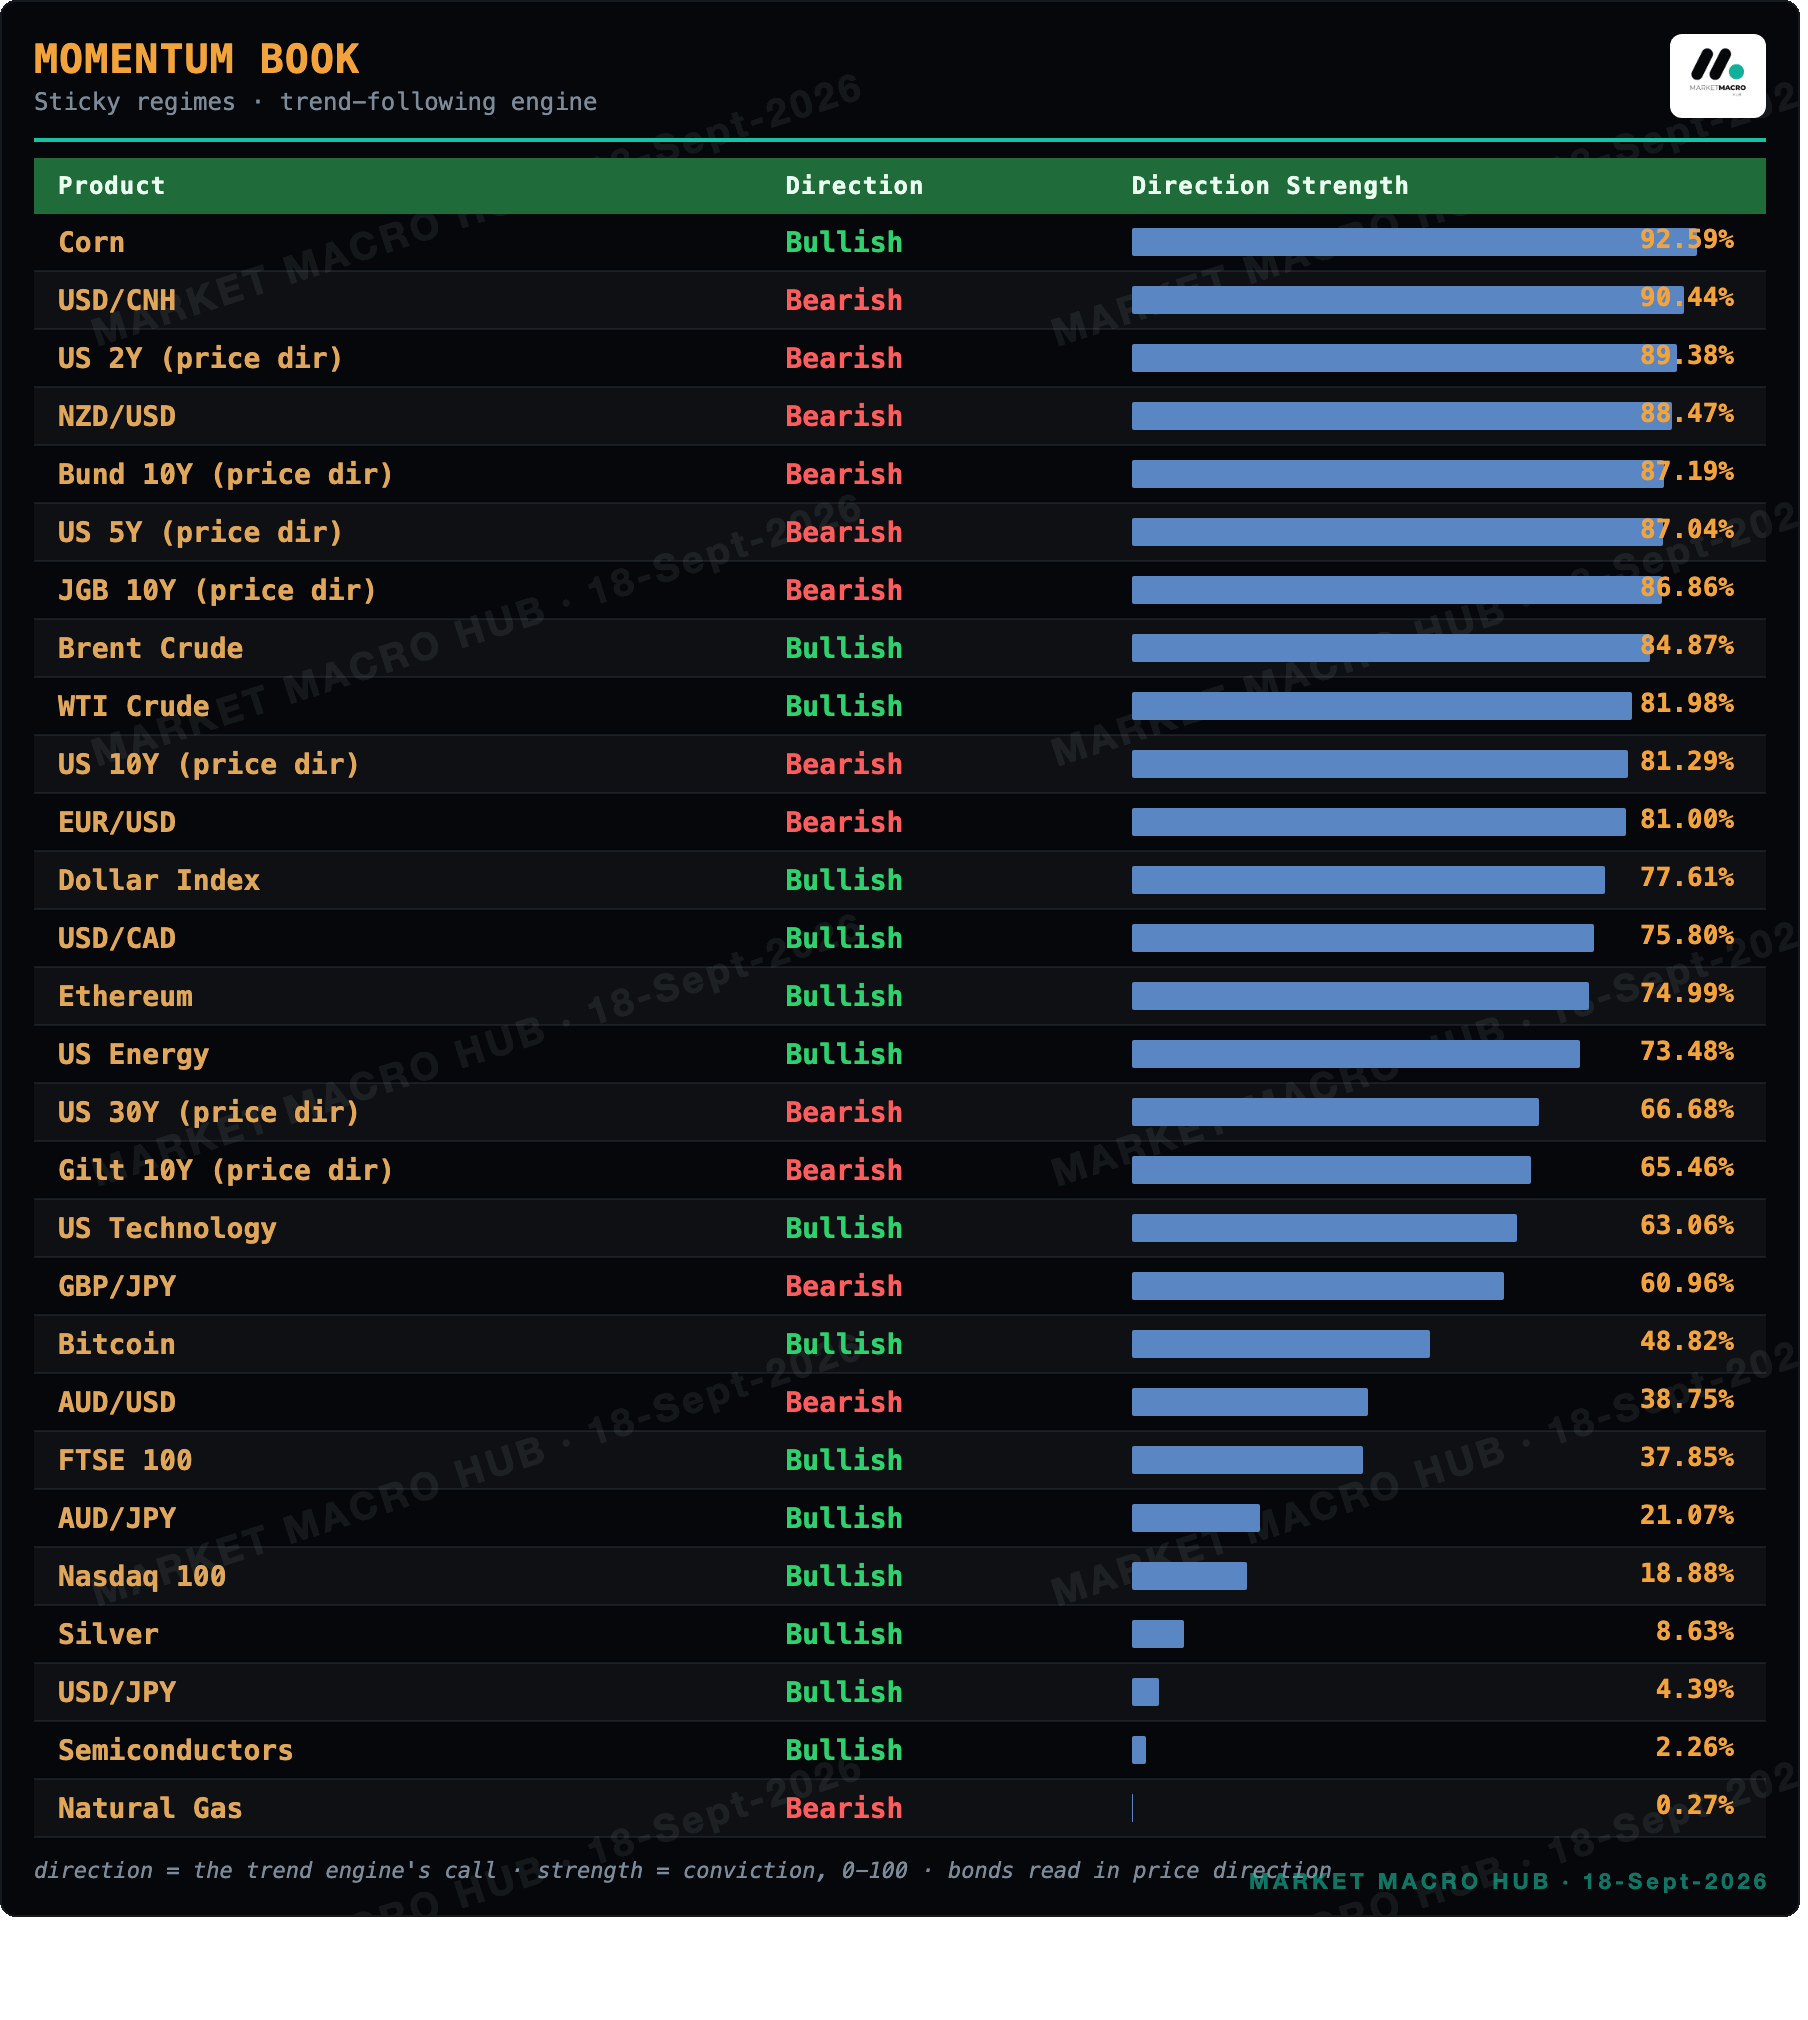
Momentum Book · Sticky Regimes
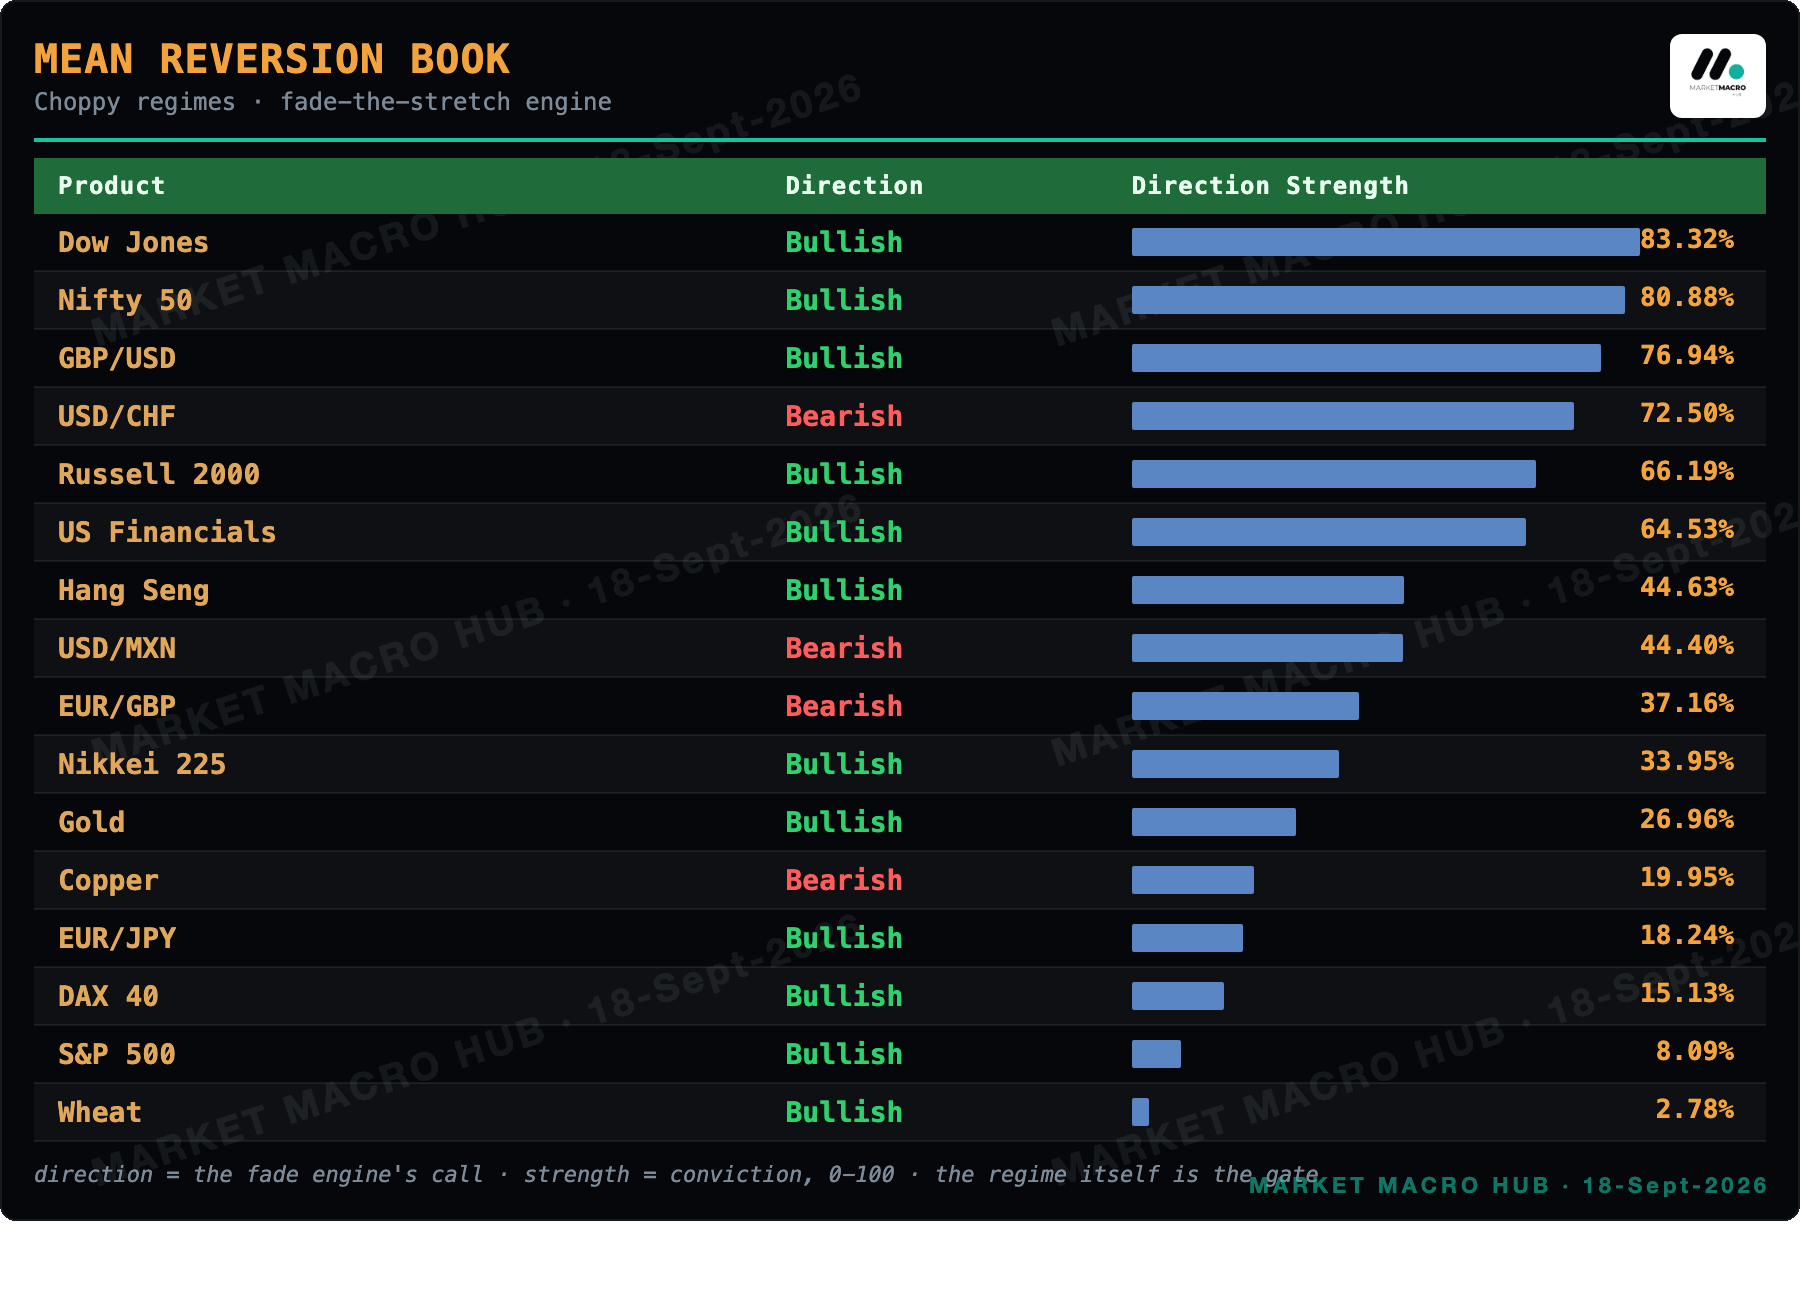
Mean Reversion Book · Choppy Regimes
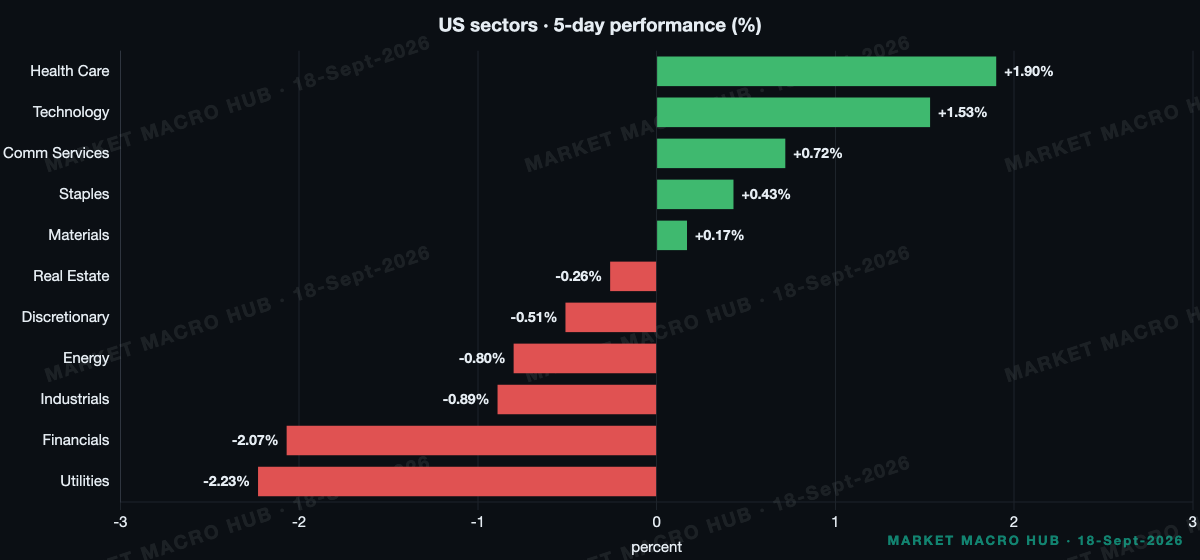
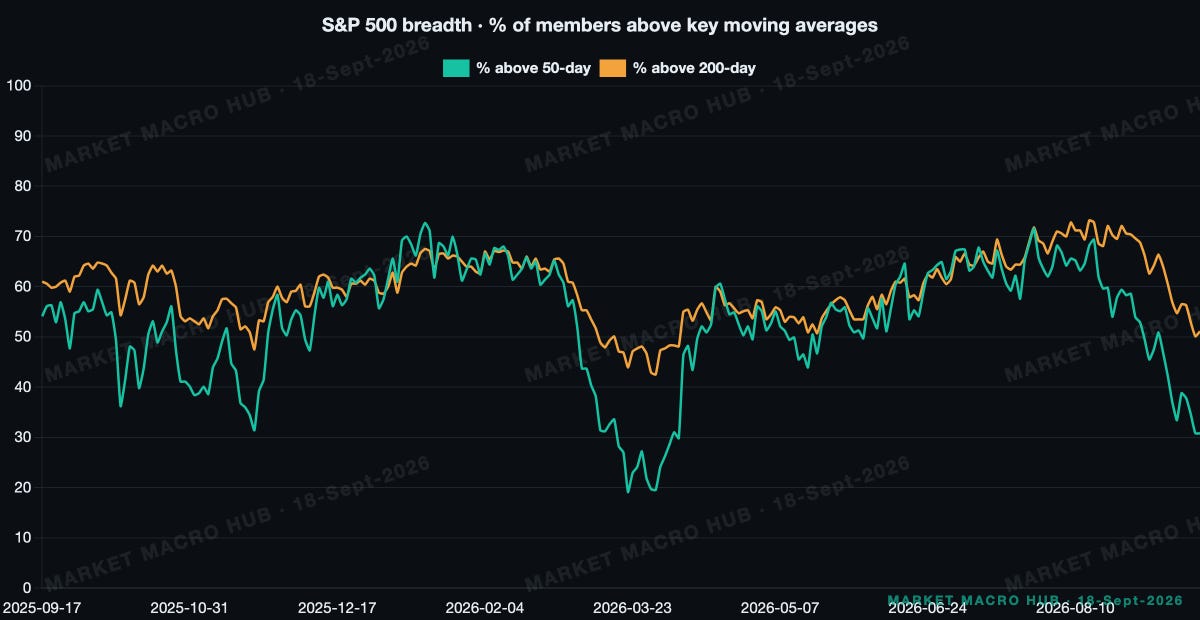
Sector Snapshot & Breadth
Main Developments in Macro
BOJ HIKES 25BP AS EXPECTED, 7-2 VOTE, ASADA AND SATO DISSENT; JAPAN CPI SOFTER ACROSS ALL METRICS
NIKKEI +1.8% AS APAC TRACKS WALL STREET FED-CREDIBILITY BID; USD/JPY +0.8% TO 157.19
TRUMP TELLS AXIOS IRAN AT "CRITICAL JUNCTURE", WEIGHING NEW ATTACKS; FORCES HELD IN MIDDLE EAST TO YEAR-END
US EXPECTED TO DELAY EXCESS-CAPACITY TARIFFS UNTIL AFTER TRUMP-XI SUMMIT; CNH AT FOUR-YEAR HIGH
BOE PAUSES APF GILT SALES UNTIL APRIL 2027, WON'T SELL LONG-DATED GILTS
MOODY'S SET TO UPGRADE GERMANY; QUAD WITCHING AND US INDUSTRIAL PRODUCTION DUE
The growth read is mixed and the inflation read is what's driving rates. Philadelphia Fed Manufacturing came in at 37.8 against a 30.5 consensus, and initial jobless claims printed 196 versus 208 expected, both firmer than the street looked for. Housing was the soft spot, with housing starts at 1.275 below the 1.31 consensus and building permits at 1.394 below 1.41. Labour and factory strength alongside a hiking Fed keeps the front-end story honest.
Cross-Asset Read
Technology did the heavy lifting yesterday. XLK rose 2.26% on the day for a +0.72pp contribution, comfortably the largest, with discretionary a distant second and communications the only real drag. The residual is real, so the sectors don't sum to the index, but the leadership is clear enough.
The move I care about most is copper. It surged 3.45% on the day, and with specs already at the 100th percentile of their own history that's a crowded book getting more crowded. I stay off the long side.
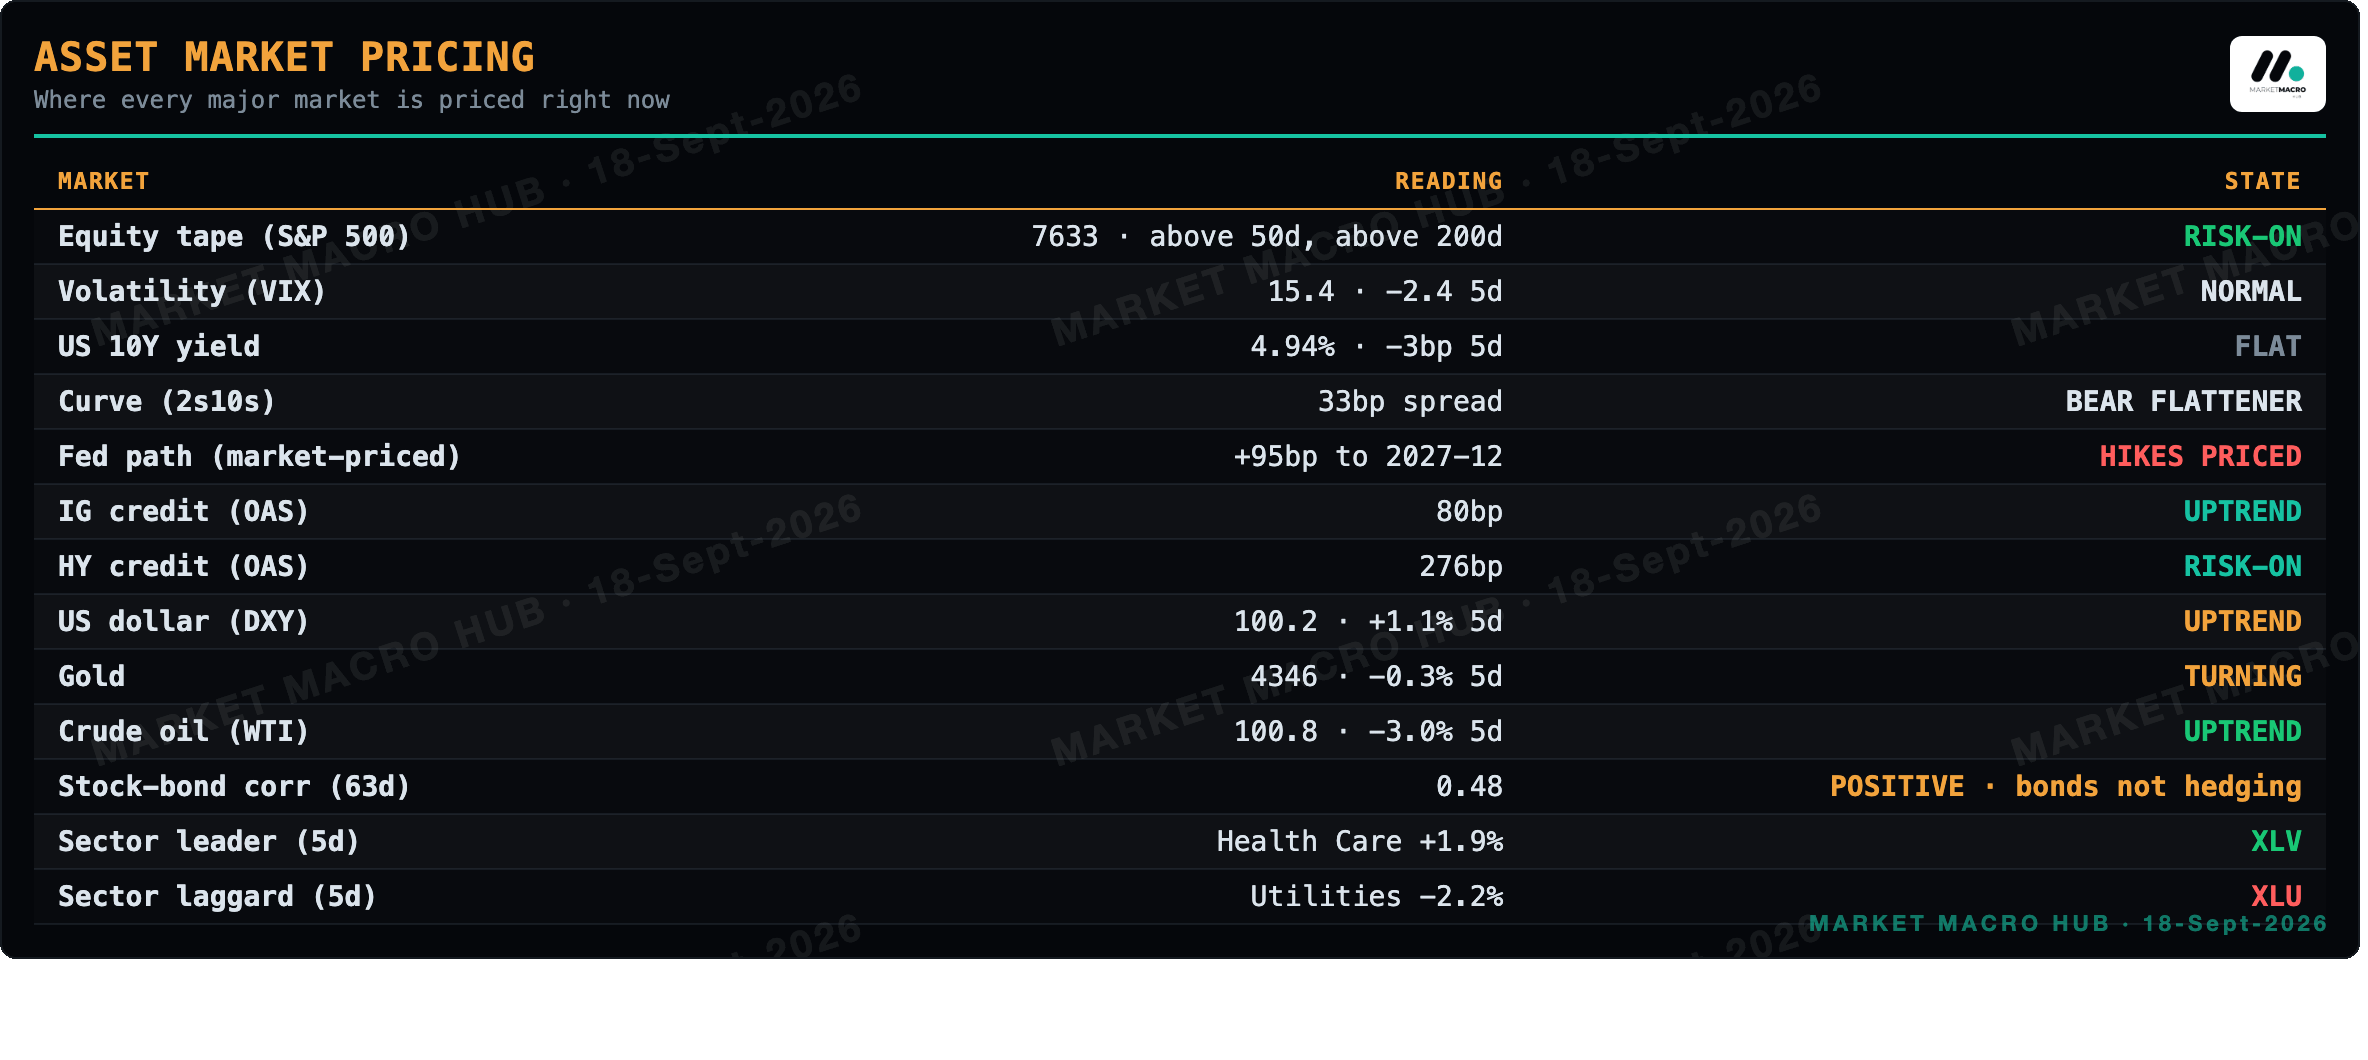
Gold's link to the dollar is the correlation shift that changes a hedge. Gold versus DXY has moved to -0.67 now from -0.39 a month ago, a much tighter inverse than I carried yesterday, so the dollar does more of the work in any gold hedge now. Credit is quiet and corroborates nothing: IG OAS sits at 80bp at the tight end of its range, unchanged on the day, and HY at 276bp says risk appetite at the low-quality end is intact. My IG anchor holds, invalidation still 90bp.
Rates & Fed Pricing
No month on the strip has a cut half-priced, so the debate is entirely about how much more tightening the market believes. September is fully priced for a 25bp hike at essentially 100% odds, and that's already delivered. Beyond that the strip builds slowly: peak sits at 4.68% in November 2027, which is +105bp cumulative over EFFR. The terminal repriced +35bp on the week even after slipping 7.5bp today, so the weekly direction points to more tightening. The 2Y jumped +28bp on the week to sit at the top of its one-year range, and the 5Y +25bp alongside it.
What changes my mind is the curve. If 2s10s steepens from 33bp back through the week's flattening, the market is telling me it believes the full path, and I'd have to drop my scepticism on the SEP tail.
The Week Ahead
Friday: US Industrial Production (cons 0.3%); a soft print alongside weak housing would start to bend my growth read, a firm one keeps the front end honest. Quad witching adds noise, so I fade nothing on today's close alone.
Friday: Fed Bowman speaks, first read post-blackout on how committed the hiking bias really is.
Monday: Fed Goolsbee and the Chicago Fed National Activity Index; more Fed colour matters more than the data here.
Tuesday: Fed Williams and Jefferson, plus weekly ADP; the speaker slate is where the SEP-path debate gets tested.
Wednesday: S&P Global Services PMI Flash (prev 56.5) and the MBA mortgage rate after a +19bp weekly jump; a hot services print would reinforce the tightening story.
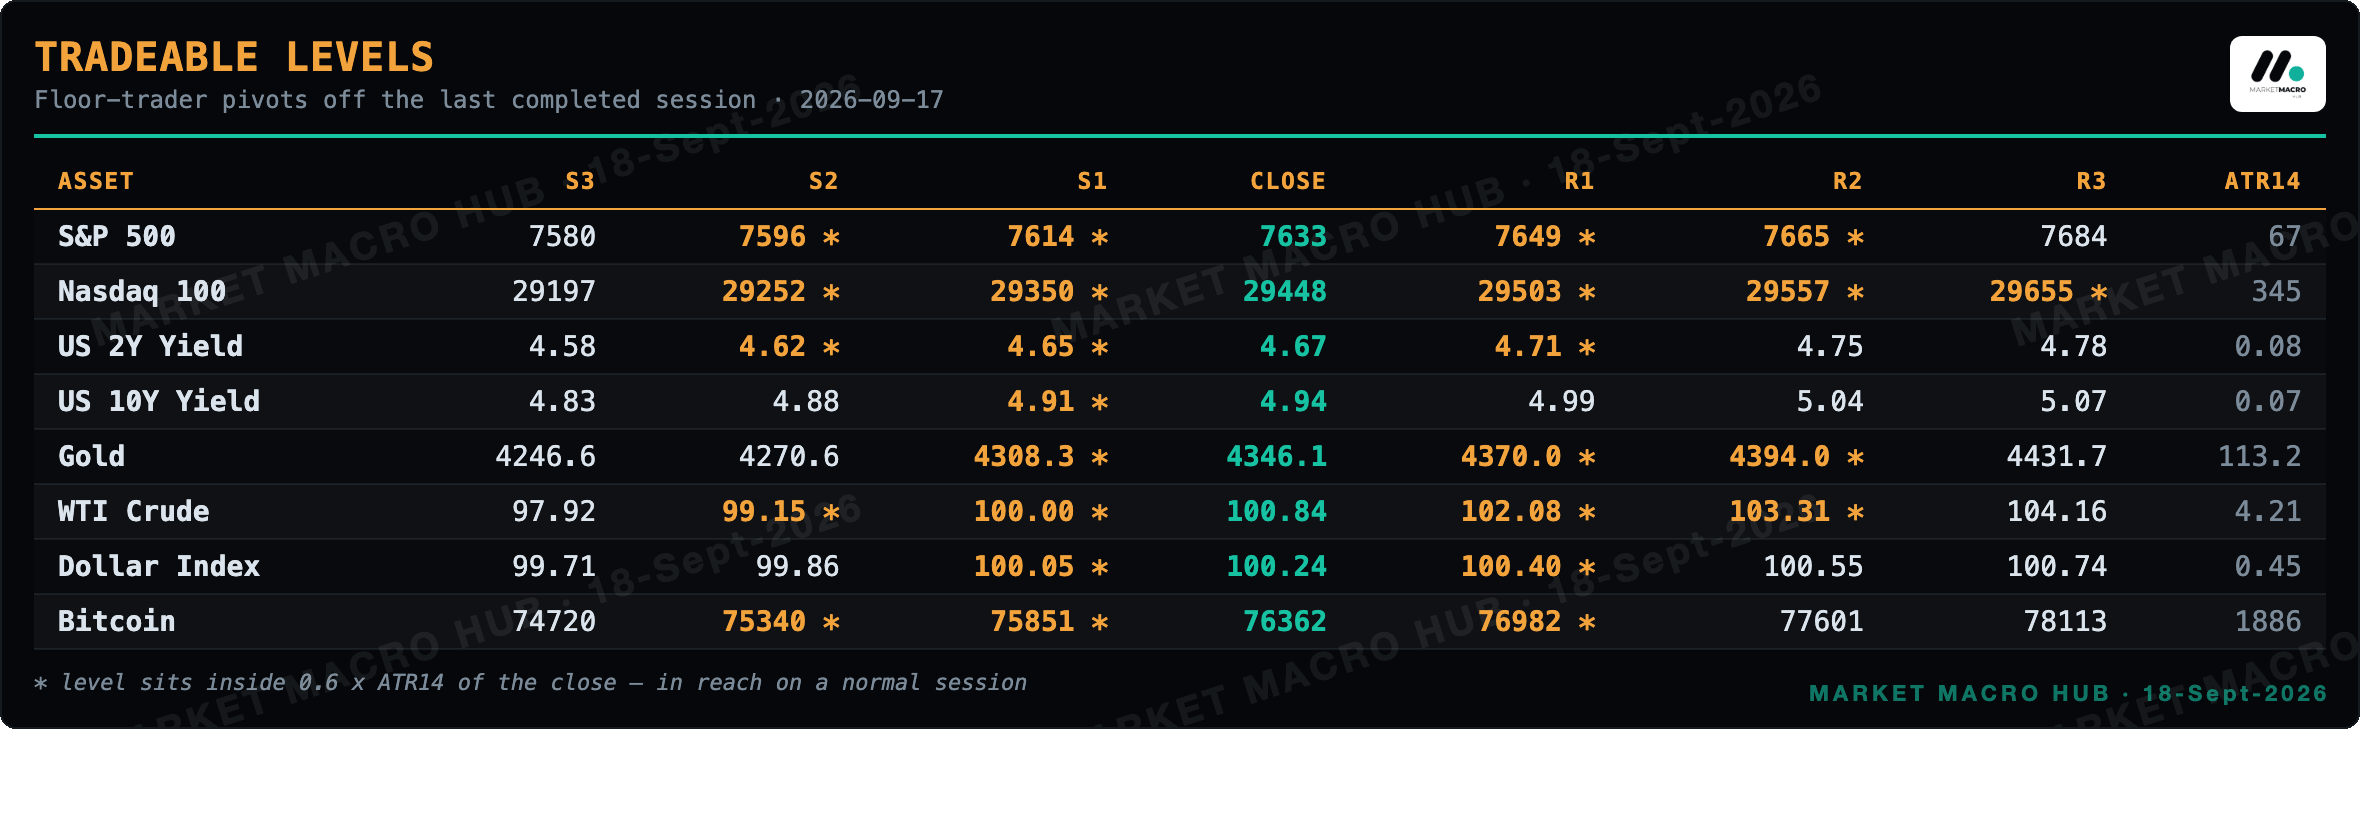
Tradeable Levels
Pivots off the last completed session (2026-09-17). Levels marked * sit within 0.6 x ATR14 of the close.
Vol Screen · Rich and Cheap Implied Vol
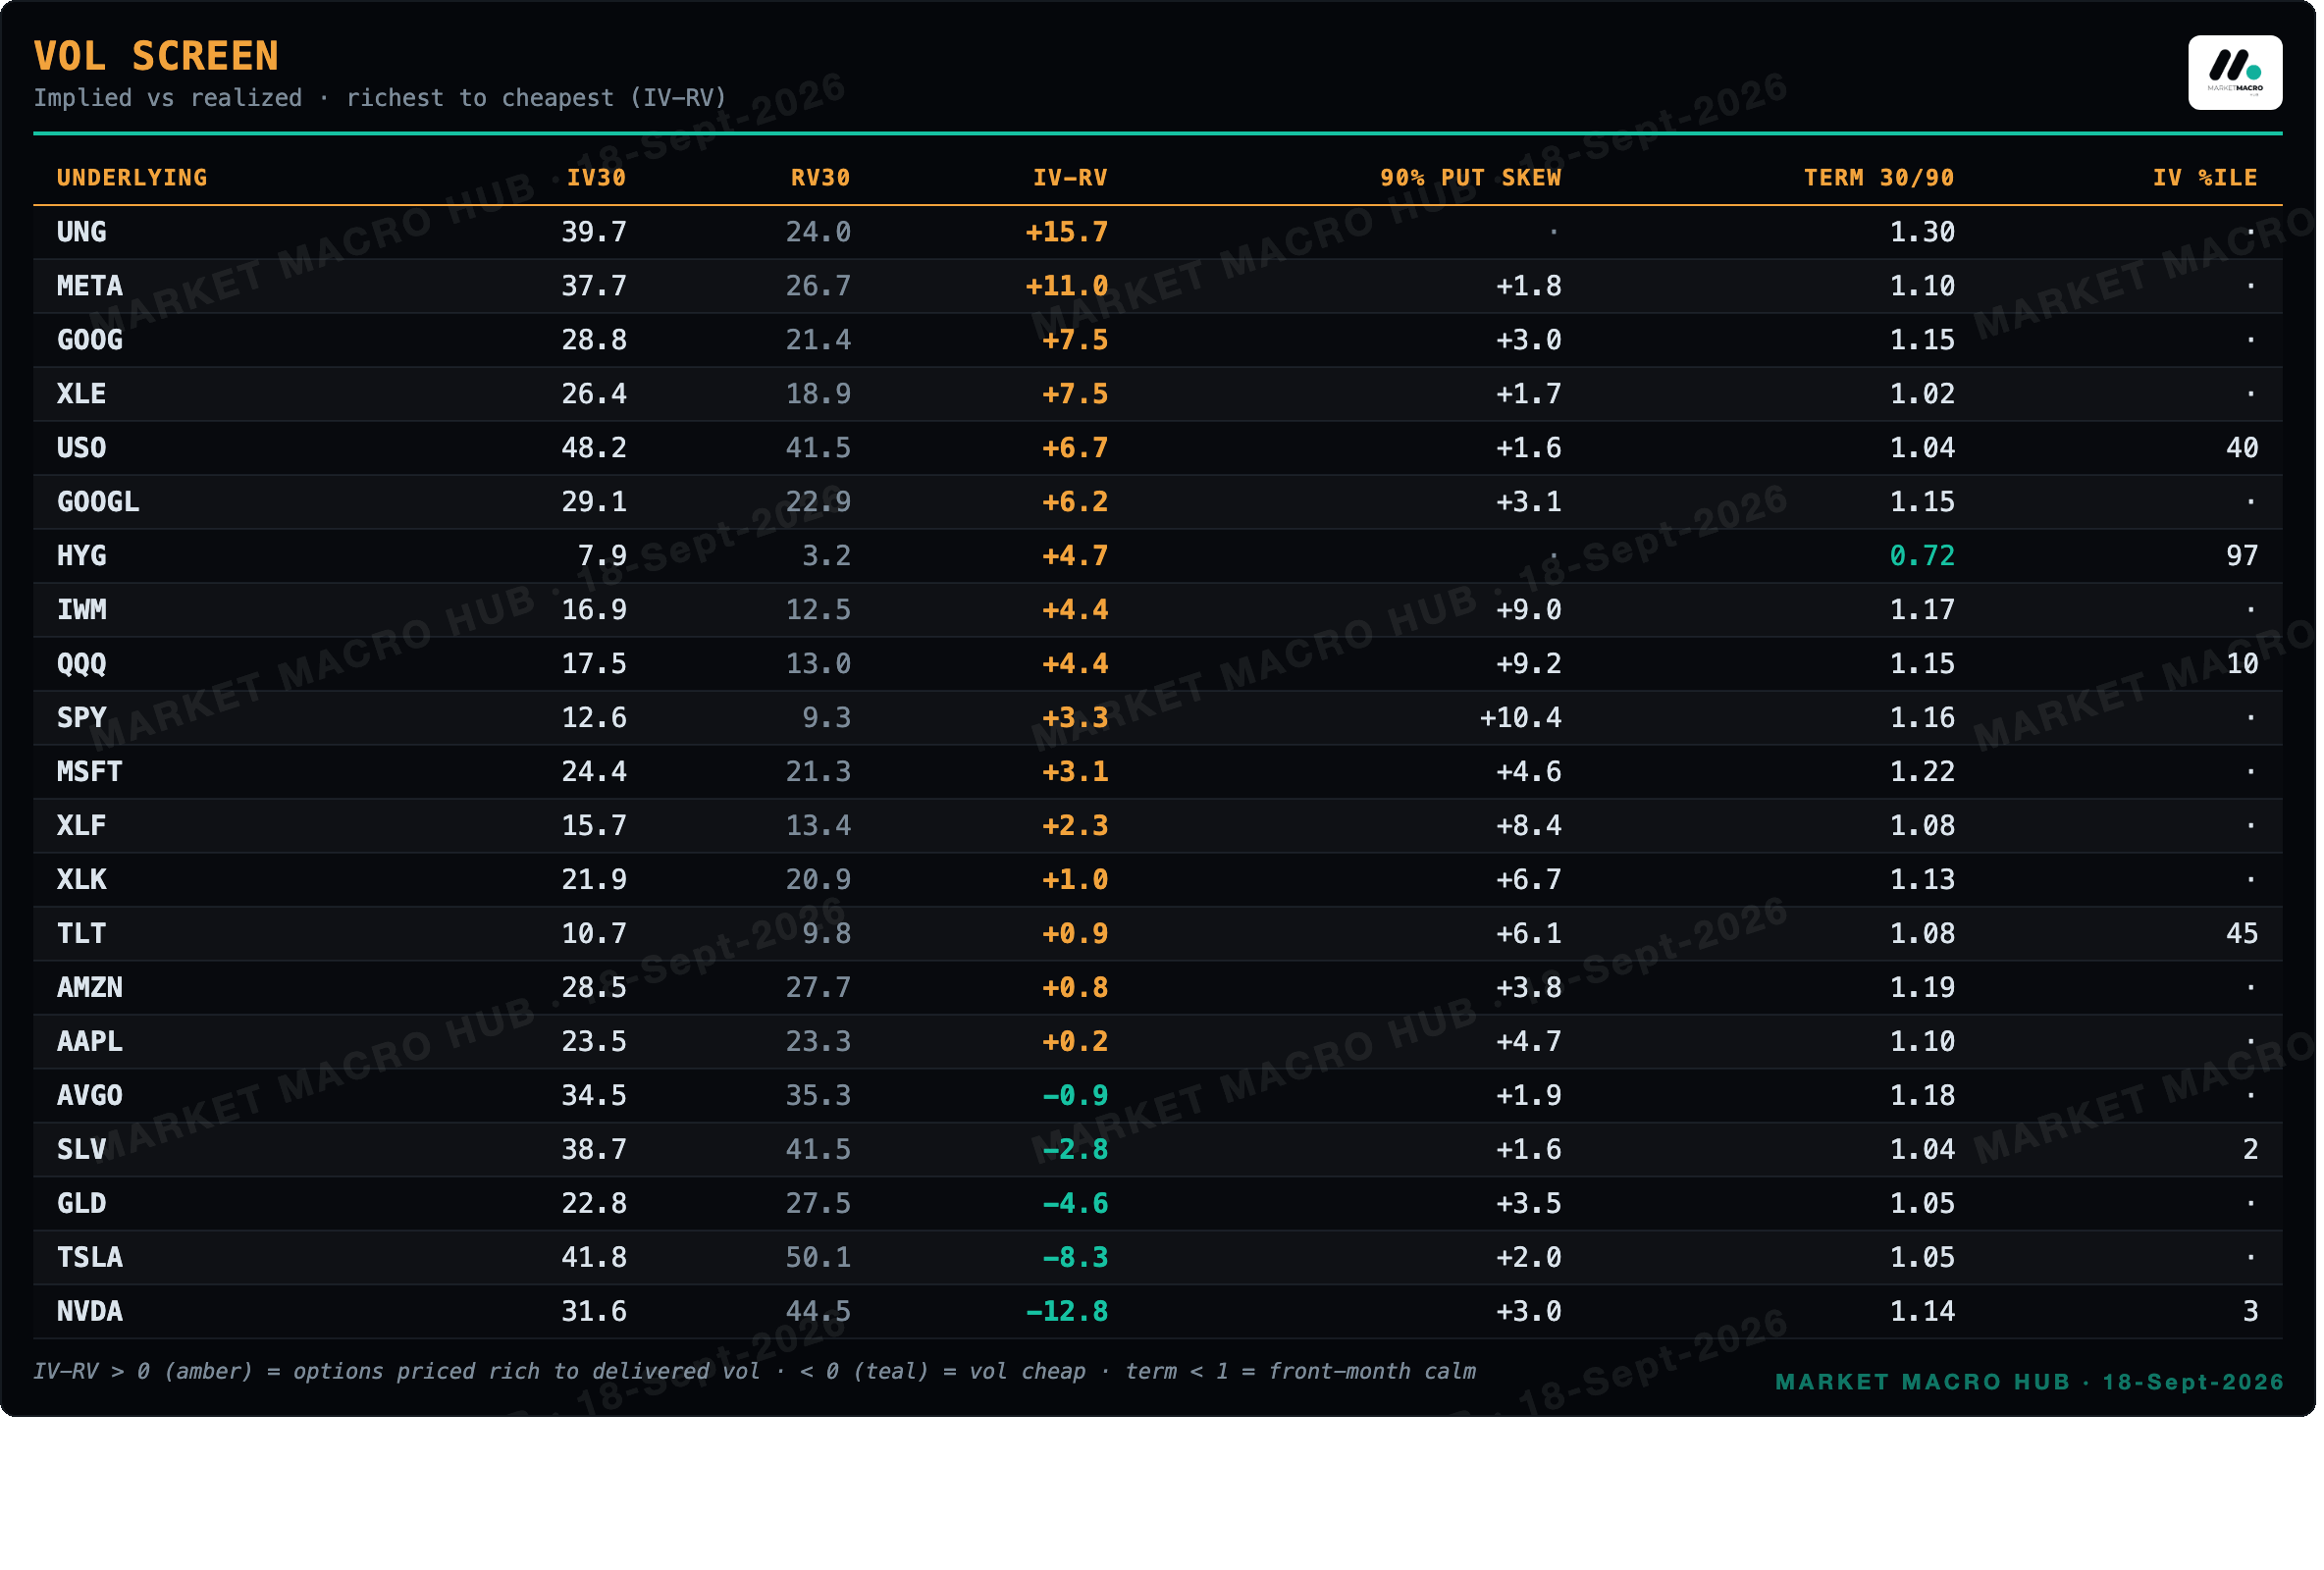
Positive IV-RV = options priced rich to what the tape is delivering (UNG and META richest today); negative = vol going cheap (NVDA and TSLA). Percentiles are each name's own archive history.
Positioning Book · Friday COT
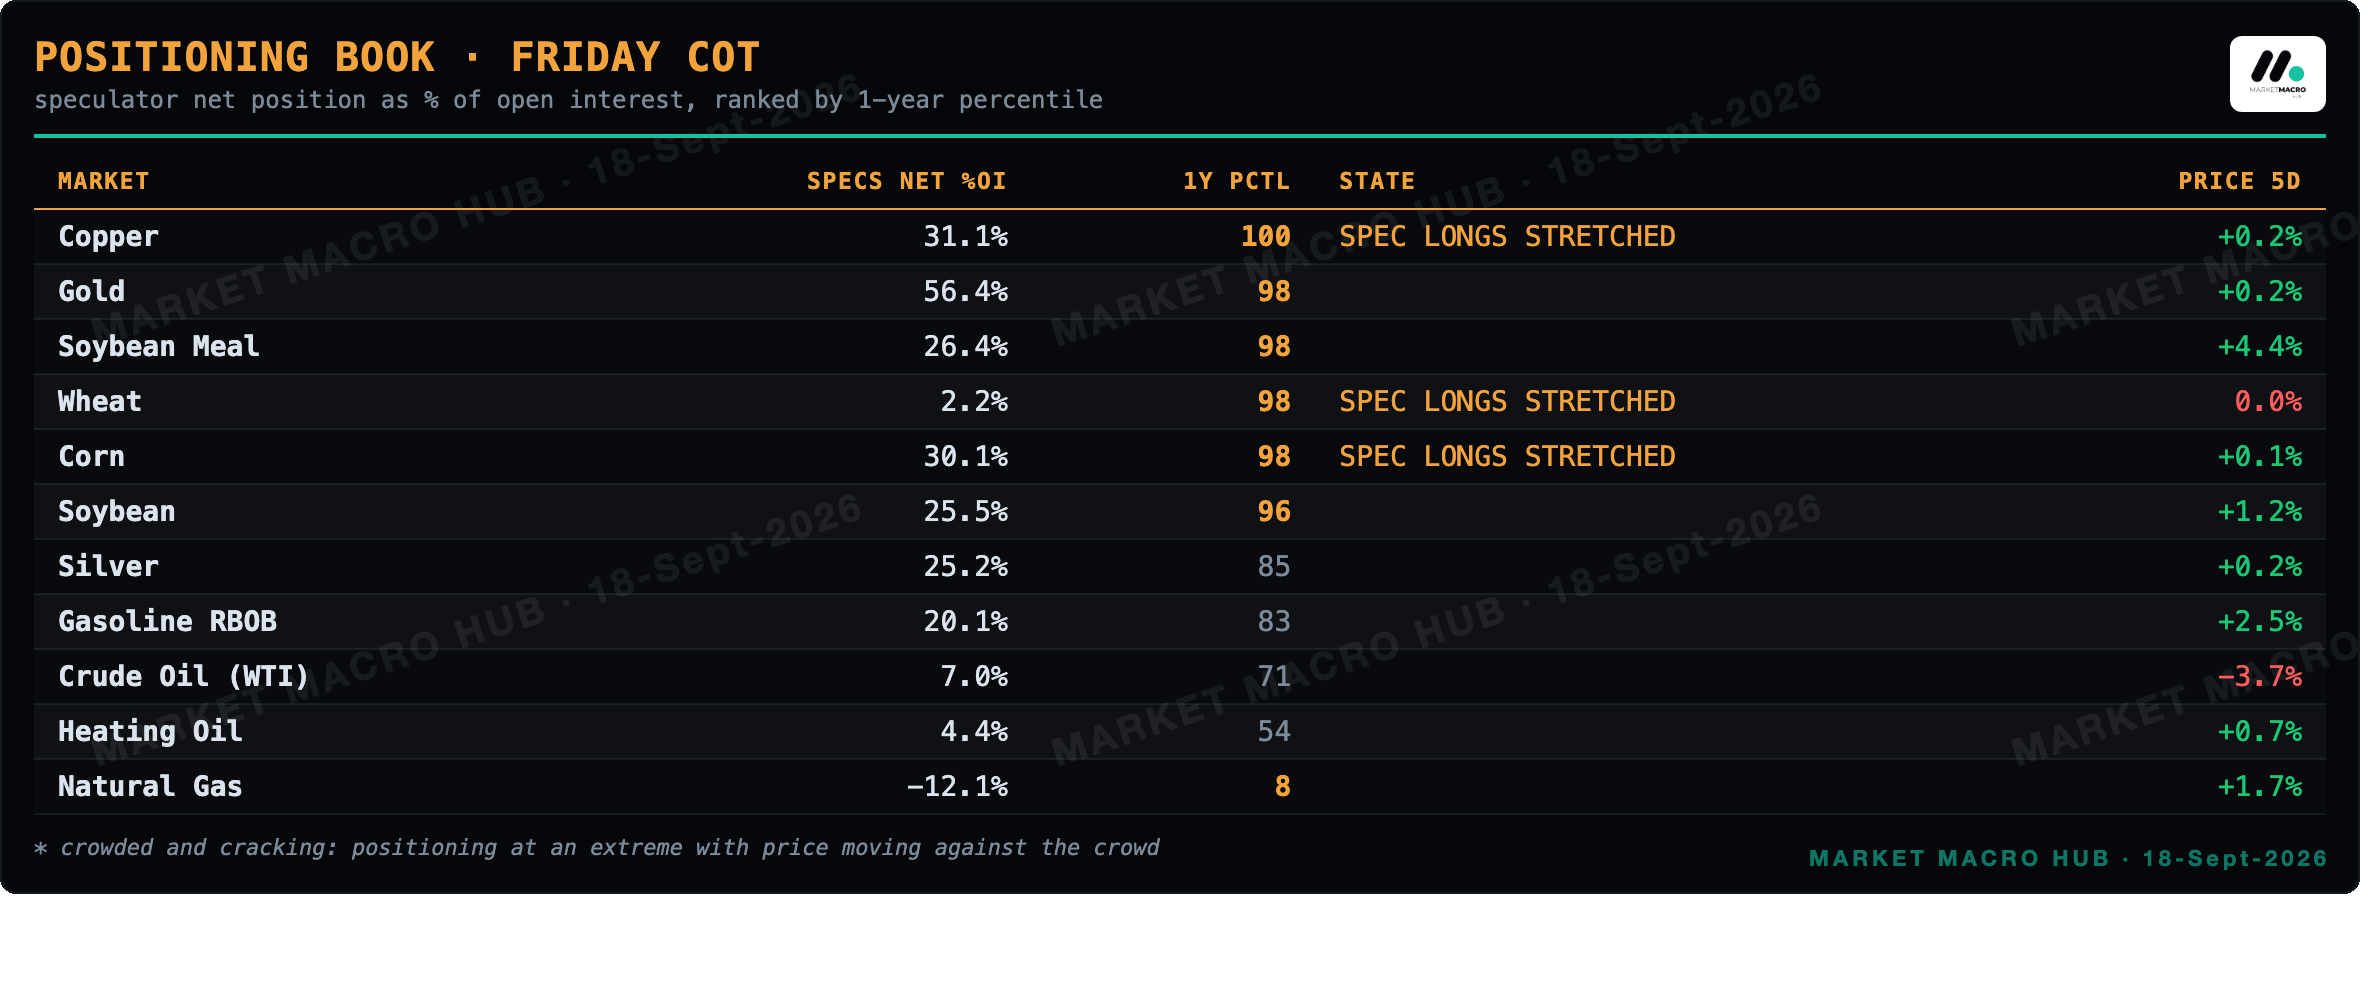
No crowded-and-cracking setups this week · extremes without a price crack are carry, not catalysts.
Disclaimer
The information in this publication is provided for informational and educational purposes only and is believed to be reliable, but its accuracy and completeness are not guaranteed. Nothing herein constitutes investment advice, an offer, or a solicitation to buy or sell any security, derivative, digital asset, or other financial instrument, nor a recommendation suited to any specific reader. All figures are drawn from the day's computed data set at the time of generation and may be delayed, revised, or superseded. Markets involve risk, including the possible loss of principal; past performance and historical relationships do not guarantee future results. Readers should conduct their own research and consult a qualified financial adviser before making any investment decision. The author may hold positions in instruments discussed. This publication is licensed for the personal use of the subscriber only: redistribution, reproduction, or resale in any form is prohibited. © 2026 MARKET MACRO HUB. All rights reserved.