



Today's Tear Sheets
The full daily pack is attached below · six PDFs generated from the same computed data set as this note:
Macro Regime · curve regimes, growth x inflation quadrant, breadth, credit, vol term structure, liquidity, stock-bond correlation, crypto cross-asset, housing
Fixed Income · UST complex, global curves, Fed/ECB/BoE/BoJ implied policy paths, global 2Y and 10Y panels
Equities · index pages, relatives, vol suite, global relatives, Mag7+ quant sheet, options surfaces
FX · majors dashboards, correlations, COT positioning, crosses
Commodities · energy, metals, agriculture, COT crowding, term structure
Crypto · BTC ladders, ETH, macro correlations, ETF flow proxy

TL;DR
Long IG carry at 80bp is my anchor into the Fed, invalidation still 90bp.
I'm not fading the 96% October hike, the risk is in the path beyond it.
The 2s10s at 32bp is my tell, more flattening confirms doubt on the back of the path.
Copper crowding at the 100th percentile keeps me off the long side.
Gold's deepened inverse link to the dollar, now -0.69, argues for smaller hedges today.
Where We Stand
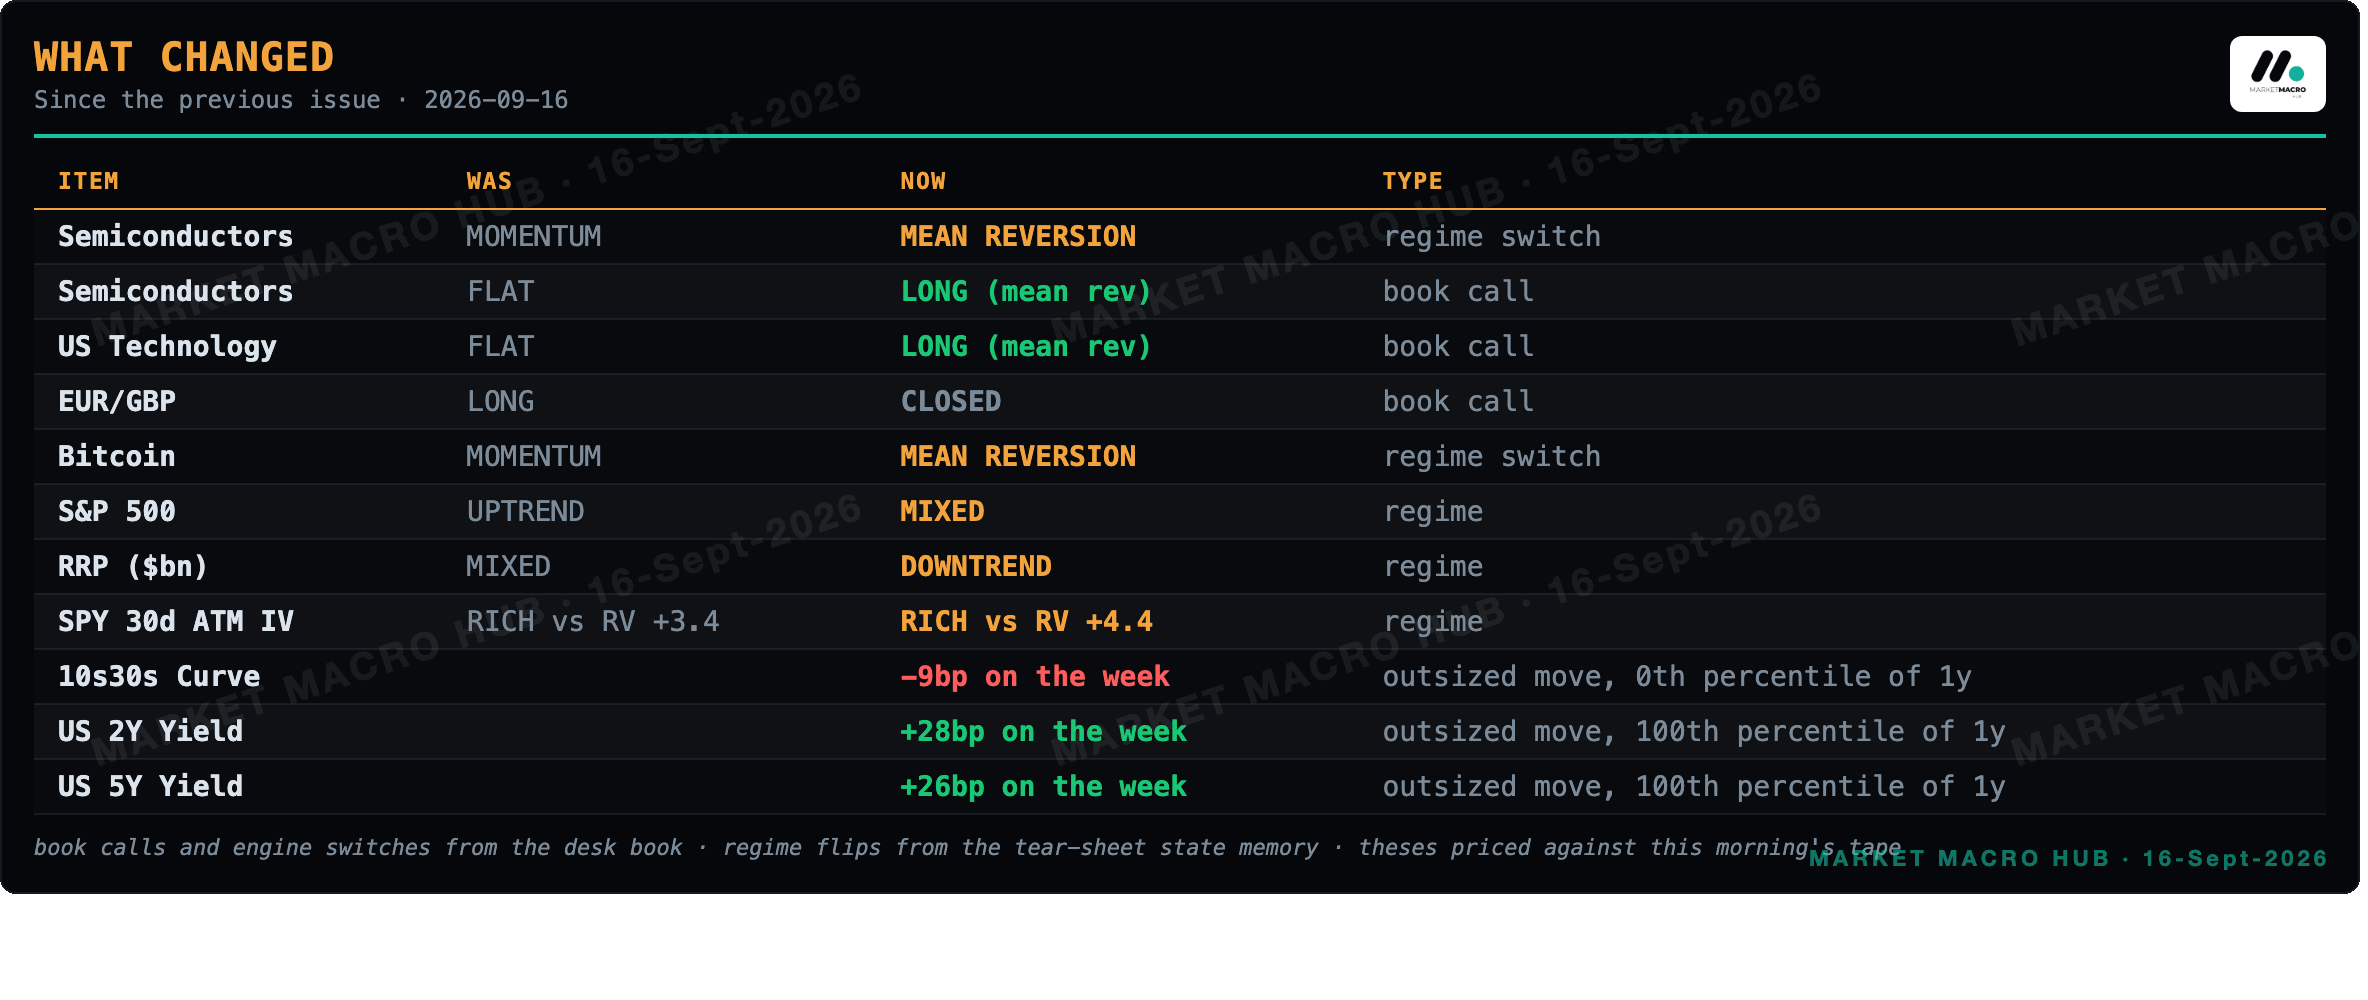
Yesterday I said I hold my pre-FOMC stance, a 96% October hike already sits in the price and I'm not fading it into the meeting. This morning's tape doesn't argue with that. My oldest live view is long IG carry at 80bp against a 90bp mean, invalidation pinned at 90, and credit is a shade tighter on the week, so that thesis stays intact and stays my anchor. The 2s10s flattening view from yesterday is my tell into today, and at 32bp the curve nudged another basis point flatter overnight, which keeps the read alive that the market doubts the back of the hike path. The copper crowding flag is still live too, positioning parked at the 100th percentile, and I'm not chasing that long.
What Changed
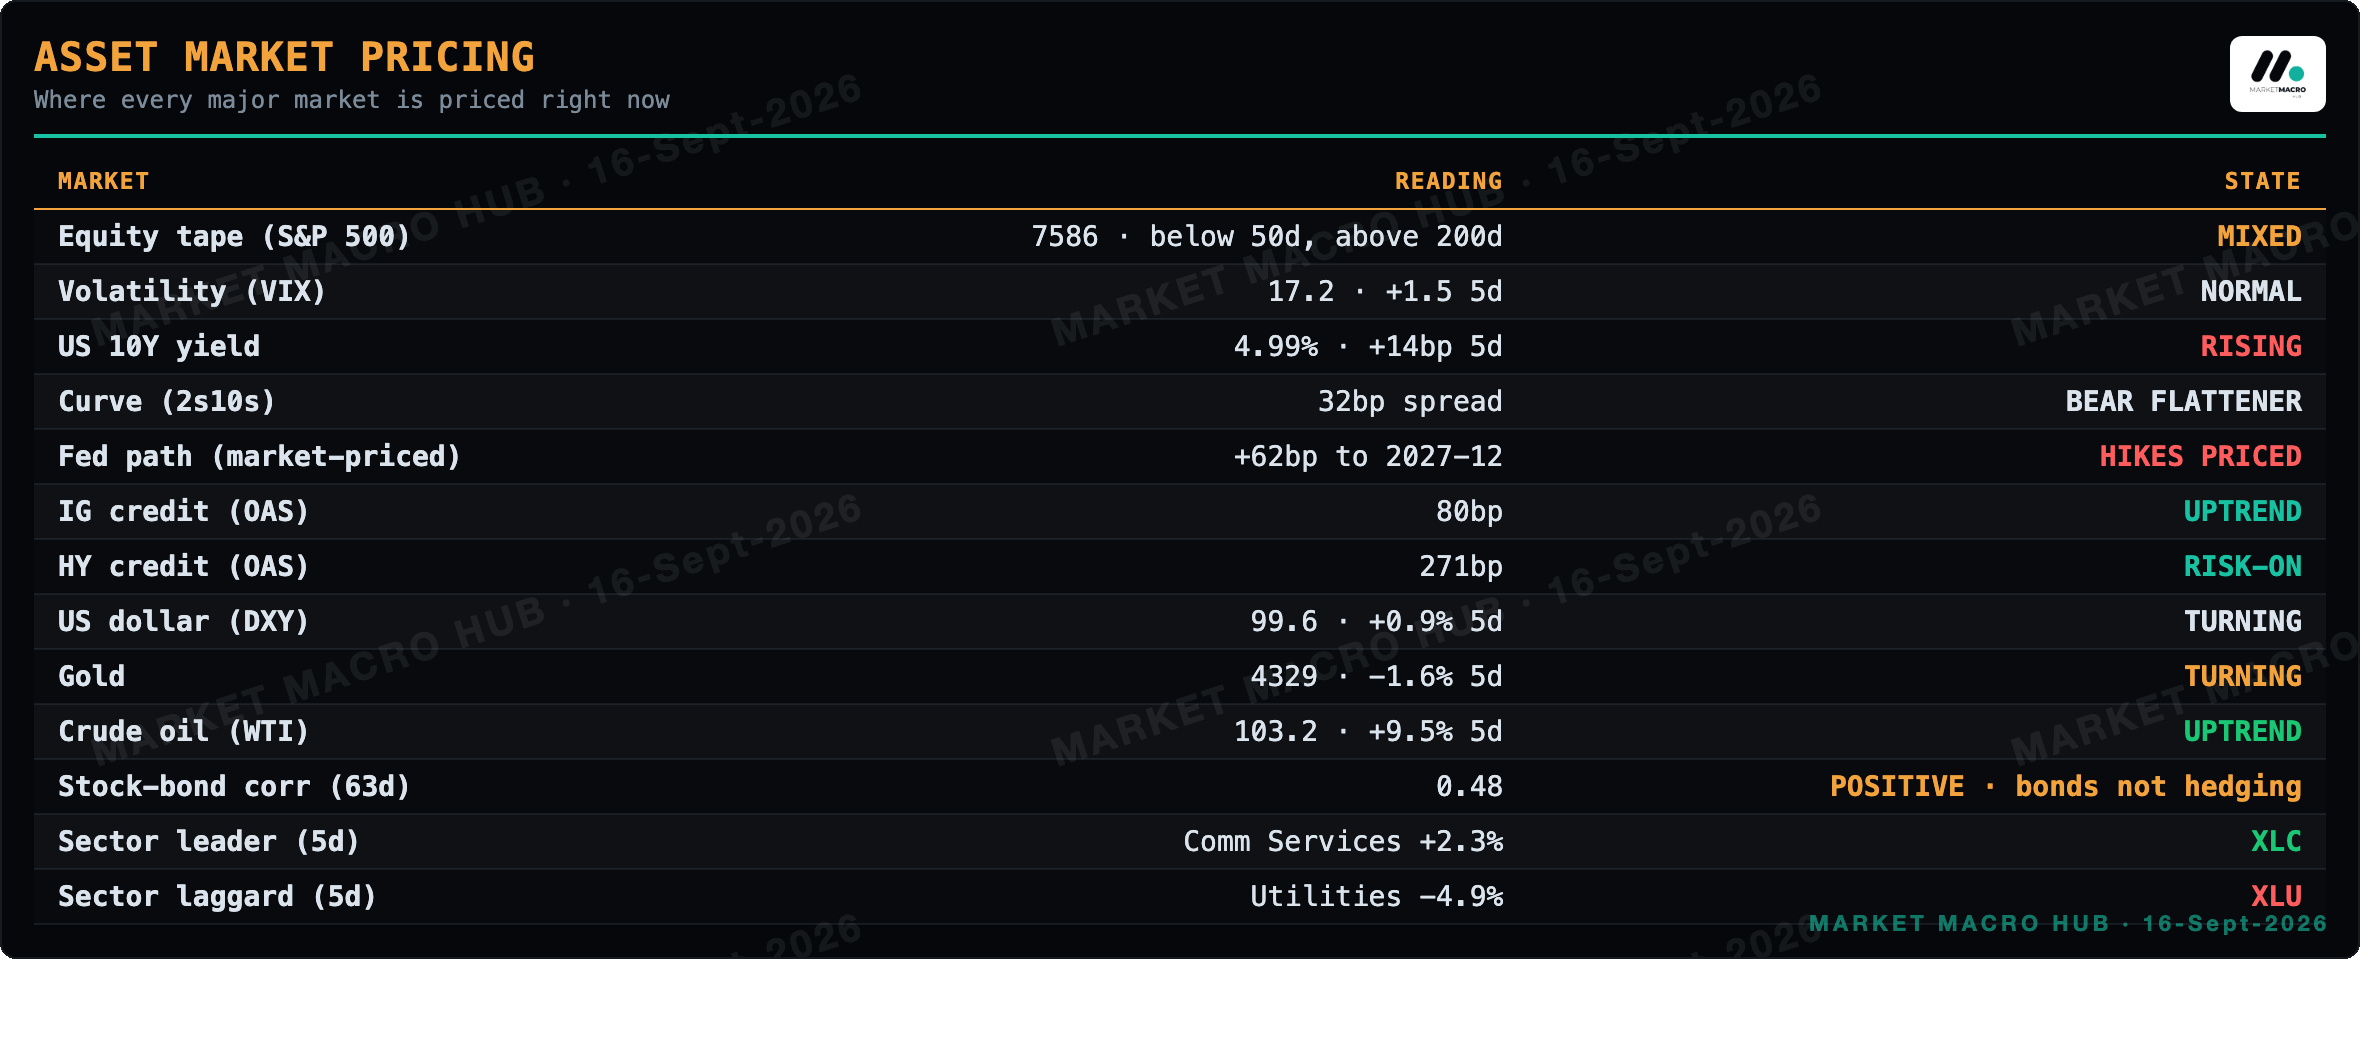
Asset Market Pricing
Sector Attribution
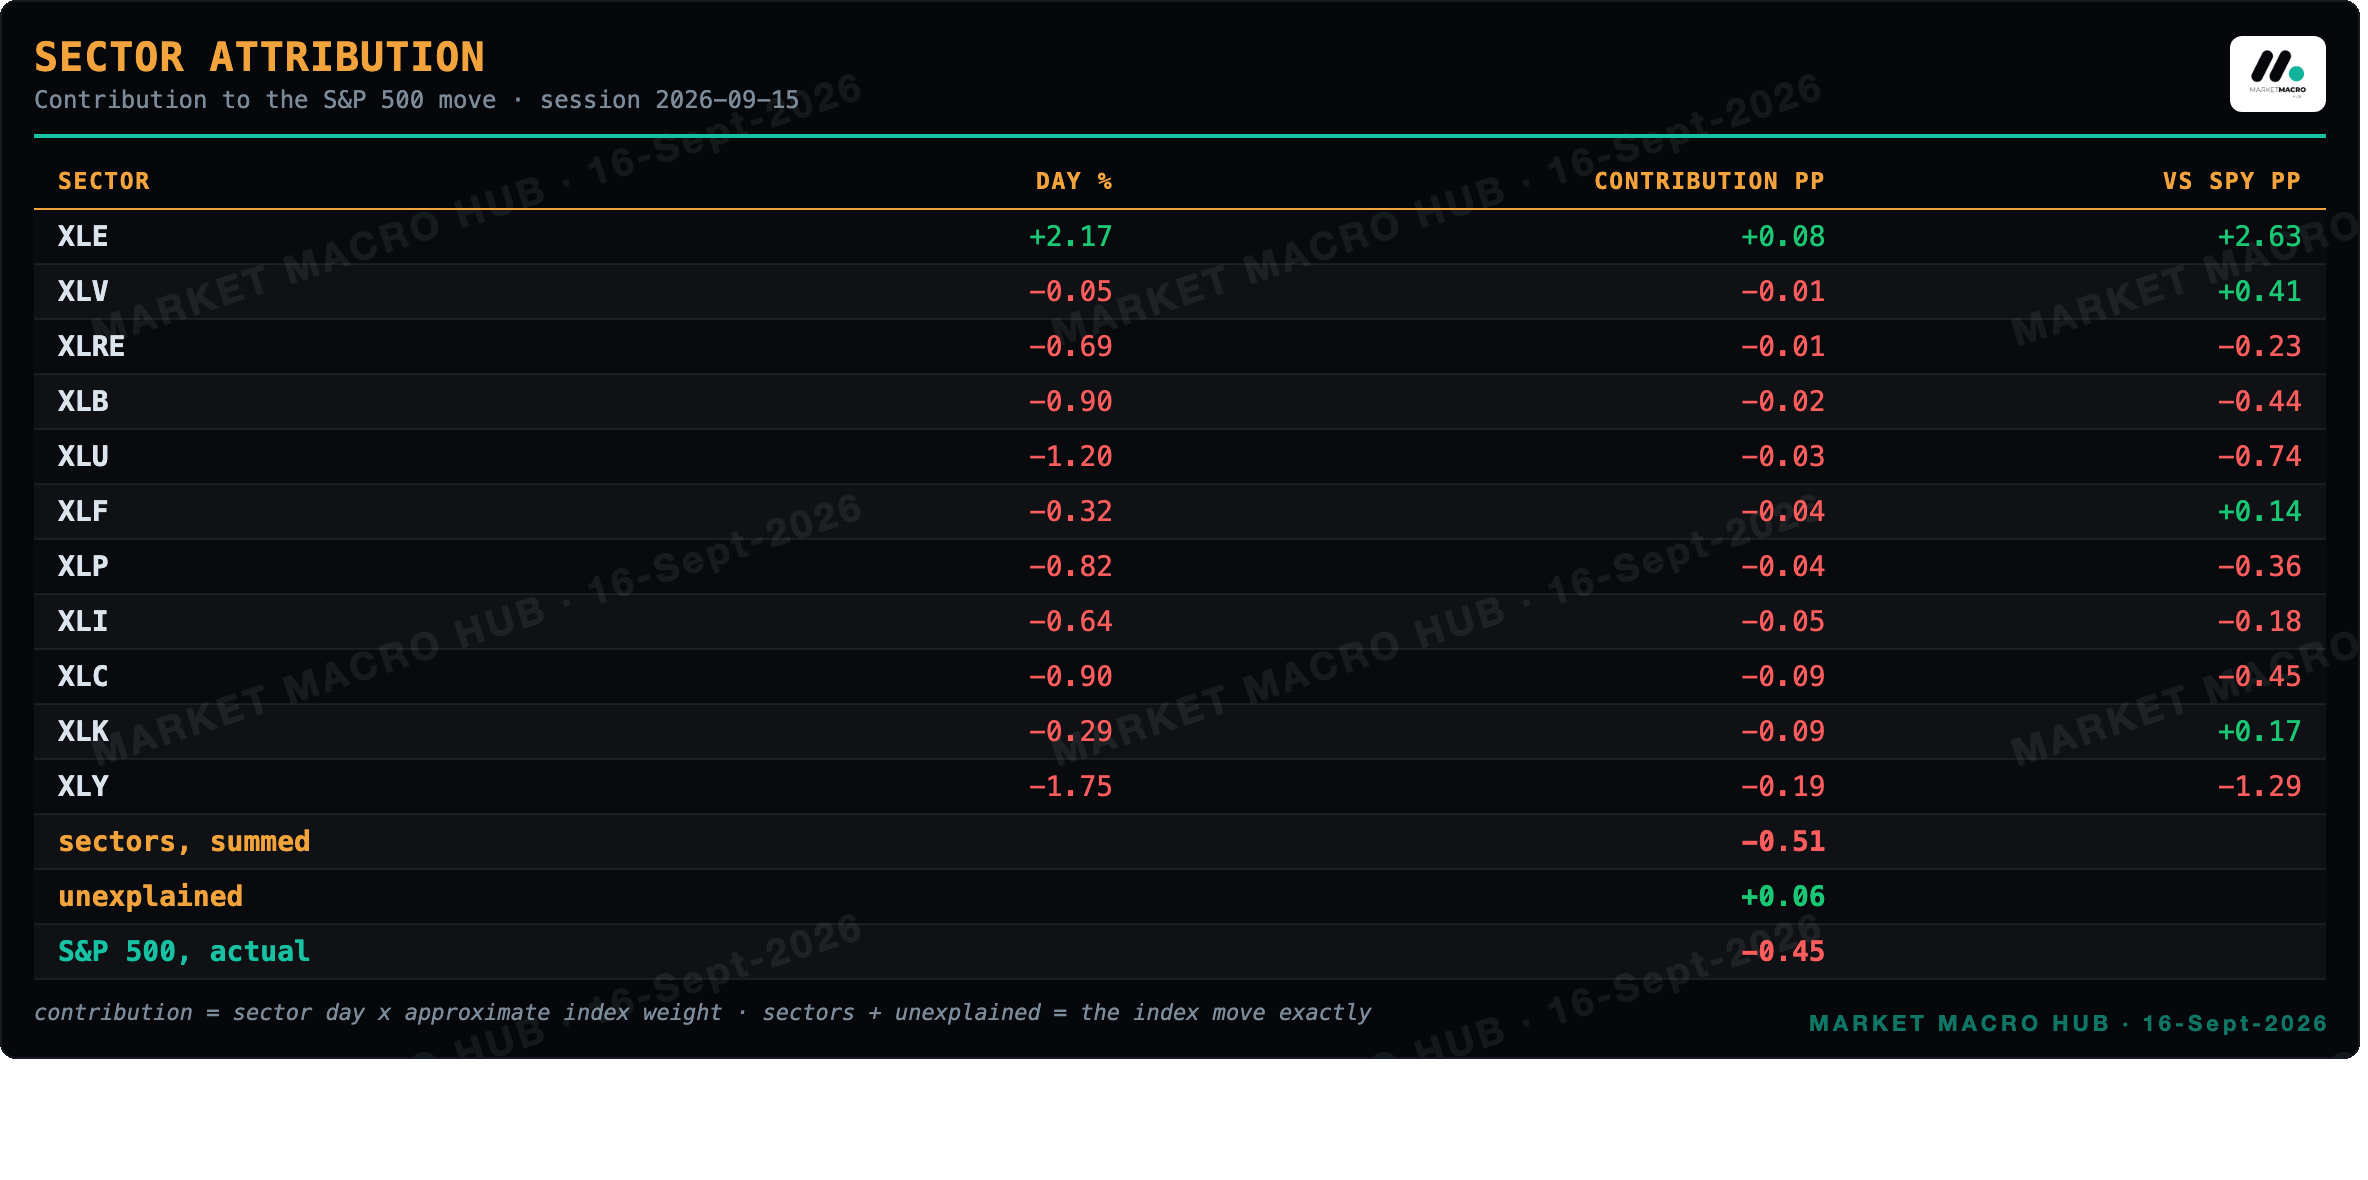
Session 2026-09-15. Sectors plus the unexplained remainder sum to the index move, and the sector split accounts for 87% of it.
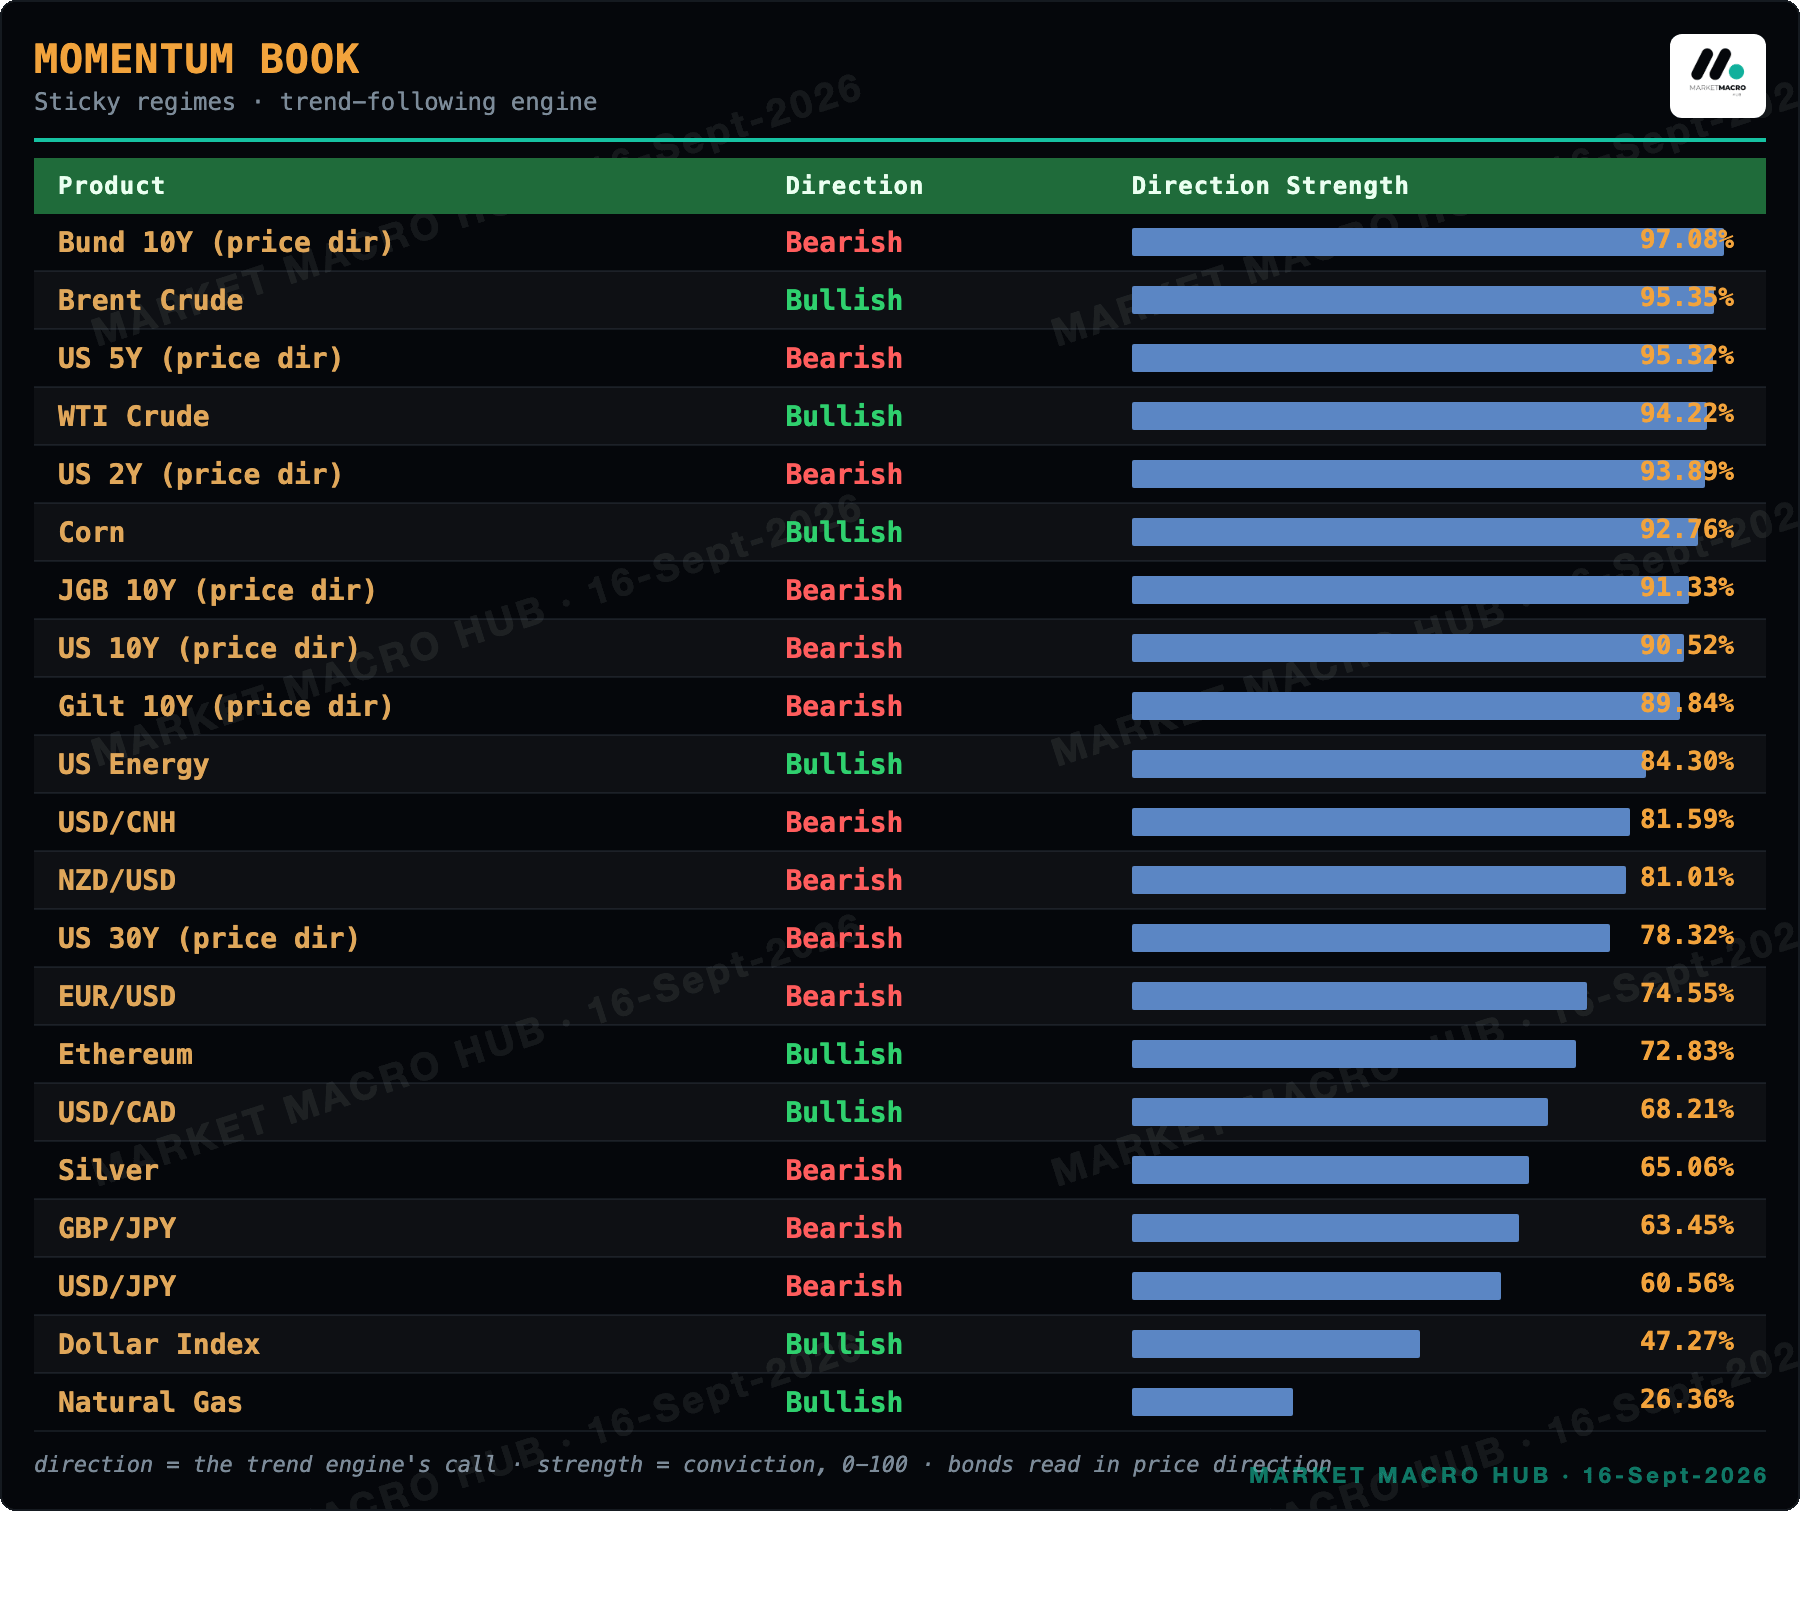
Momentum Book · Sticky Regimes
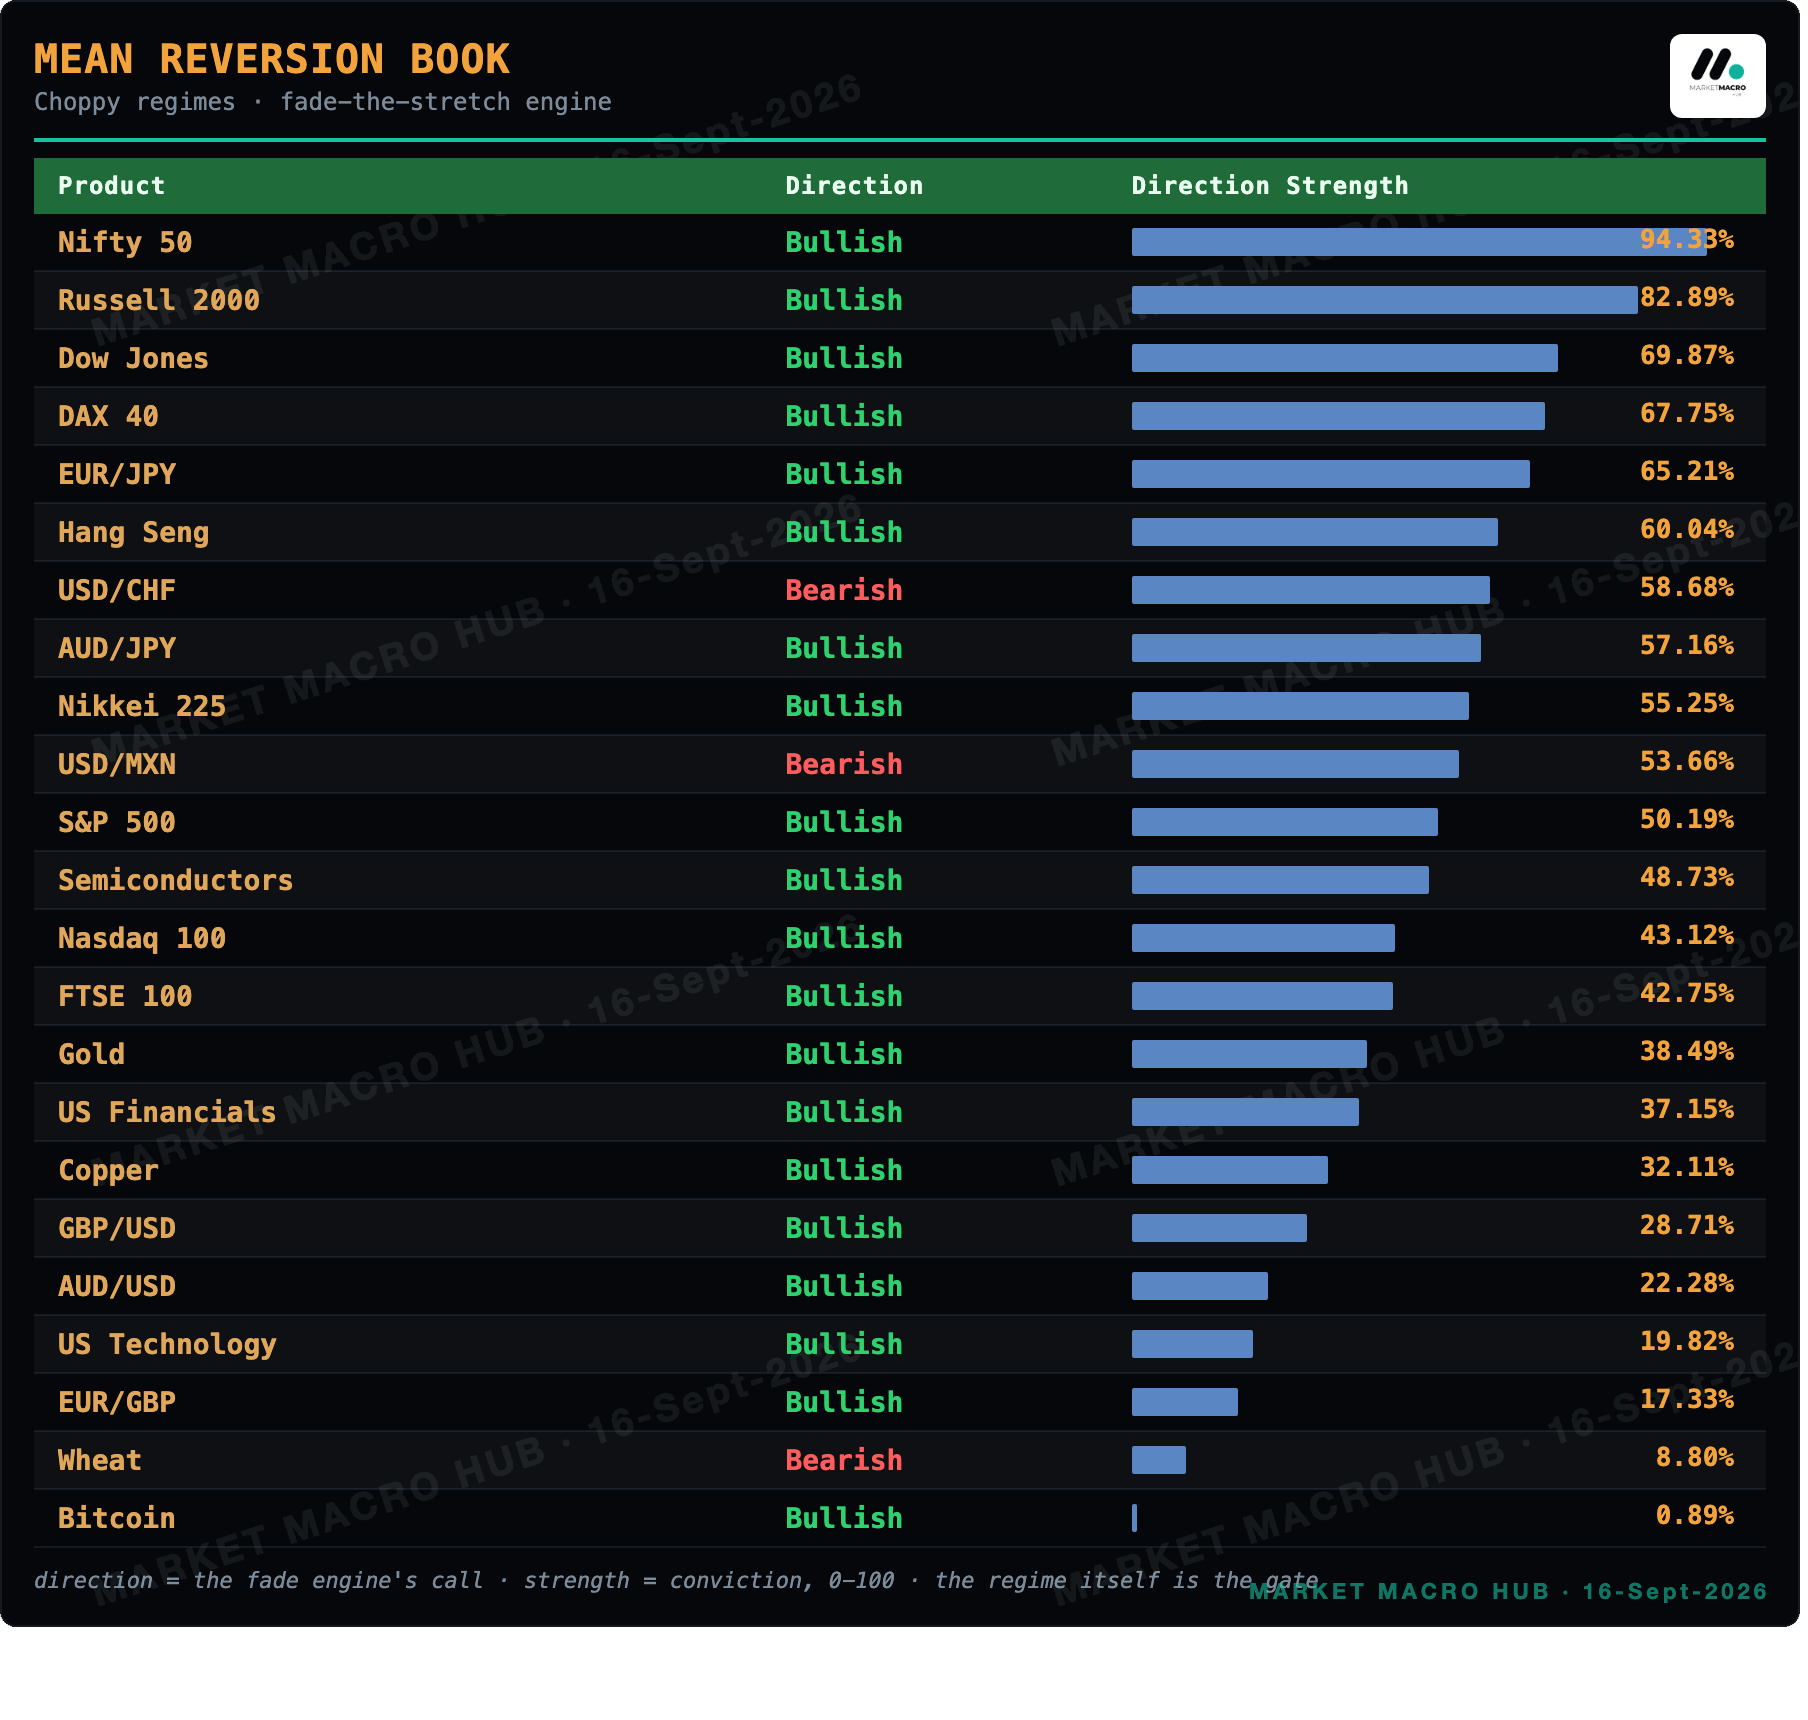
Mean Reversion Book · Choppy Regimes
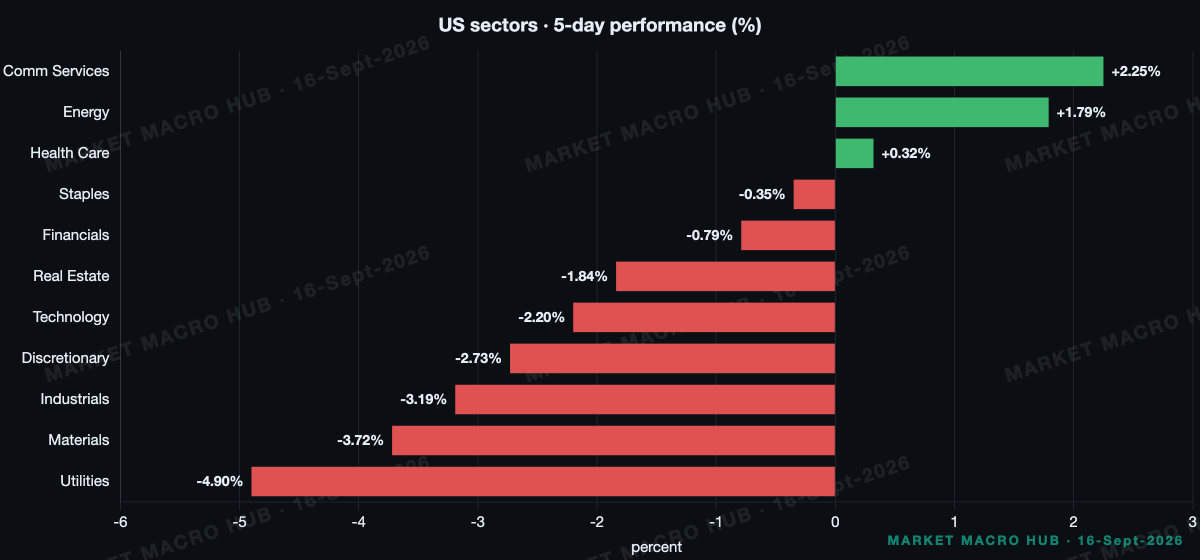
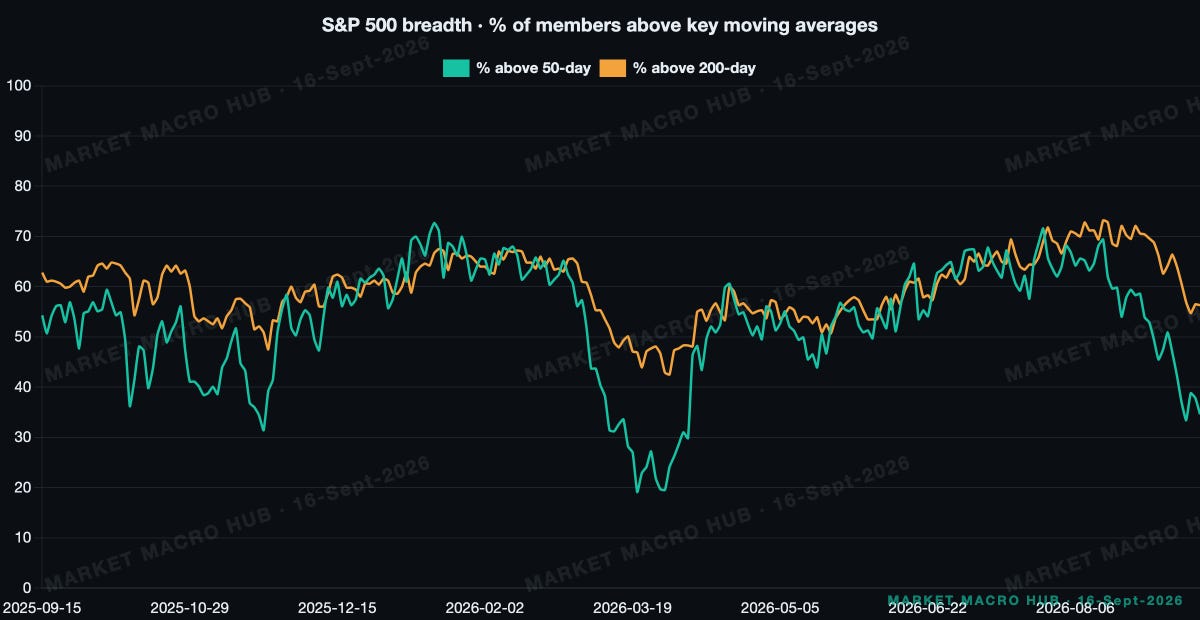
Sector Snapshot & Breadth
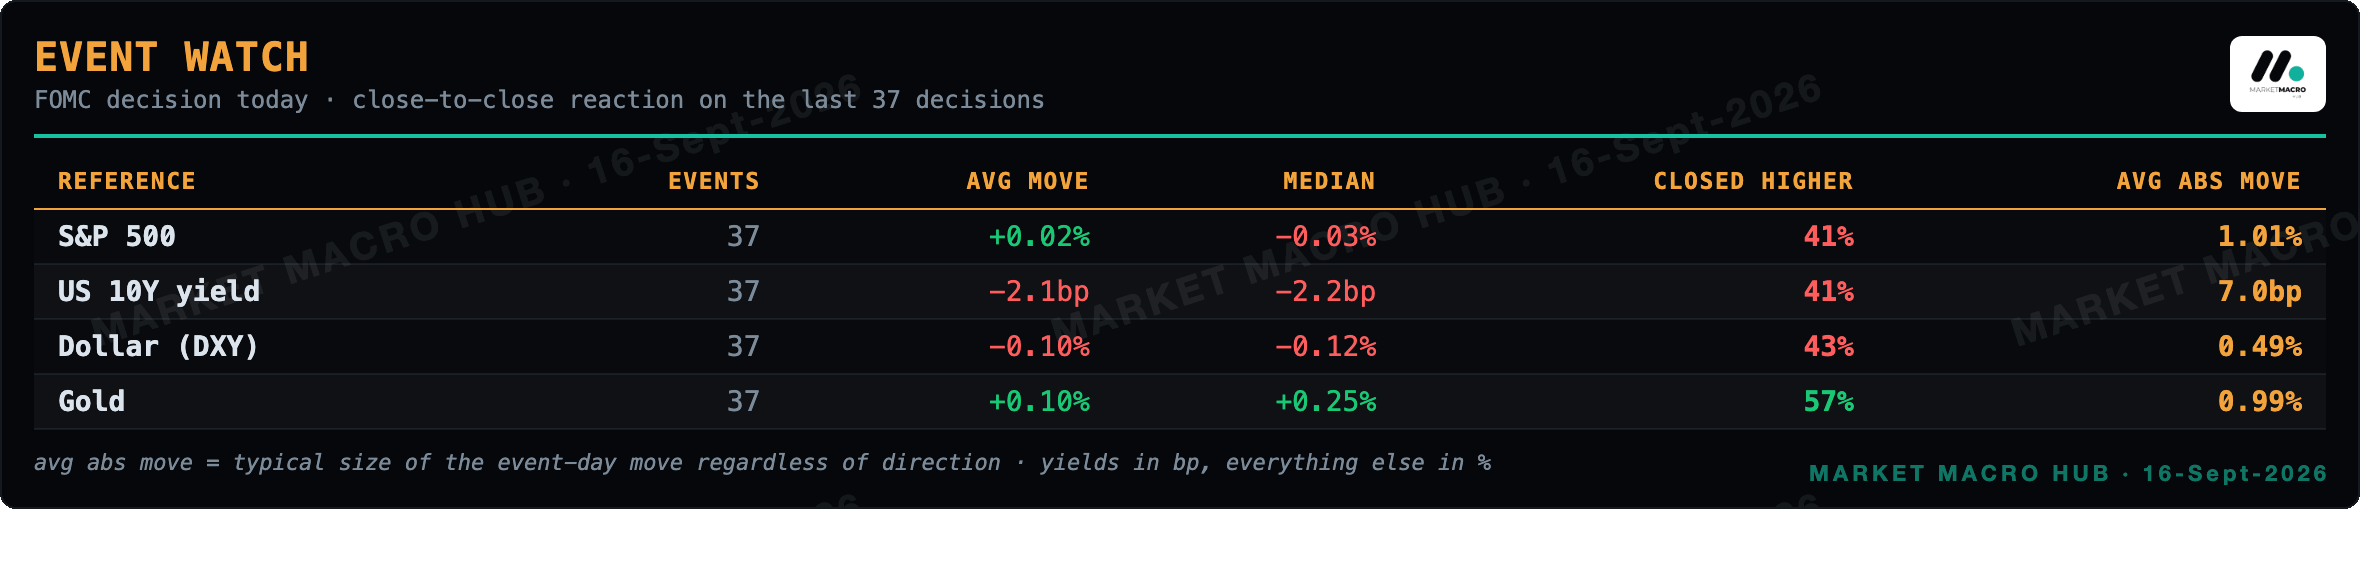
Event Watch · FOMC decision today
Into the print the book is long equity beta, short duration, long gold .
Main Developments in Macro
WARSH-LED FED DECISION DUE LATER, MARKET LEANS 96% TO A 25BP HIKE THOUGH NOT SEEN AS A DONE DEAL
LIBYA NOC SUSPENDS THREE OIL FIELDS AFTER PIPELINE VALVE CLOSURE, WARNS IT MAY DECLARE FORCE MAJEURE
SAUDI TELLS SOME EUROPEAN REFINERS SEPTEMBER CRUDE CARGOES CANCELLED, YANBU LOADINGS SUSPENDED
API CRUDE BUILD +7.1MLN VS -1.8MLN EXPECTED, A HEAVY OFFSET TO SUPPLY HEADLINES
US VP VANCE SAYS IRAN CONFLICT TO ENTER "MUCH DIFFERENT PHASE" IN COMING MONTHS
BESSENT SAYS TREASURY BUYBACK INTERVENTION SUCCESSFUL, DEFENDS YEN INTERVENTION AS "NOMINAL"
US stocks closed lower again on Tuesday, with the Nasdaq and Russell underperforming, and calls for a slowdown in AI development remained an overhang for sentiment, although the SOXX and DRAM ETFs were marginally firmer following their sharp declines on Monday. The prints underneath cut both ways on growth. Empire fell to 7.6 against a 14.75 consensus, and Michigan sentiment at 47.8 undershot badly, yet core CPI ran hot at 0.3% month on month. That mix is exactly why a hike prices at 96% while the soft data whisper the growth cost.
Cross-Asset Read
The selling on Tuesday was led by discretionary, roughly -0.19pp of the move, with communication services and tech each near -0.09pp. Energy was the one green sector as crude rallied on the Libya and Saudi headlines. The residual is real, so the sector split explains most of the day but not all of it.
The correlation I'm watching is gold against the dollar, now -0.69 versus -0.40 a month ago, flagged as a big shift. That deepening inverse link means a firmer dollar into the Fed presses gold lower more reliably than before, so I'd size any gold hedge smaller here.
Credit still refuses to corroborate the equity anxiety. IG sits at 80bp, the tight end of its range against a 90bp mean, and HY at 271bp says appetite at the low-quality end is intact. That is why I keep reading the AI wobble as a sentiment event and see no sign of a growth break.
Rates & Fed Pricing
No month on the strip has a cut half-priced, so the whole conversation is about hikes. Money market pricing is leaning heavily towards a 25bps hike, although such a move is not quite seen as a foregone conclusion. September carries roughly 96% odds. Cumulatively the strip builds to +96bp by November 2027 at 4.59%, with the trough this month at 3.87%. Terminal repriced +14.5bp on the week but flat overnight, so the aggression built earlier in the week and this morning added nothing. The 2Y up +28bp on the week is doing that repricing. If the statement leans hawkish and the 2s10s flattens further, I read that as the market doubting hikes beyond October can be realised. A steeper curve on the print would change my mind.
The Week Ahead
Wednesday, FOMC decision, the whole note hinges on the statement tone and whether the strip extends beyond October.
Wednesday, US Retail Sales, cons 0.8% after -0.6%, a strong control group would harden the growth-can-take-it read.
Wednesday, Import Prices and NAHB, second tier, unlikely to move my view.
Wednesday, EIA crude stocks after a 7.1mln API build, watch whether the official number confirms and undercuts the supply bid.
Thursday, Initial Jobless Claims, my next real growth tell after the soft Empire and Michigan prints.
Tradeable Levels
Pivots off the last completed session (2026-09-15). Levels marked * sit within 0.6 x ATR14 of the close.
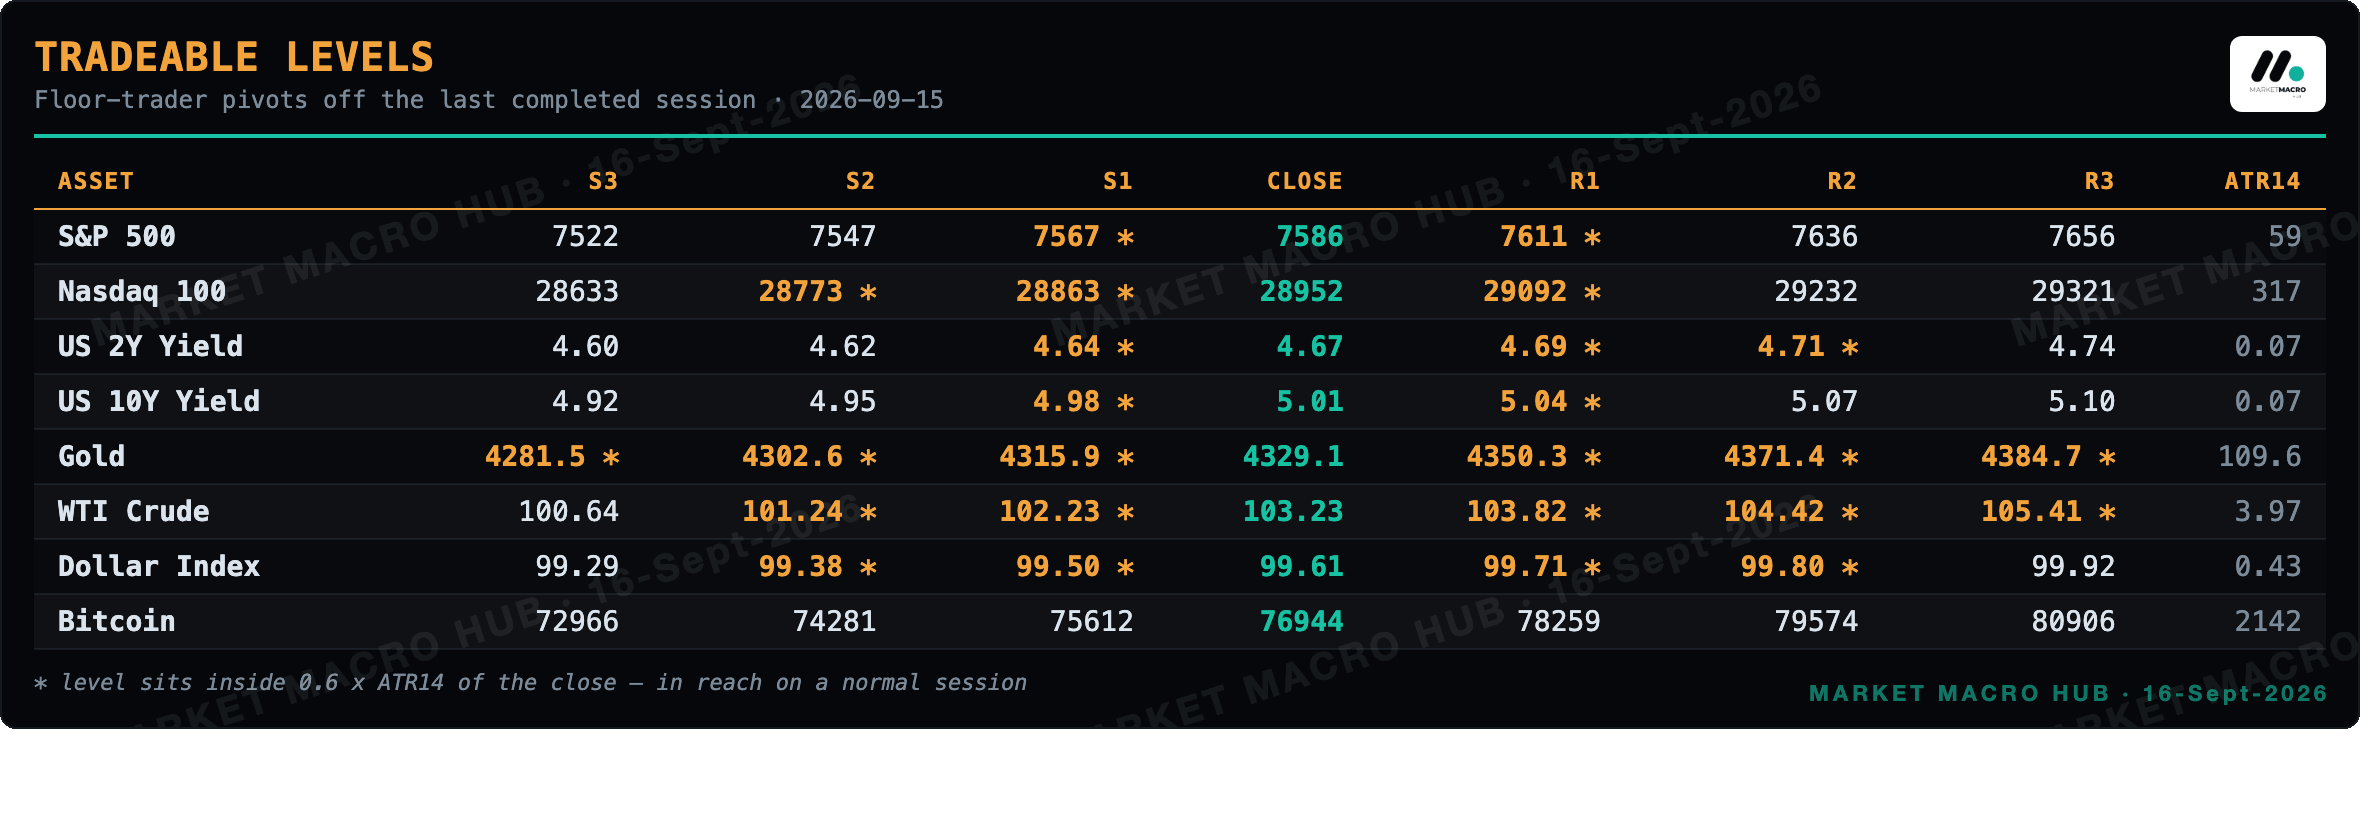
Gold priced off a session whose range was under a third of normal travel, so that board is compressed and nearly every level sits in reach. Weekend crypto and half-day holiday sessions do this; treat the levels as loose rather than precise.
Vol Screen · Rich and Cheap Implied Vol
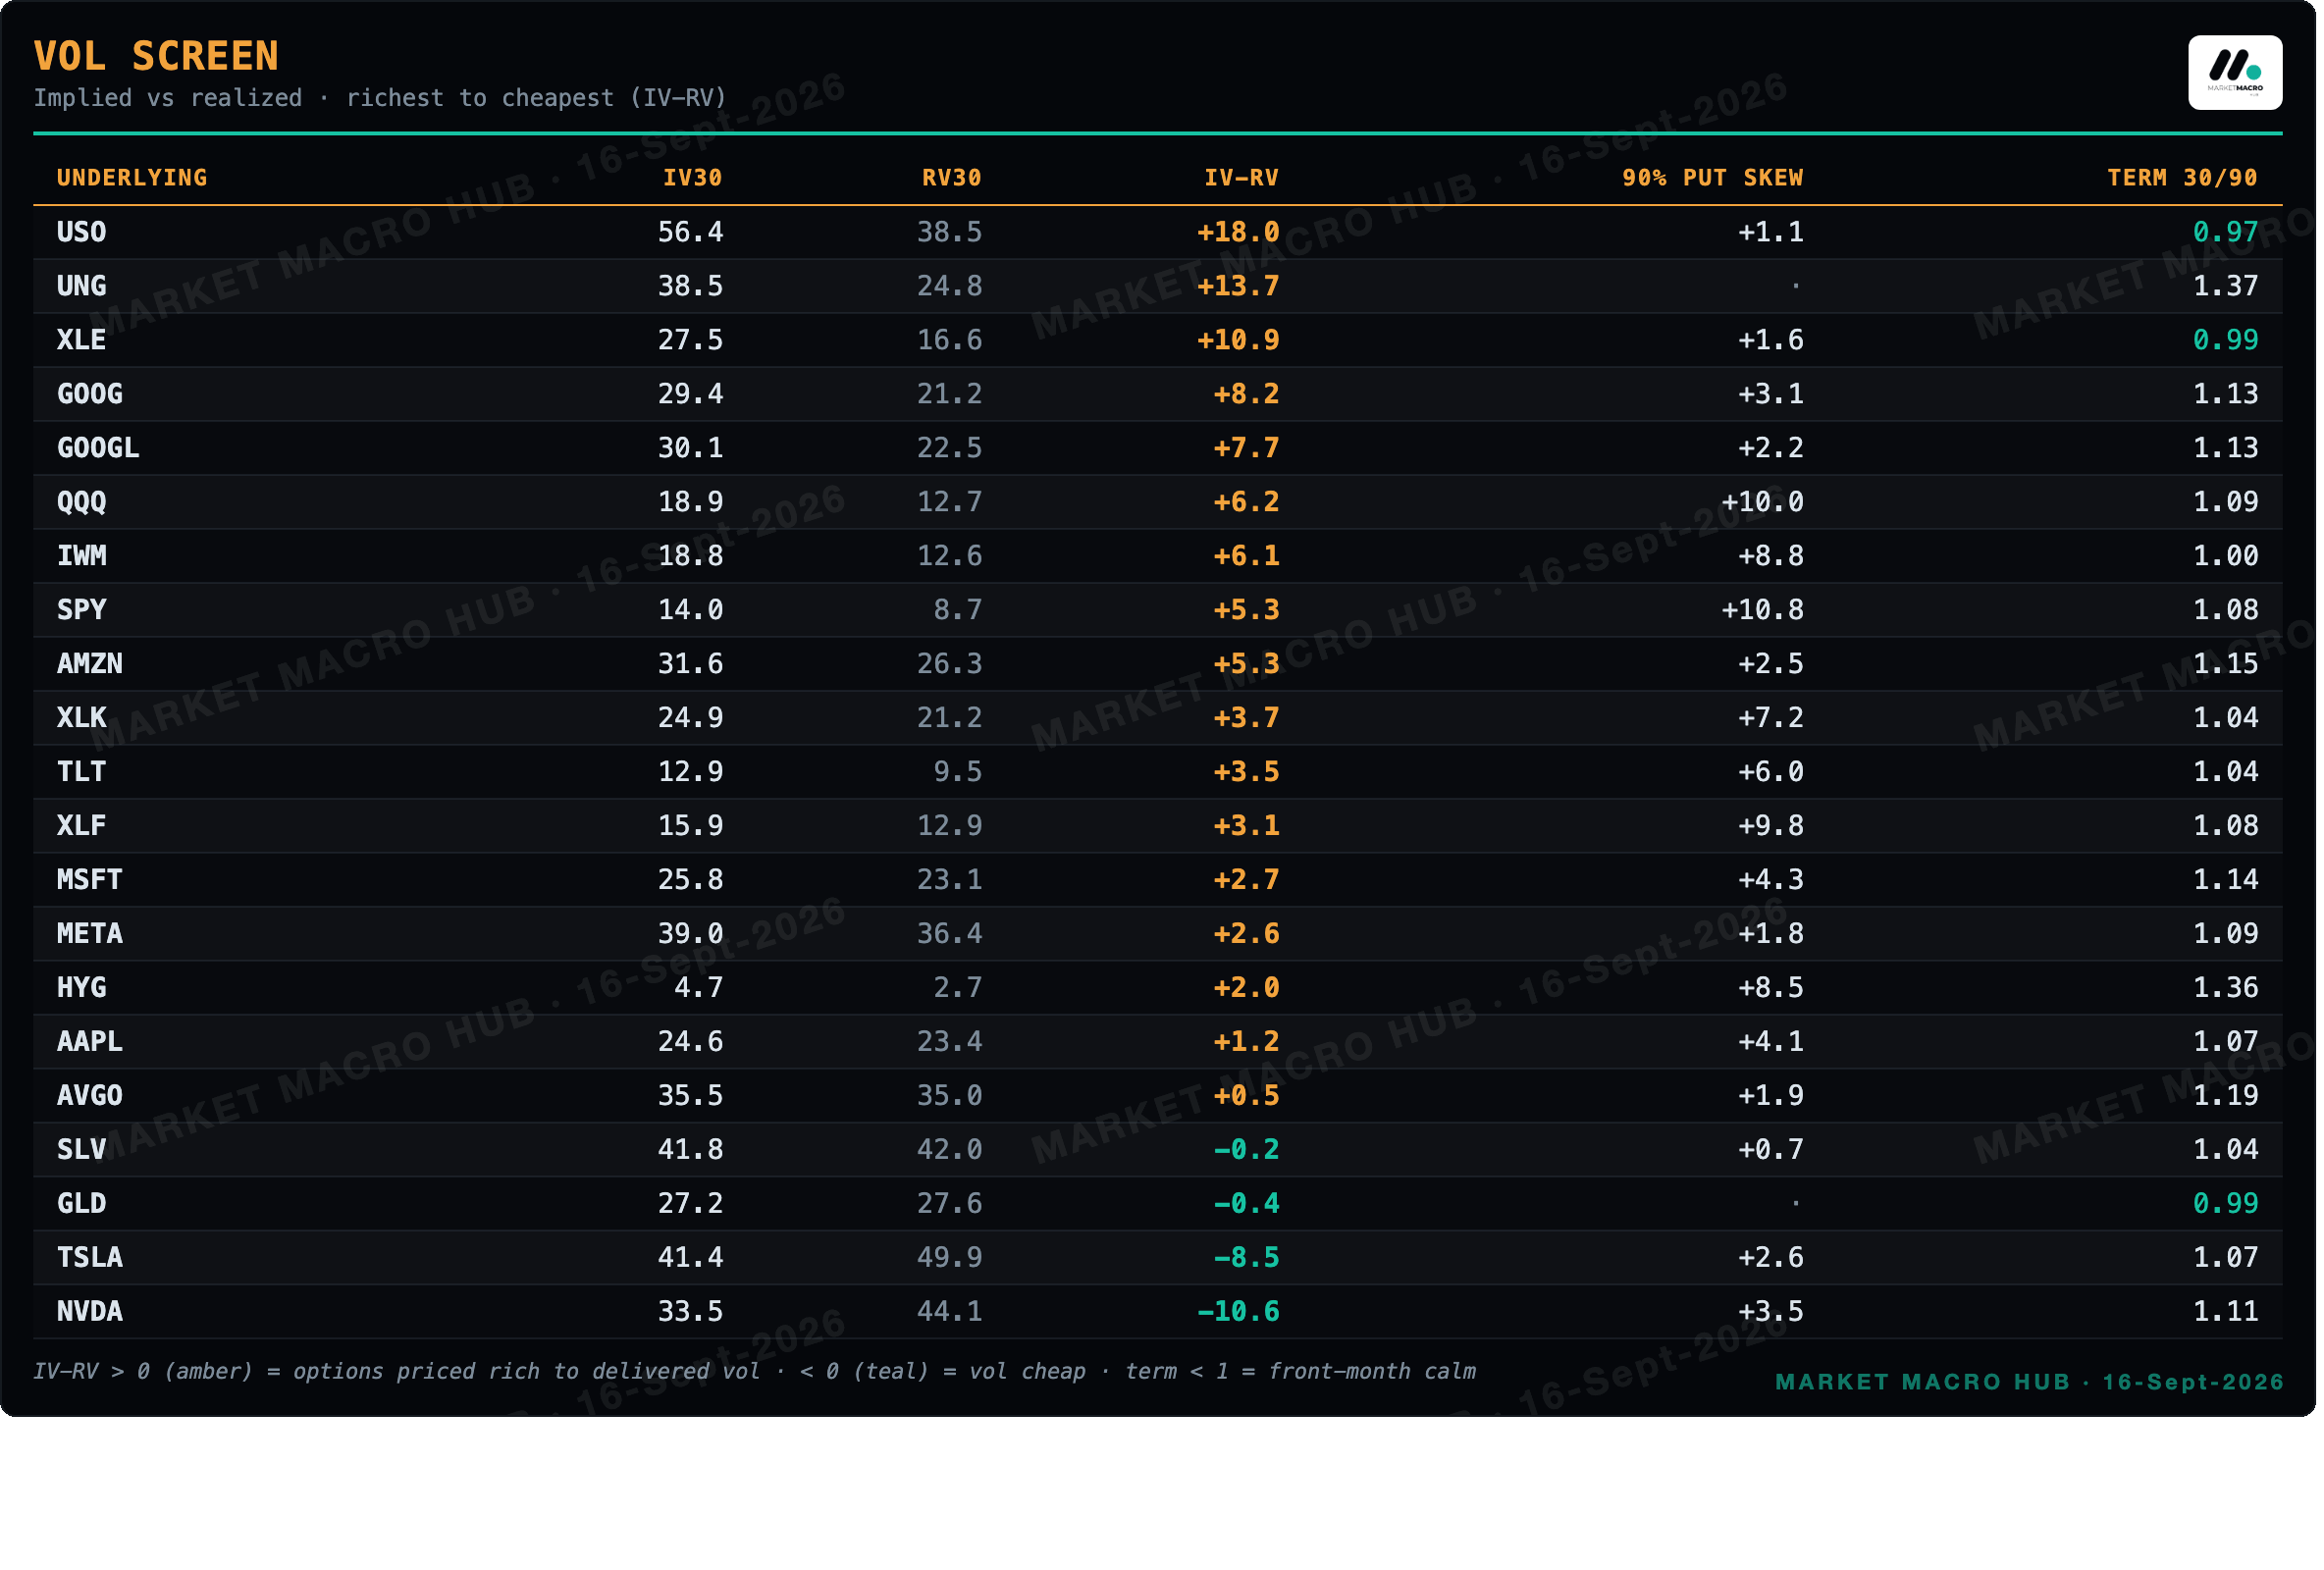
Positive IV-RV = options priced rich to what the tape is delivering (USO and UNG richest today); negative = vol going cheap (NVDA and TSLA).
Disclaimer
The information in this publication is provided for informational and educational purposes only and is believed to be reliable, but its accuracy and completeness are not guaranteed. Nothing herein constitutes investment advice, an offer, or a solicitation to buy or sell any security, derivative, digital asset, or other financial instrument, nor a recommendation suited to any specific reader. All figures are drawn from the day's computed data set at the time of generation and may be delayed, revised, or superseded. Markets involve risk, including the possible loss of principal; past performance and historical relationships do not guarantee future results. Readers should conduct their own research and consult a qualified financial adviser before making any investment decision. The author may hold positions in instruments discussed. This publication is licensed for the personal use of the subscriber only: redistribution, reproduction, or resale in any form is prohibited. © 2026 MARKET MACRO HUB. All rights reserved.