
Supercore CPI, JGB Play & UST Curve
Navigating Macro Trends and Strategic Trades in a Volatile Landscape

Hey crew,
Stay locked in.
The message I tend to repeat to myself, persevere through the boring, that’s where the progress is truly made.
I spent the week running through markets anticipating Wednesday’s CPI print, so you can look forward to a deep yet concise review of the reading as well as the two recent macro trades I put on with a simple outlay on the second position with time horizons.
As always, I appreciate you.
Enjoy
Macro Snapshot
There may not be any stag or flation, in the U.S as Jay Powell said at his presser, but it’s certainly a risk in Japan.
The Japanese economy failed to grow for the third successive quarter. Q2 ‘23 was the last time Japan’s QoQ GDP expanded at a modest rate as seen in Figure 1.
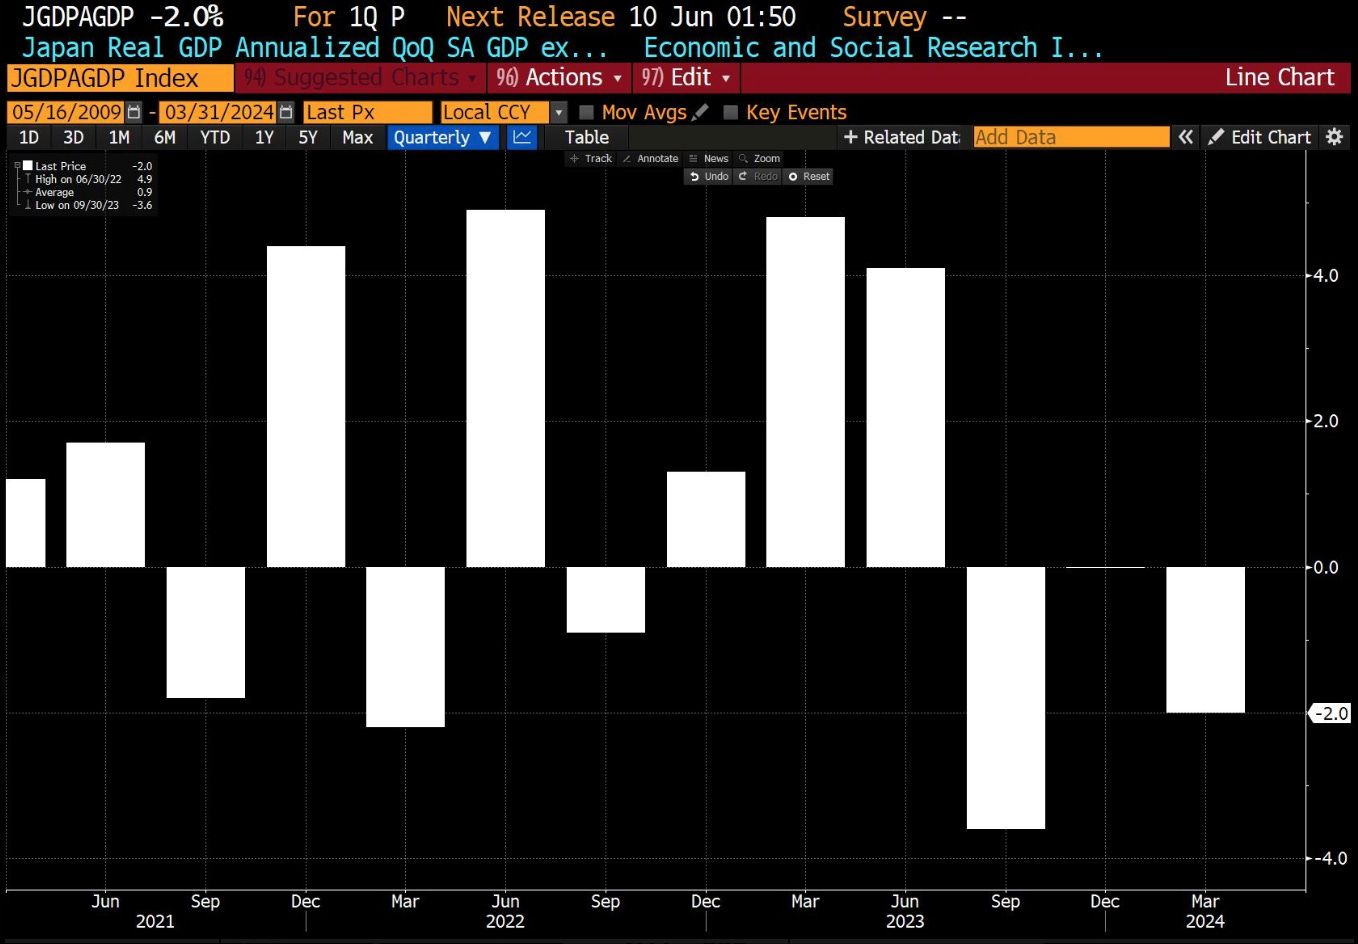
Annualised GDP for Q1 declined by 2%. Consumer spending has largely been an issue for both China and Japan, the average monthly consumption expenditure per household for March (latest data available from the Bureau of Japan) showed an increase of 1.9% in nominal terms, when adjusting for inflation consumption spending was down 1.2%.
If you’re wondering why consumption was down, we can pinot to stagnant wage growth.
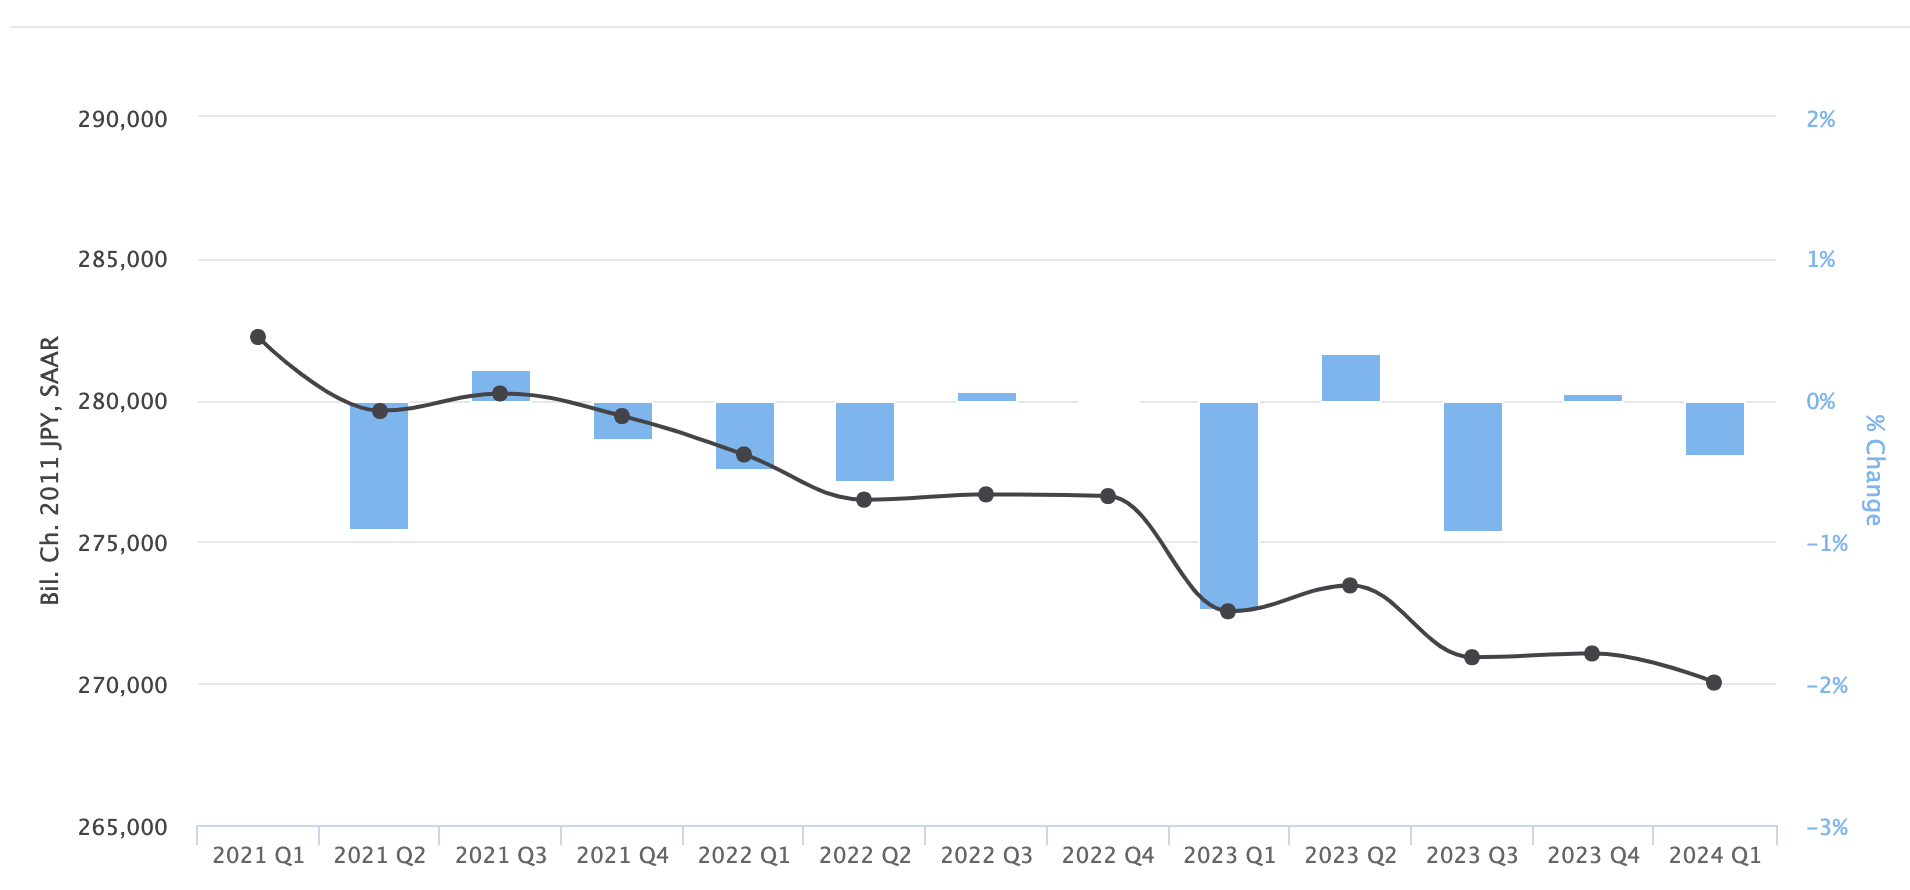
Figure 2 shows the quarterly change in real wages & salaries. Real wages last increased notably in the spring of 2023. Despite the large measures of monetary support, the Japanese economy is dancing with stagflation; inflation, as desired, is above the 2% target but when growth fails to follow suit and declines that very quickly becomes an issue for the BOJ’s future policy decisions.
The possibility of the BOJ increasing rates this year remains bleak if the economic data out of Japan continues to disappoint.
Thought of the Week
There’s only one focus in macro markets. Rate cuts.
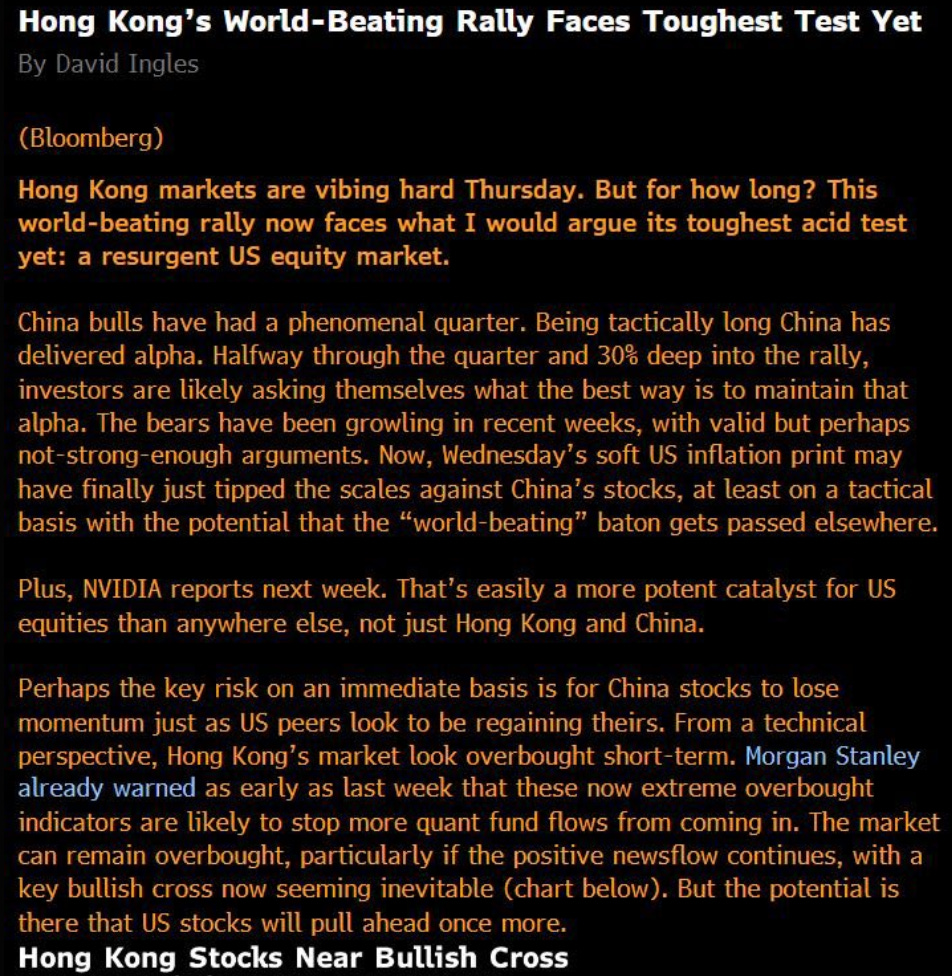
Building on from my HSI thoughts last week there’s now an emerging risk that US equities will steal the spotlight from Asian equities after receiving a soft core CPI print. even a slight indication of a Fed rate cut shifts momentum towards U.S. markets, overshadowing equity fundamentals.
We’re at a point now in markets, where everything is moving to the beat of the Federal Reserve, and that beat is predicated on the path of future Fed cuts. Despite Chinese equities still presenting a steep discount relative to 2021 highs, even a slight indication of a Fed rate cut shifts momentum towards U.S. markets, overshadowing equity fundamentals.
Whilst equities are at the bottom of my focus list, (for now), as a macro trader it’s hard to ignore clear value plays when you understand the dynamics behind the economy. Hong Kong remains a market of focus for me, yes there are structural issues which need to be resolved, but name me a DM economy that hasn’t got deep structural issues. China is consistently a recipient of negative media attention.
Chart of the Week
Sell US assets, and use proceeds to load up on gold.
That seems to be the clear trend in China as geopolitical tensions between Washington and Beijing rise, new tariffs imposed by Biden have quadrupled tariffs on Chinese goods, particularly Chinese EVs and the U.S election season continues to pose increased risk for Chinese holders of US debt.
$53.3bn of Treasuries and agency bonds were sold off in the first quarter,

Since the start of 2024, XAU/CNH has rallied by c.17%.
Local demand for gold among Chinese investors remained steady throughout the first quarter. The metal's role as a hedge against U.S. geopolitical risks has enhanced its attractiveness to investors.
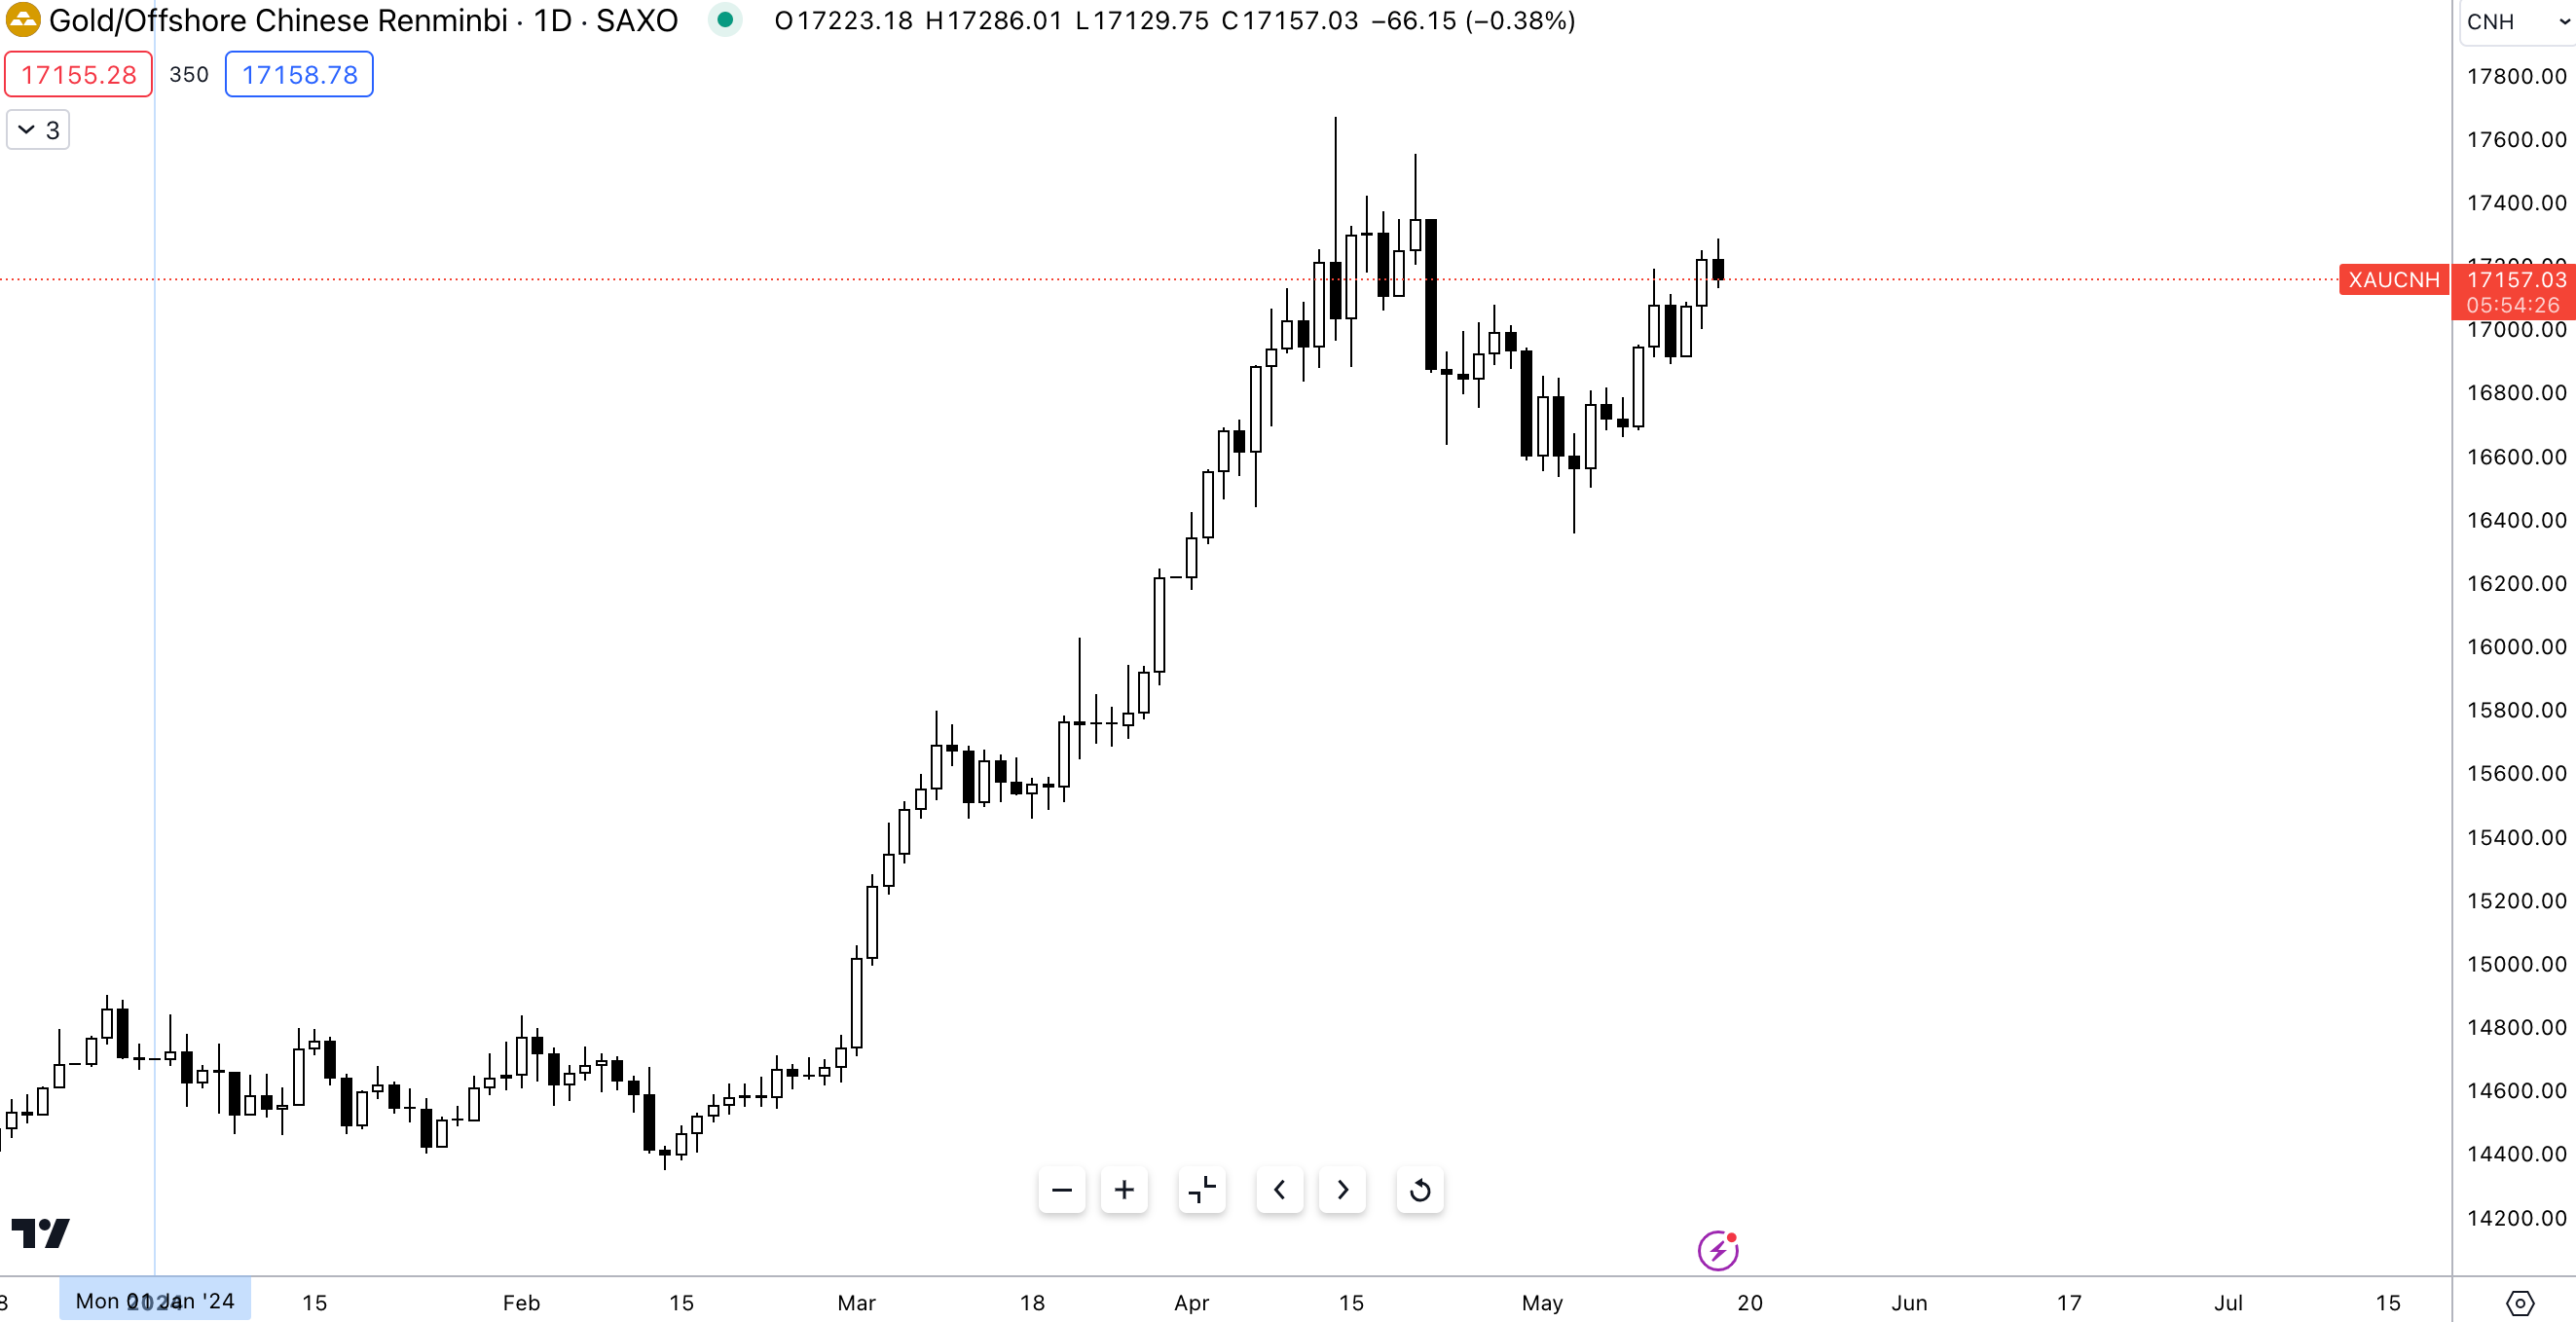
The rally continues.
Inflating Expectations & the JGB Play
Wednesday’s inflation reading was the most important inflation print for the markets as it would set the future policy path for the Fed, to cut or not to cut. Core CPI declined from March’s 3.8% to 3.6% in April whilst headline inflation fell to 3.4% from 3.5%. MoM both core and headline inflation rose 0.3%, levels last seen in January.
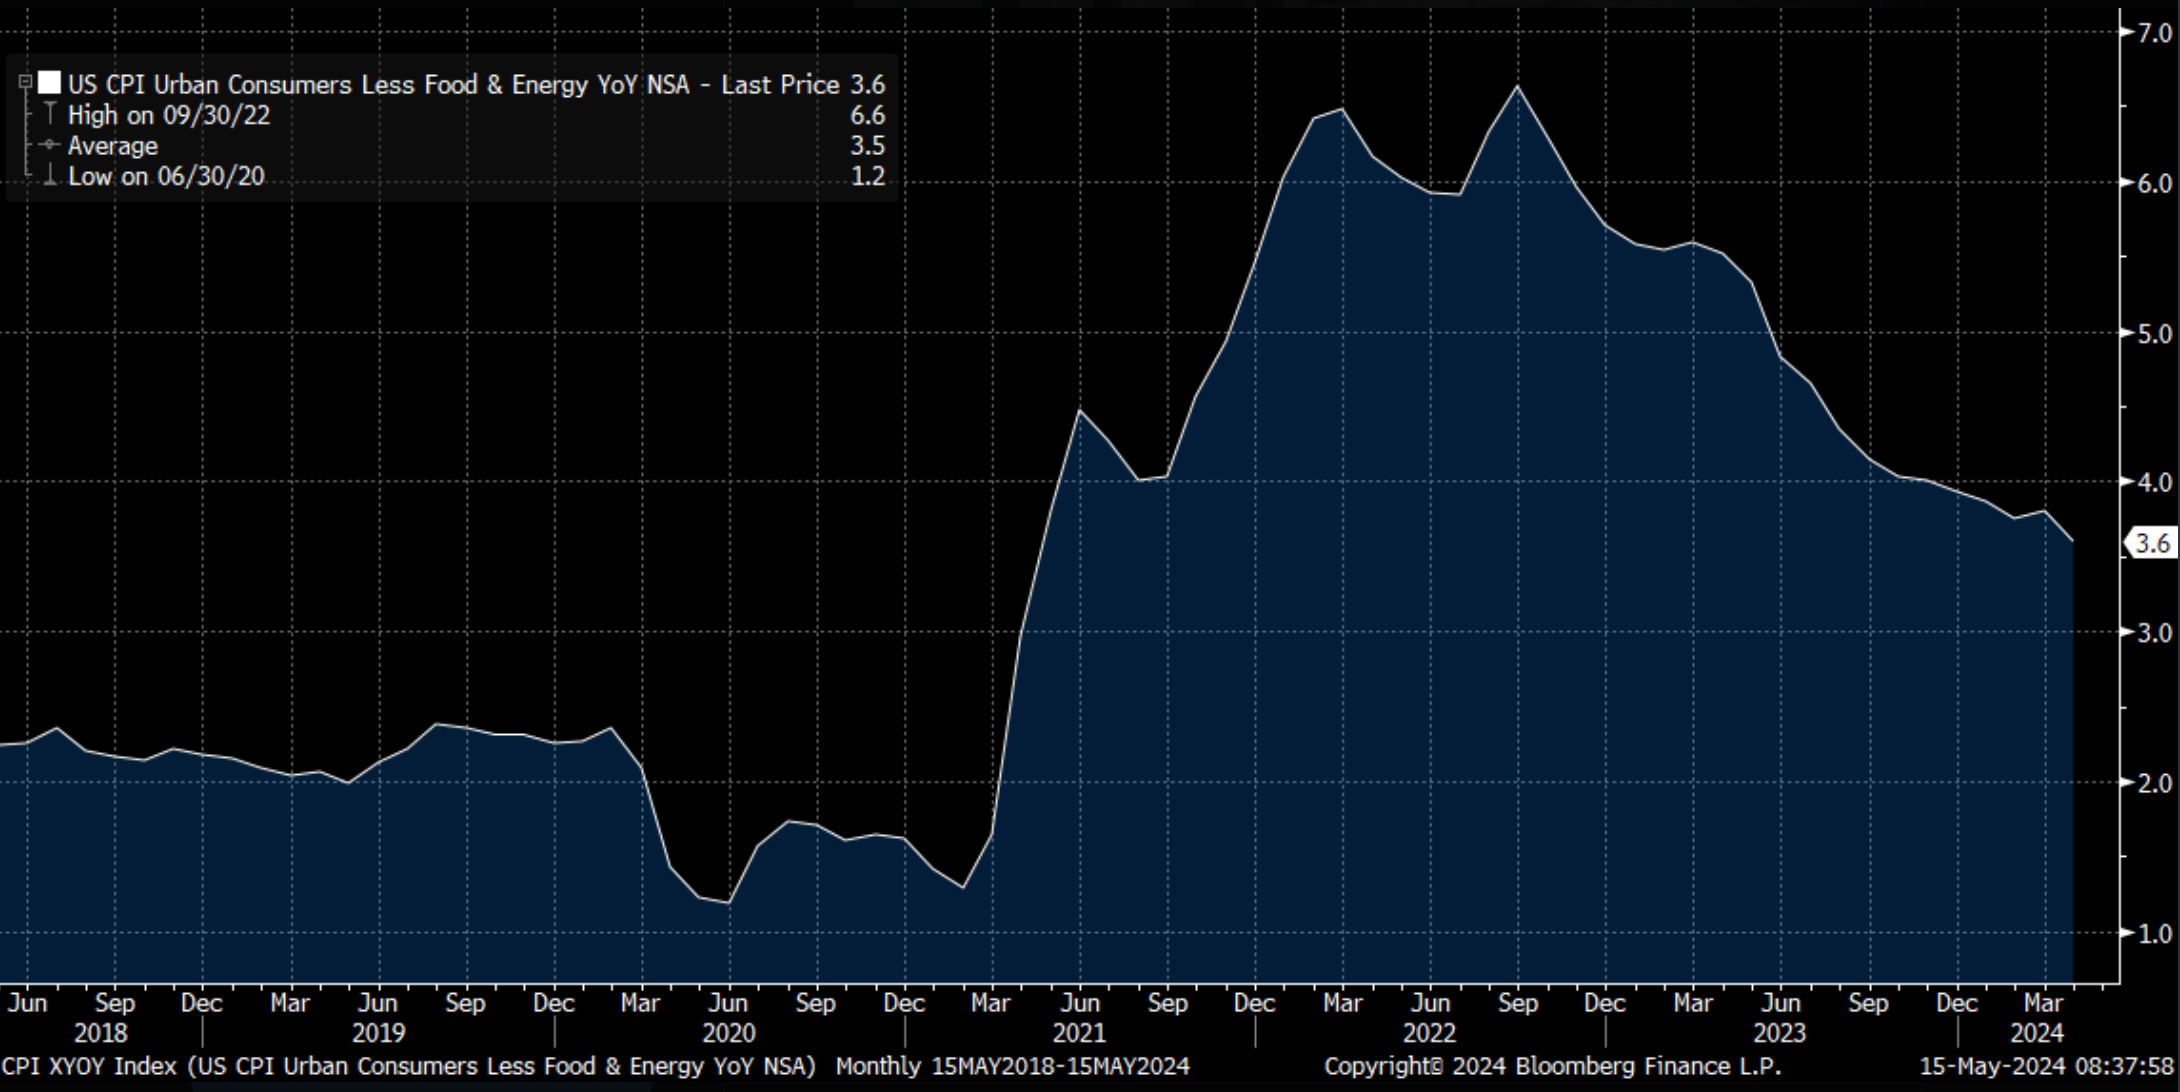
Let’s dissect the supercore CPI reading which the Fed seemingly pays elevated attention to.
Supercore CPI is a specific measure of inflation that focuses on a subset of components. Supercore CPI takes the core inflation reading, ( data excluding food and energy), and strips away housing-related inflation. This allows the Federal Reserve to capture the most persistent and underlying inflation pressures. Services such as transportation, recreational and medical all fit into this narrower subset of the supercore inflation reading.
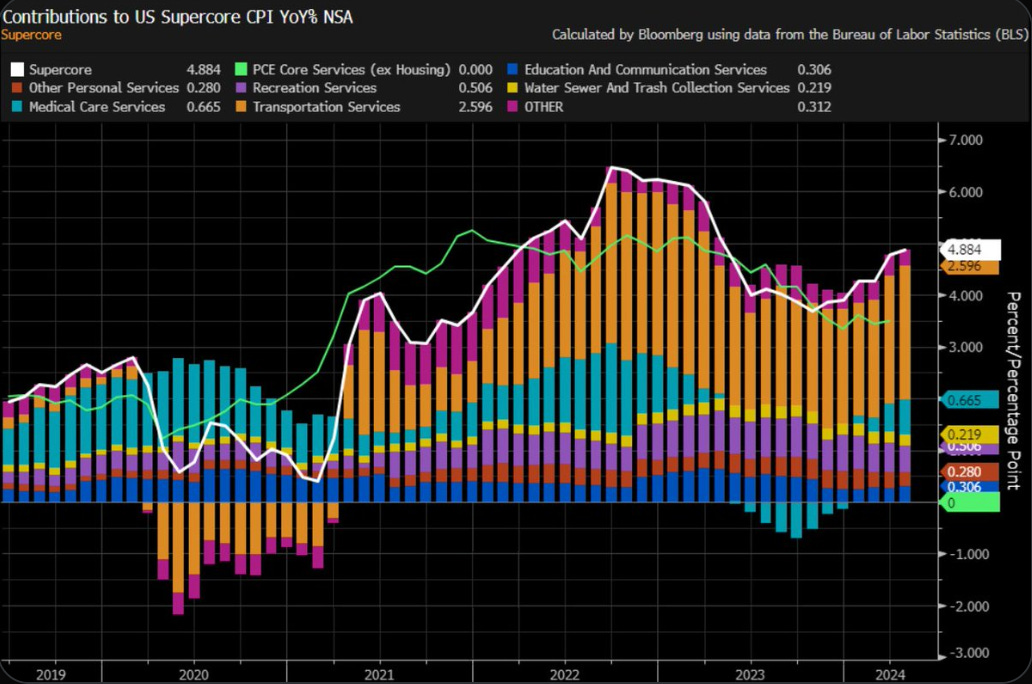
I prefer Bloomberg’s visualisation of the components contributing to the reading. Let’s break this down.
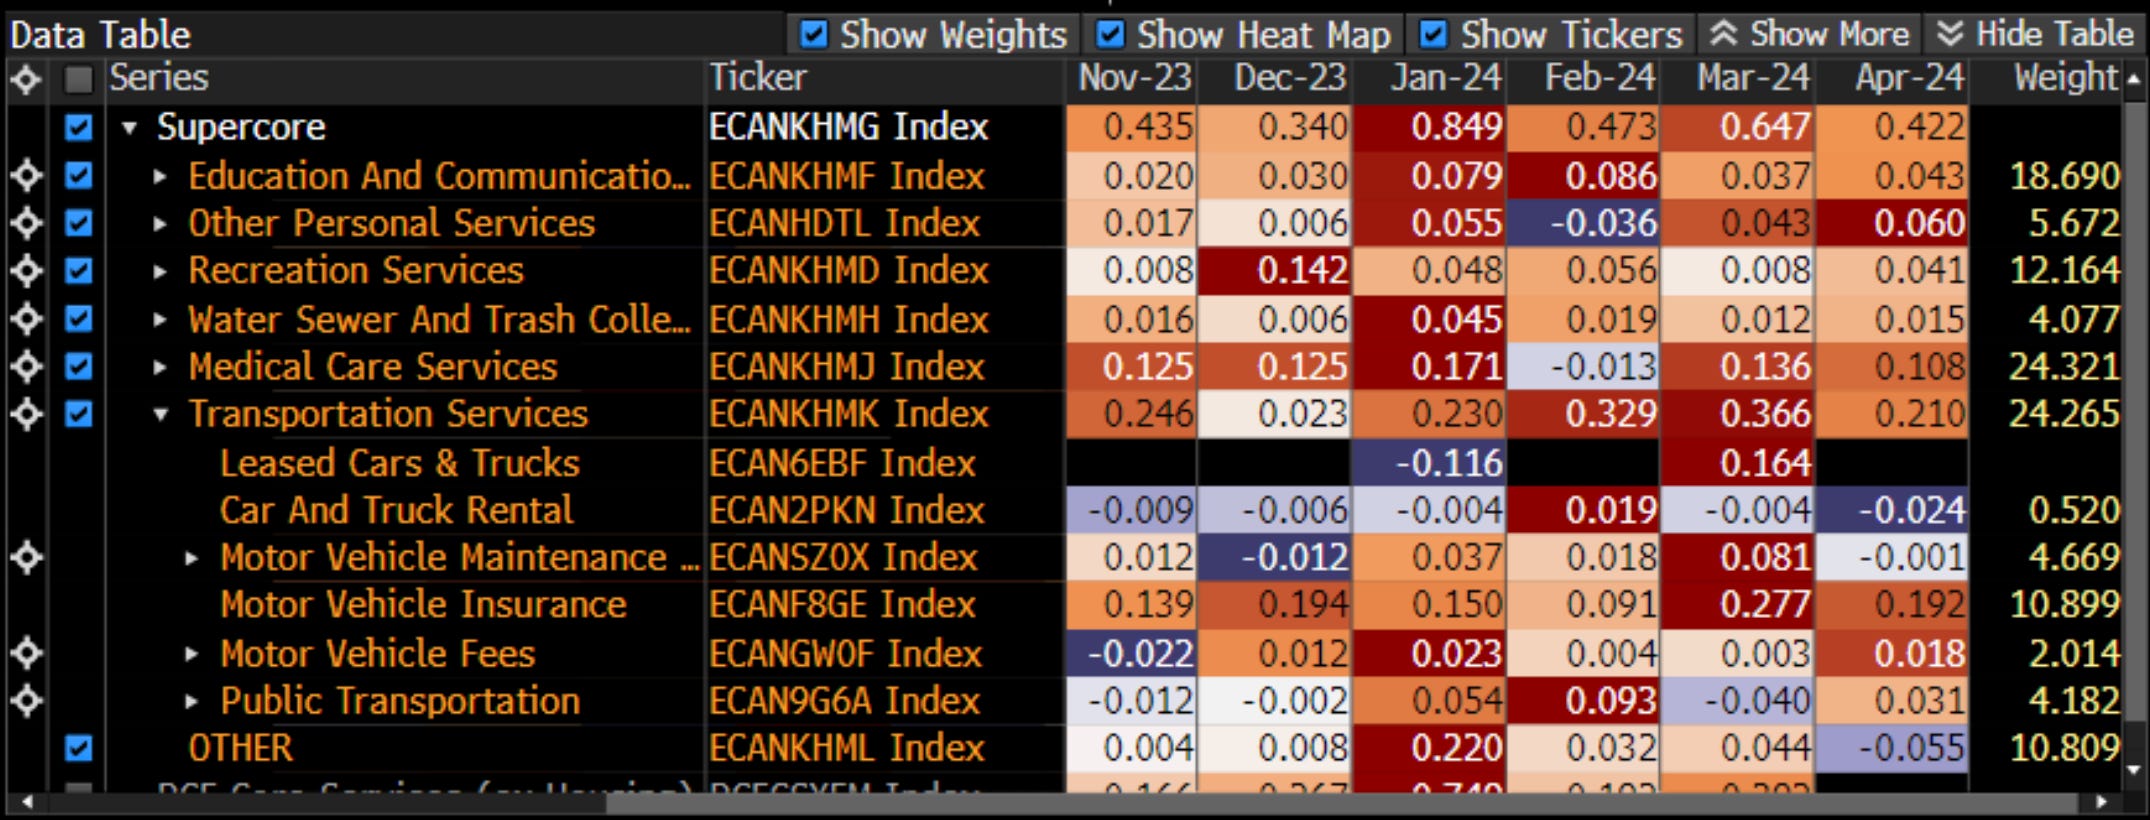
Since early 2022 right around the Russian invasion of Ukraine, the largest contributor to supercore inflation has been transportation services, which is currently responsible for over 50% of the 4.88% supercore inflation reading. Several factors have contributed to transportation services’ 2.6% inflation reading, the major influence as seen below has been the cost of motor vehicle insurance.
So, despite a “positive” inflation reading, the underlying signal of inflation is rather mixed as the YoY reading rose to 4.9% whilst the MoM reading slowed to 0.4% its lowest level in 2024. This week we also received PPI data which further adds to the mixed sentiment surrounding inflation as overall we have seen headline YoY & MoM inflation readings point to continued disinflationary trends.
As macro traders, we must always ask the question, what trade will support the current regime we’re in?”
Relatively sticky inflation, but slowing, modest growth in the U.S and a risk-on sentiment in markets.
The first idea is expressed through rates.
Bull Flattener
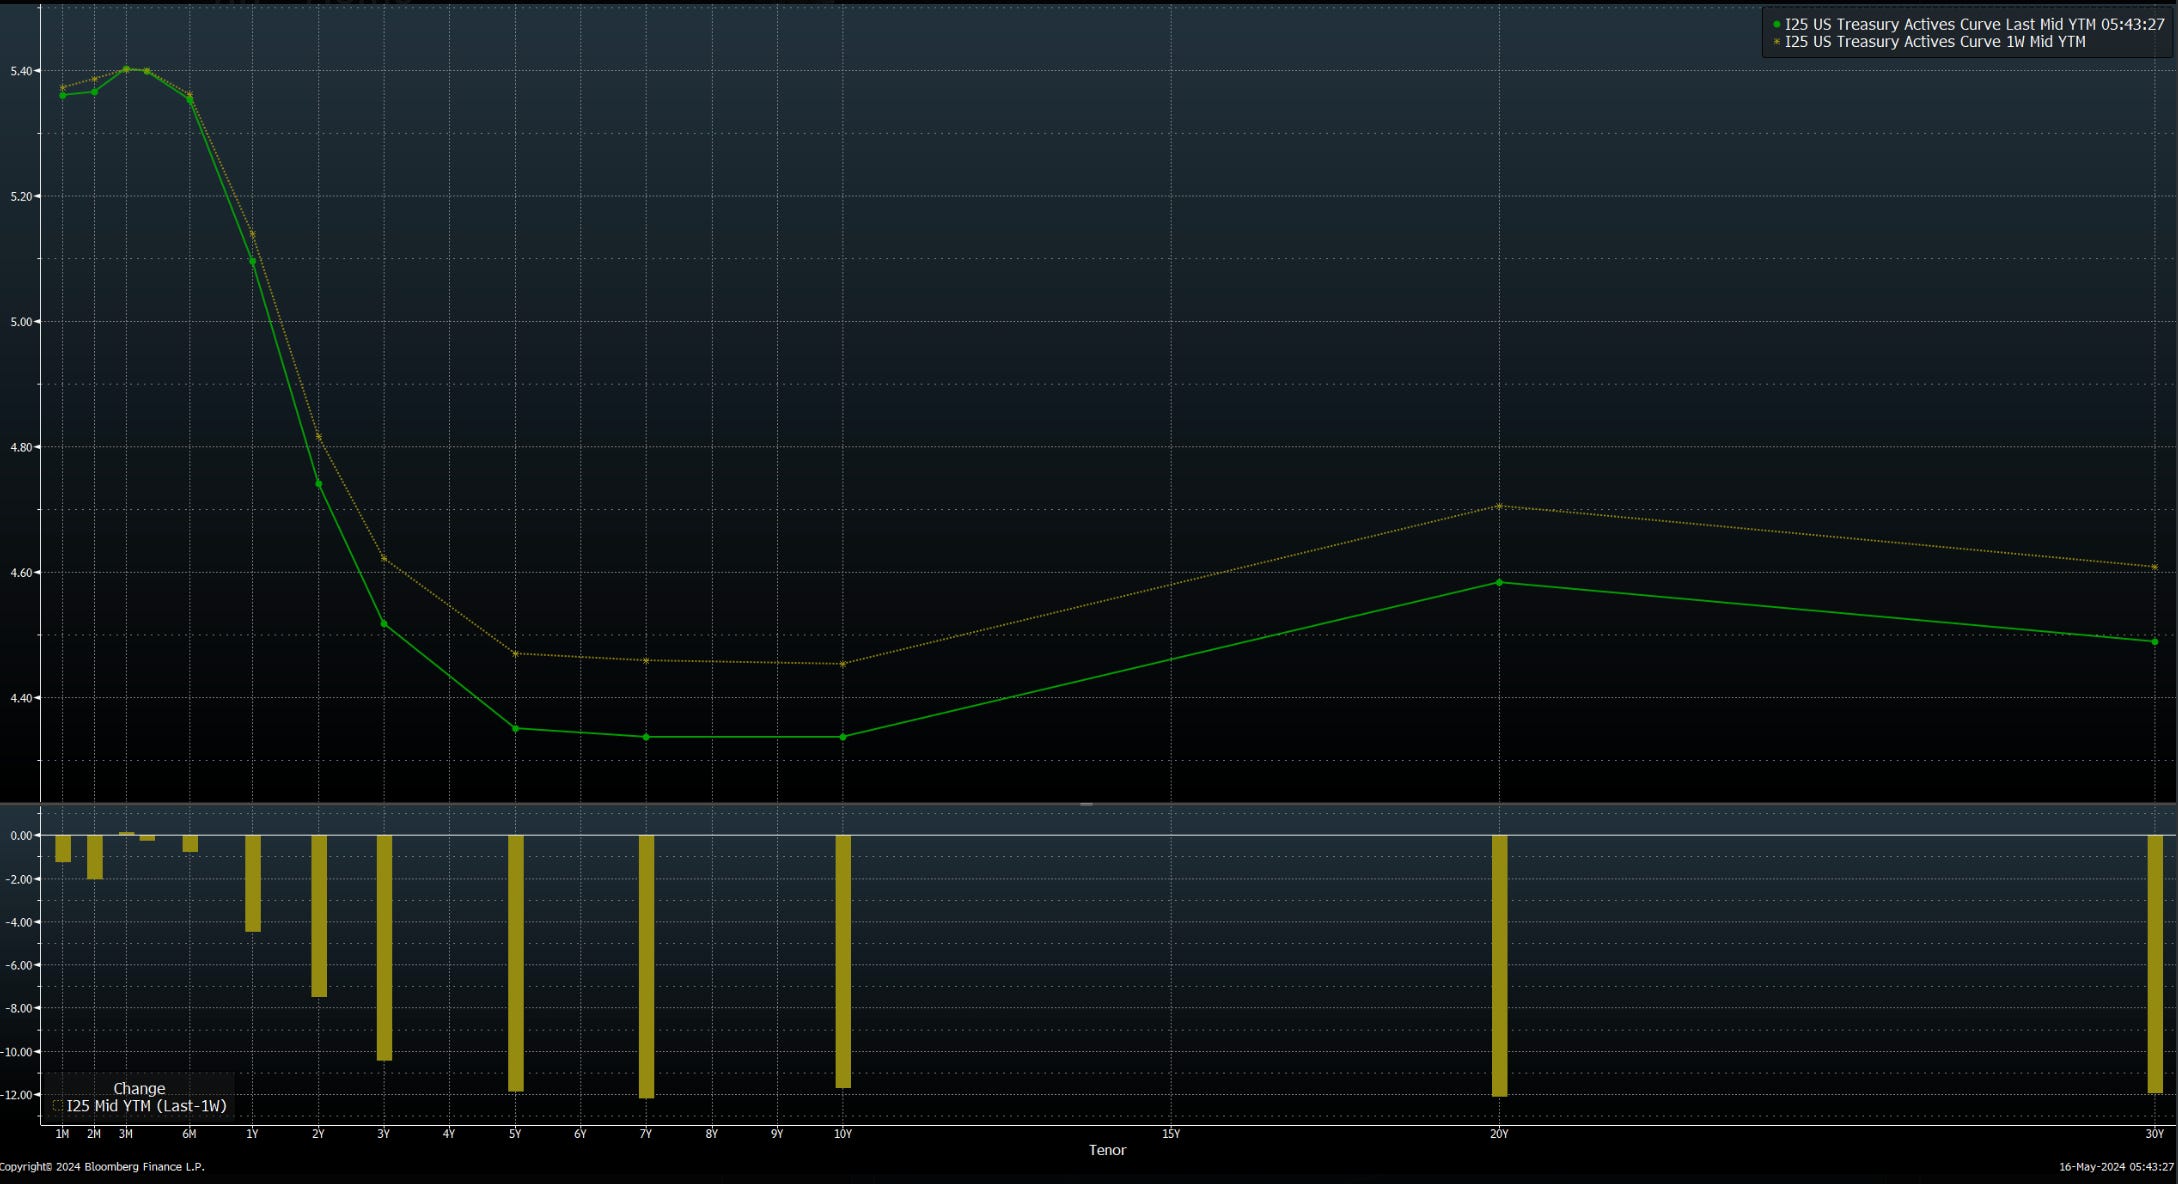
The green line represents the current yield curve, and the yellow line represents the yield curve from 1 week ago. What we’re seeing is a bull flattener (long-term rates falling more than short-end rates).
The bar graph below shows the change in bps of each tenure from one week ago. The long end of the curve experienced greater buying pressure as rates declined 12bps towards between the 10y - 30y, whilst the belly of the curve experienced fewer bids with rates declining between 8bps - 12bps on maturities between 2y - 7y.
This Treasury trade idea has been one I’ve discussed for the past few weeks as it still looks attractive to me given the current set of economic data we’re receiving and levels across the yield curve.
As I’ve broken down, the relationship between yields, notably the 2s, and the dollar is particularly close. As yields begin to experience bullish rates (lower yields) the dollar tends to let off steam. Expectations of two rate cuts have been put back on the market through Fed funds futures which have resulted in the dollar extending its decline.
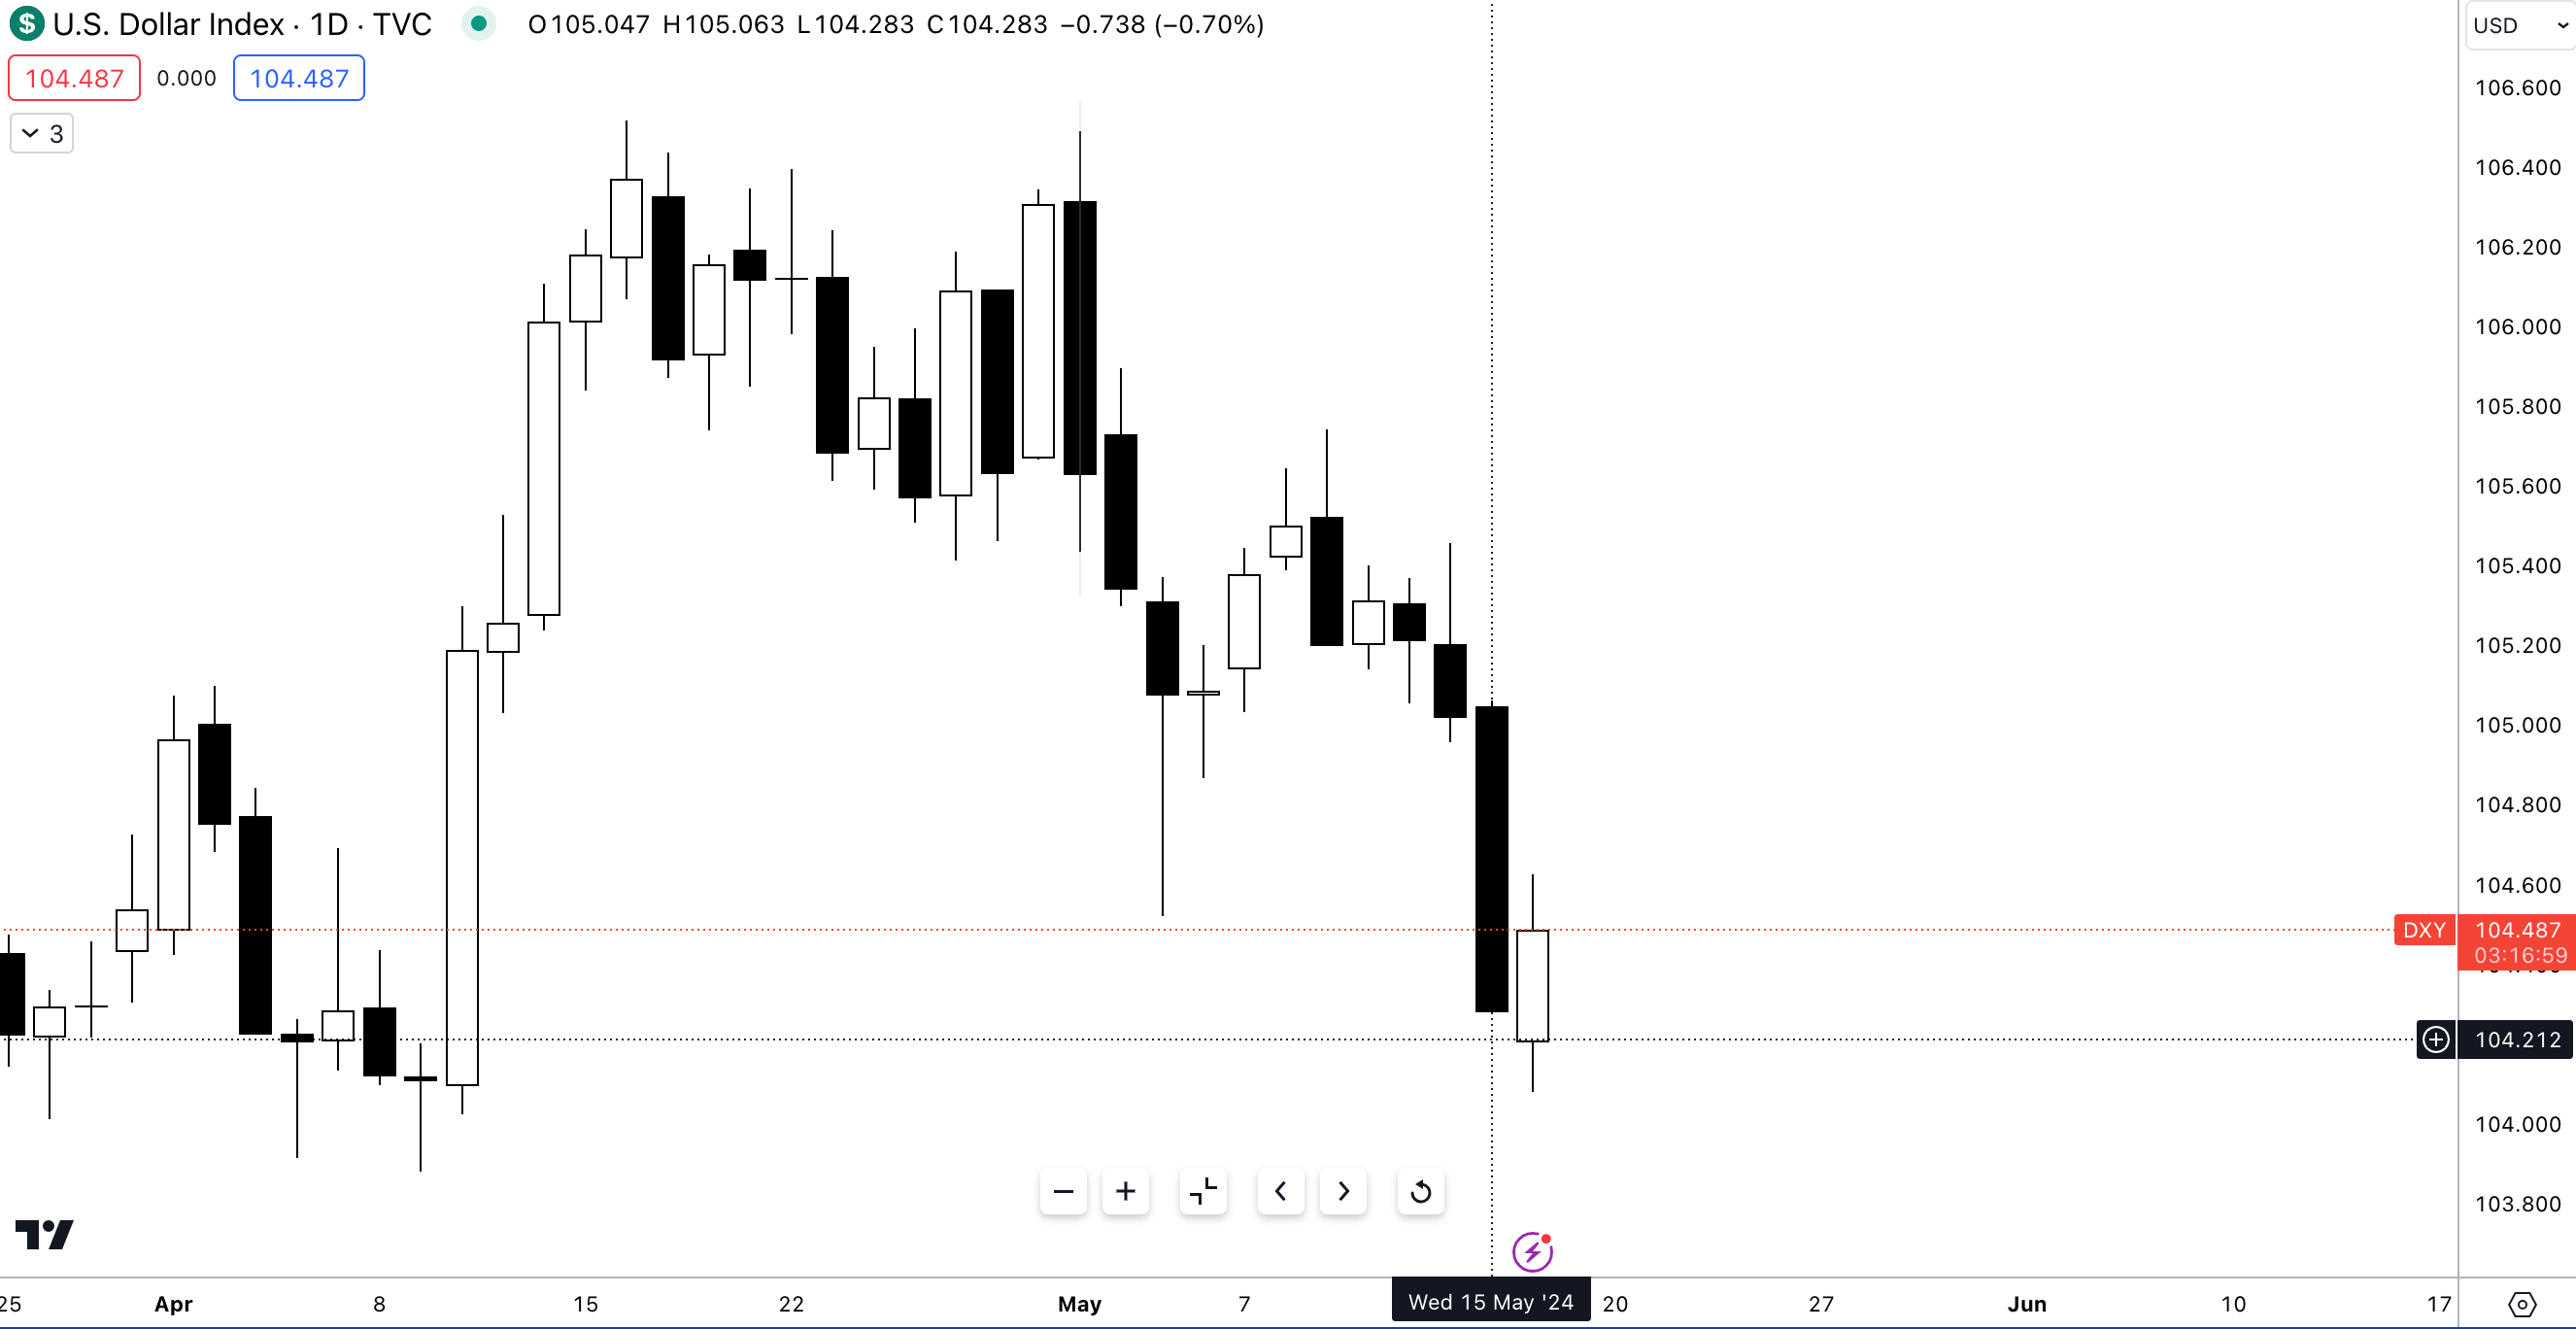
The sell-off in the dollar is providing a much needed relief for the Yen and Chinese Yuan.
This brings me to my next position.
Earlier this week I executed two positions:
Long USOIL
Long 10-year JGBs
While my long position in USOIL was stopped out amid Wednesday's sharp moves, my long JGB position is currently at breakeven.
On Monday the BOJ announced they would reduce the amount of bond purchases to around ¥425 billion. Due to the weakening of the Yen, the BOJ deemed it necessary to decrease purchases of government debt to normalise policy. Decreasing bond purchases will allow JGBs to offer higher yields attracting foreign investments which ultimately will boost their currency.
This trade, while relatively risky, is based on the premise that Japan's high level of indebtedness has created a fiscal trap. Allowing yields to rise above the 1% upper bound poses a significant fiscal challenge, as the cost of financing Japan’s debt would become increasingly burdensome Nevertheless, due to the mounting pressure for the BOJ to hike, which I place at a low likelihood, puts the BOJ in a situation to either:
Allow yields to increase, which could attract foreign investment and support the yen but at the risk of higher debt servicing costs.
Hike interest rates.
The choice will most probably be the one which inflicts the least amount of pain to the Japanese economy and financial market, meaning point number 1 is the least resistant pathway to protecting the Yen from further bouts of extreme volatility.
Post US CPI on Wednesday, the likelihood of the BOJ reducing purchases scheduled for today (Friday) drastically reduced as a softer print provided ground for the Yen to strengthen. As treasury yields declined the yield differential between USTs and JGBs narrowed reducing the pressure on the BOJ to scale back JGB purchases. Consequently, the BOJ maintained the volume of its bond purchases during today’s regular operations.
Looking ahead, I anticipate short-term buying in JGBs before the market starts questioning whether the BOJ will reduce bond purchases at the upcoming meeting on June 19th. At that point, I plan to gradually exit my long positions and consider short positions in JGBs, depending on the prevailing yield levels.
The Ministry of Finance (MOF) and the BOJ have recognized a fundamental flaw in their monetary policy. Attempting to stabilise the yen through currency interventions is just like fixing a broken pipe with a band-aid—ineffective and costly. The market has demonstrated that currency interventions alone cannot halt the carry trade, regardless of their size or frequency, making such interventions an unsustainable approach for the BOJ.
In summary, while the immediate strategy involves leveraging short-term opportunities in JGBs, the broader fiscal challenges and policy constraints will shape future market dynamics and require careful monitoring and adaptive positioning ahead and after the June 19th BOJ meeting.
Thanks for getting to the end of this report—I hope you took some value away.
I’ll look to do a breakdown of my oil views in a separate piece, today was a needed US inflation review and outlook on my JGB play. I’m working on a few more trade ideas that have legs to produce some alpha, so stay tuned for my next report.
Until next time