
So You Want To Trade Gold?
A composition of the fundamental macro drivers behind the yellow metal

Hey guys,
I’ve got to say.
I really enjoyed putting the first of these two piece together, I’ve watched gold over the years but never been someone to pay a huge amount of attention to the yellow metal.
So I spent the past week researching, reading, testing, and analysing different factors which affect Gold’s price movement.
This week’s edition will focus on common misconceptions, institutional allocation to gold, and key players within the gold market; the next piece focusing more on case studies relating gold price movements to macro.
So, without further adieu, lend me your attention:
Macro Drivers Behind XAU
Gold is the most traded precious metal in the world, used as a store of value by central banks globally, corporations and individual investors.
As we know, the gold standard was a monetary system in which the standard unit of a currency was based on a fixed amount of gold, meaning the currency’s value was backed by the underlying security being gold.
So before the world of fiat came about, gold was a form of monetary value, to save you the history of the gold standard, I’ll jump into the exciting part we’re all waiting for.
What is the purpose of gold in institutional portfolios?
As we all know, it’s the large institutions that drive major supply and demand dynamics markets, and that applies especially to gold. In order to understand what is driving the thinking of the top money managers investing in gold you must first get into their head and question their actions. The World Gold Council managed to do just that with this survey, which questioned 400 key decision makers at global investment funds to rank the reasoning behind their gold allocation.
The question asked was, what role does your gold allocation play in your overall portfolio?
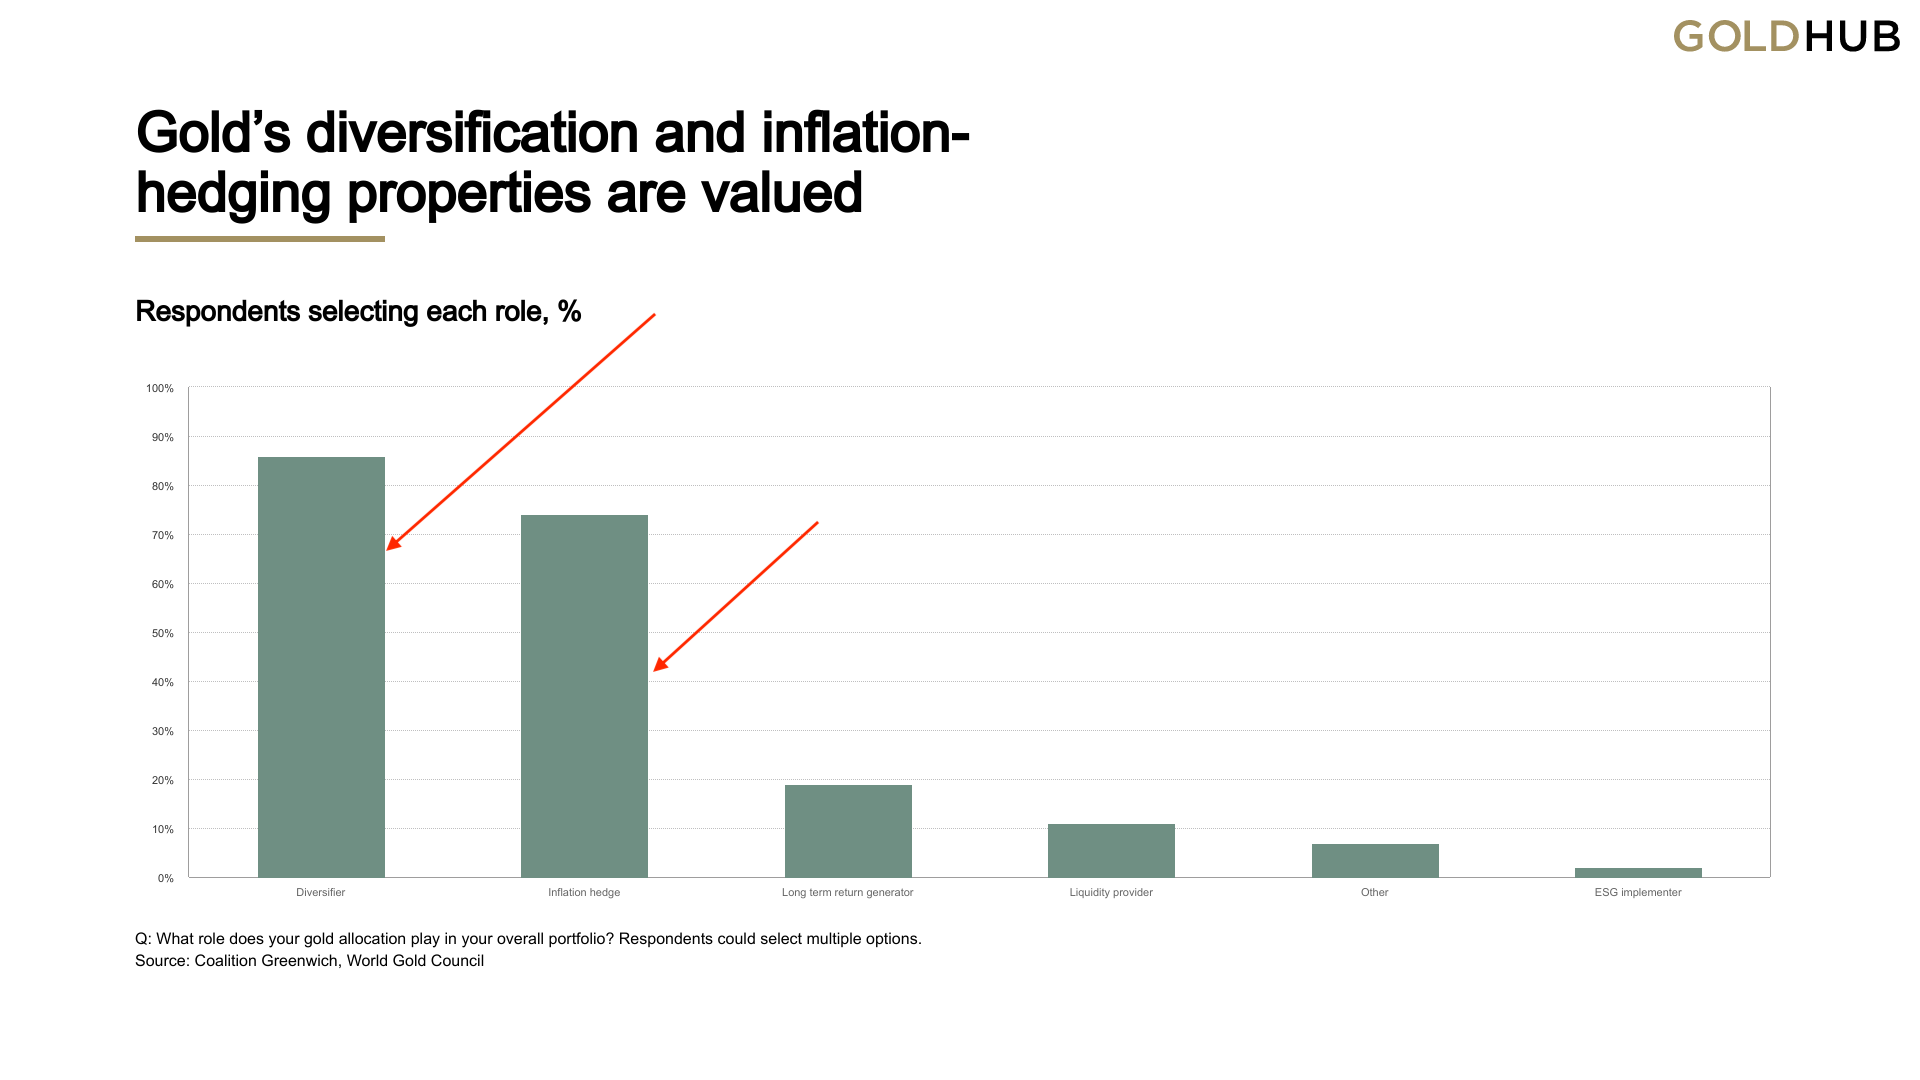
The two factors driving allocation to gold, weren’t because it was a pure alpha play, generating great returns but rather due to its diversifier and inflation-hedging characteristics.
So. That’s the decision-making of those institutions driving gold flows, you’re probably thinking; all I care is about trading gold, so does this matter?
Yes, hugely.
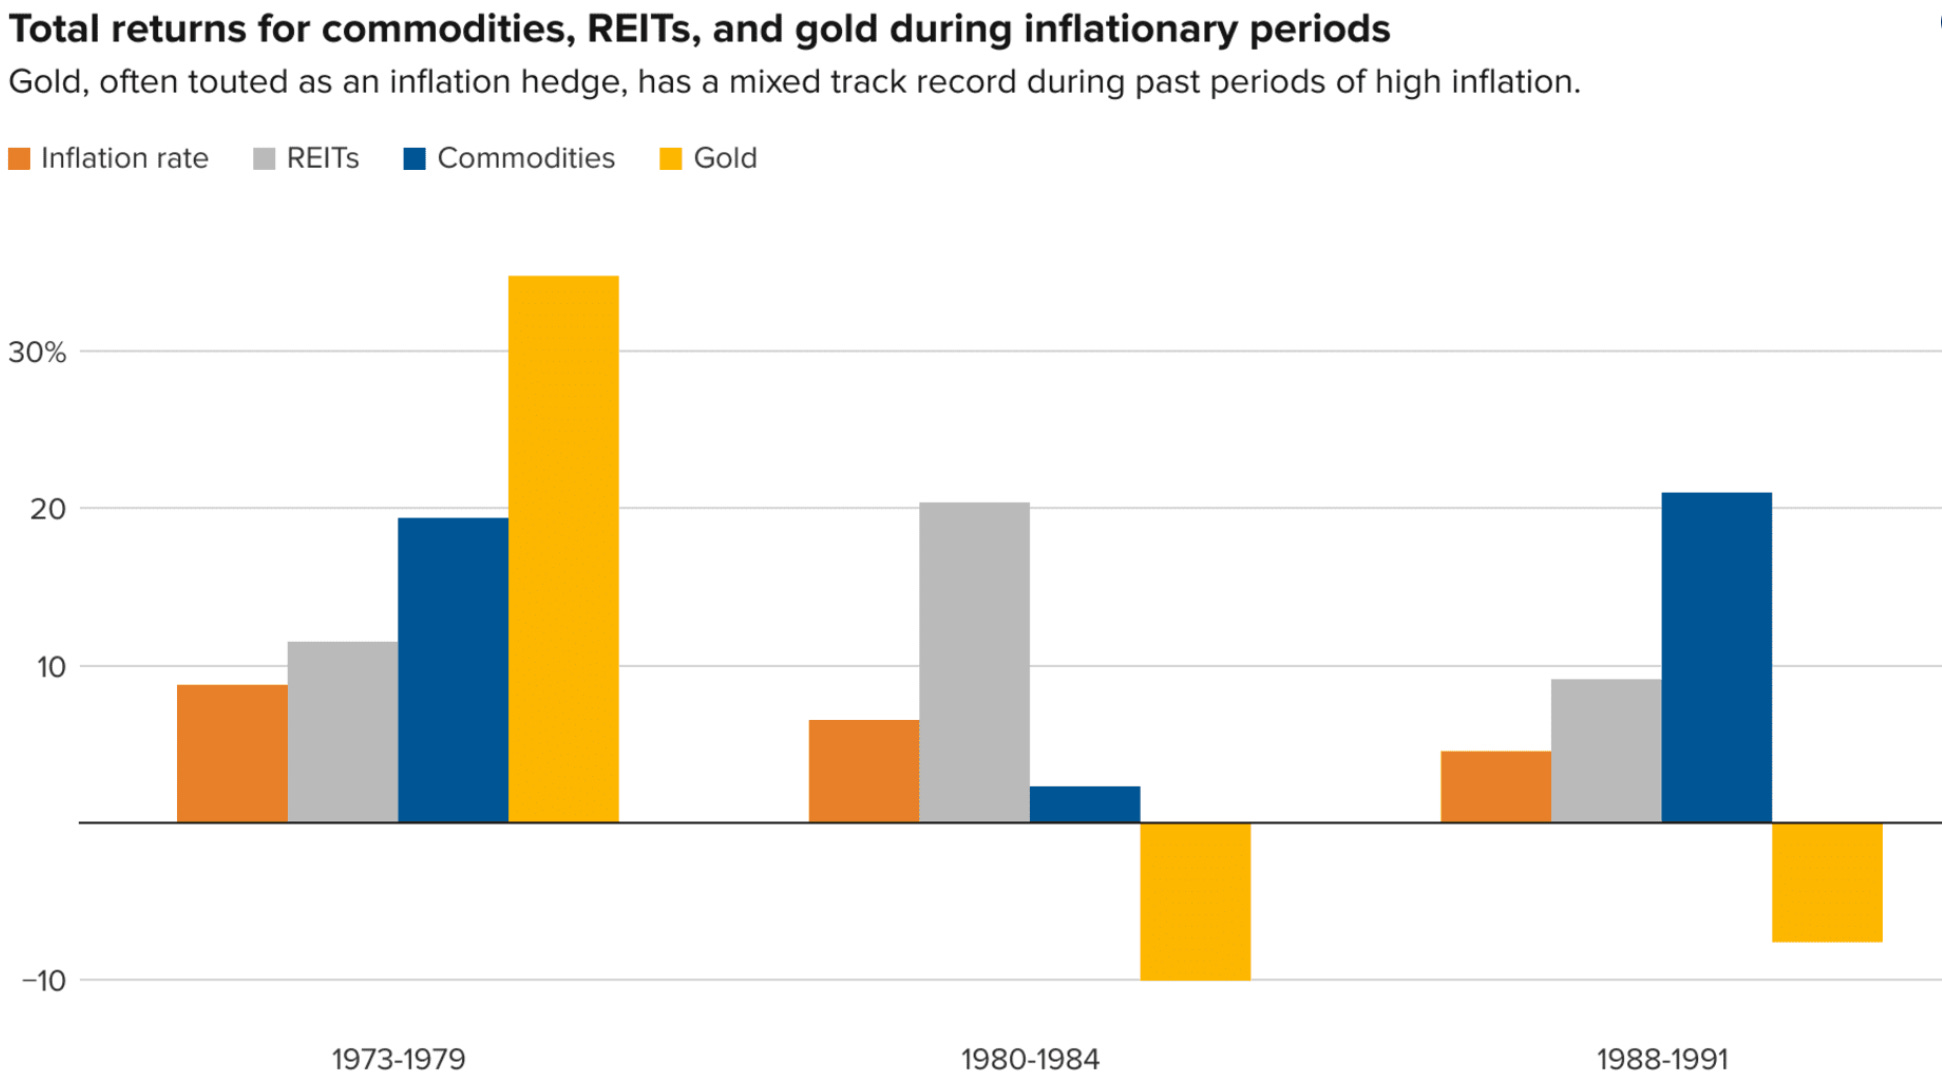
If you want to really specialise in a market you have to know every nuance about it. A very popular saying is that gold is seen as an ‘inflation hedge’ which isn’t entirely true, recently gold has fallen out of the inflation hedge regime.
The chart below puts that into perspective, the inflation of the 70s was mainly driven by an oil crisis within the U.S and the Vietnam War, the 80s inflation was relatively high, 4.8% but not as high as the 7.5% recorded in the 70s and the late 80s-early 90s inflationary period.
My consensus?
You cannot argue that gold doesn’t perform well in certain inflationary environments but neither can you argue that gold is the perfect asset allocation across inflationary periods; just looking back at the past few years 2022 gold returned 0.44% with inflation at 8.5% (-8.06% real return), in 2021 7.4% (inflation a real return of -0.1% and in 2020 31% return when inflation was only 1.2%.
So we can gather that in periods of already high inflation, gold tends to perform relatively poor, as seen across the figure above but mainly from 2021-23. On the other hand, during periods where inflation is low alongside global interest rates gold tends to perform well.
So what is the real inflation hedge according to the data?
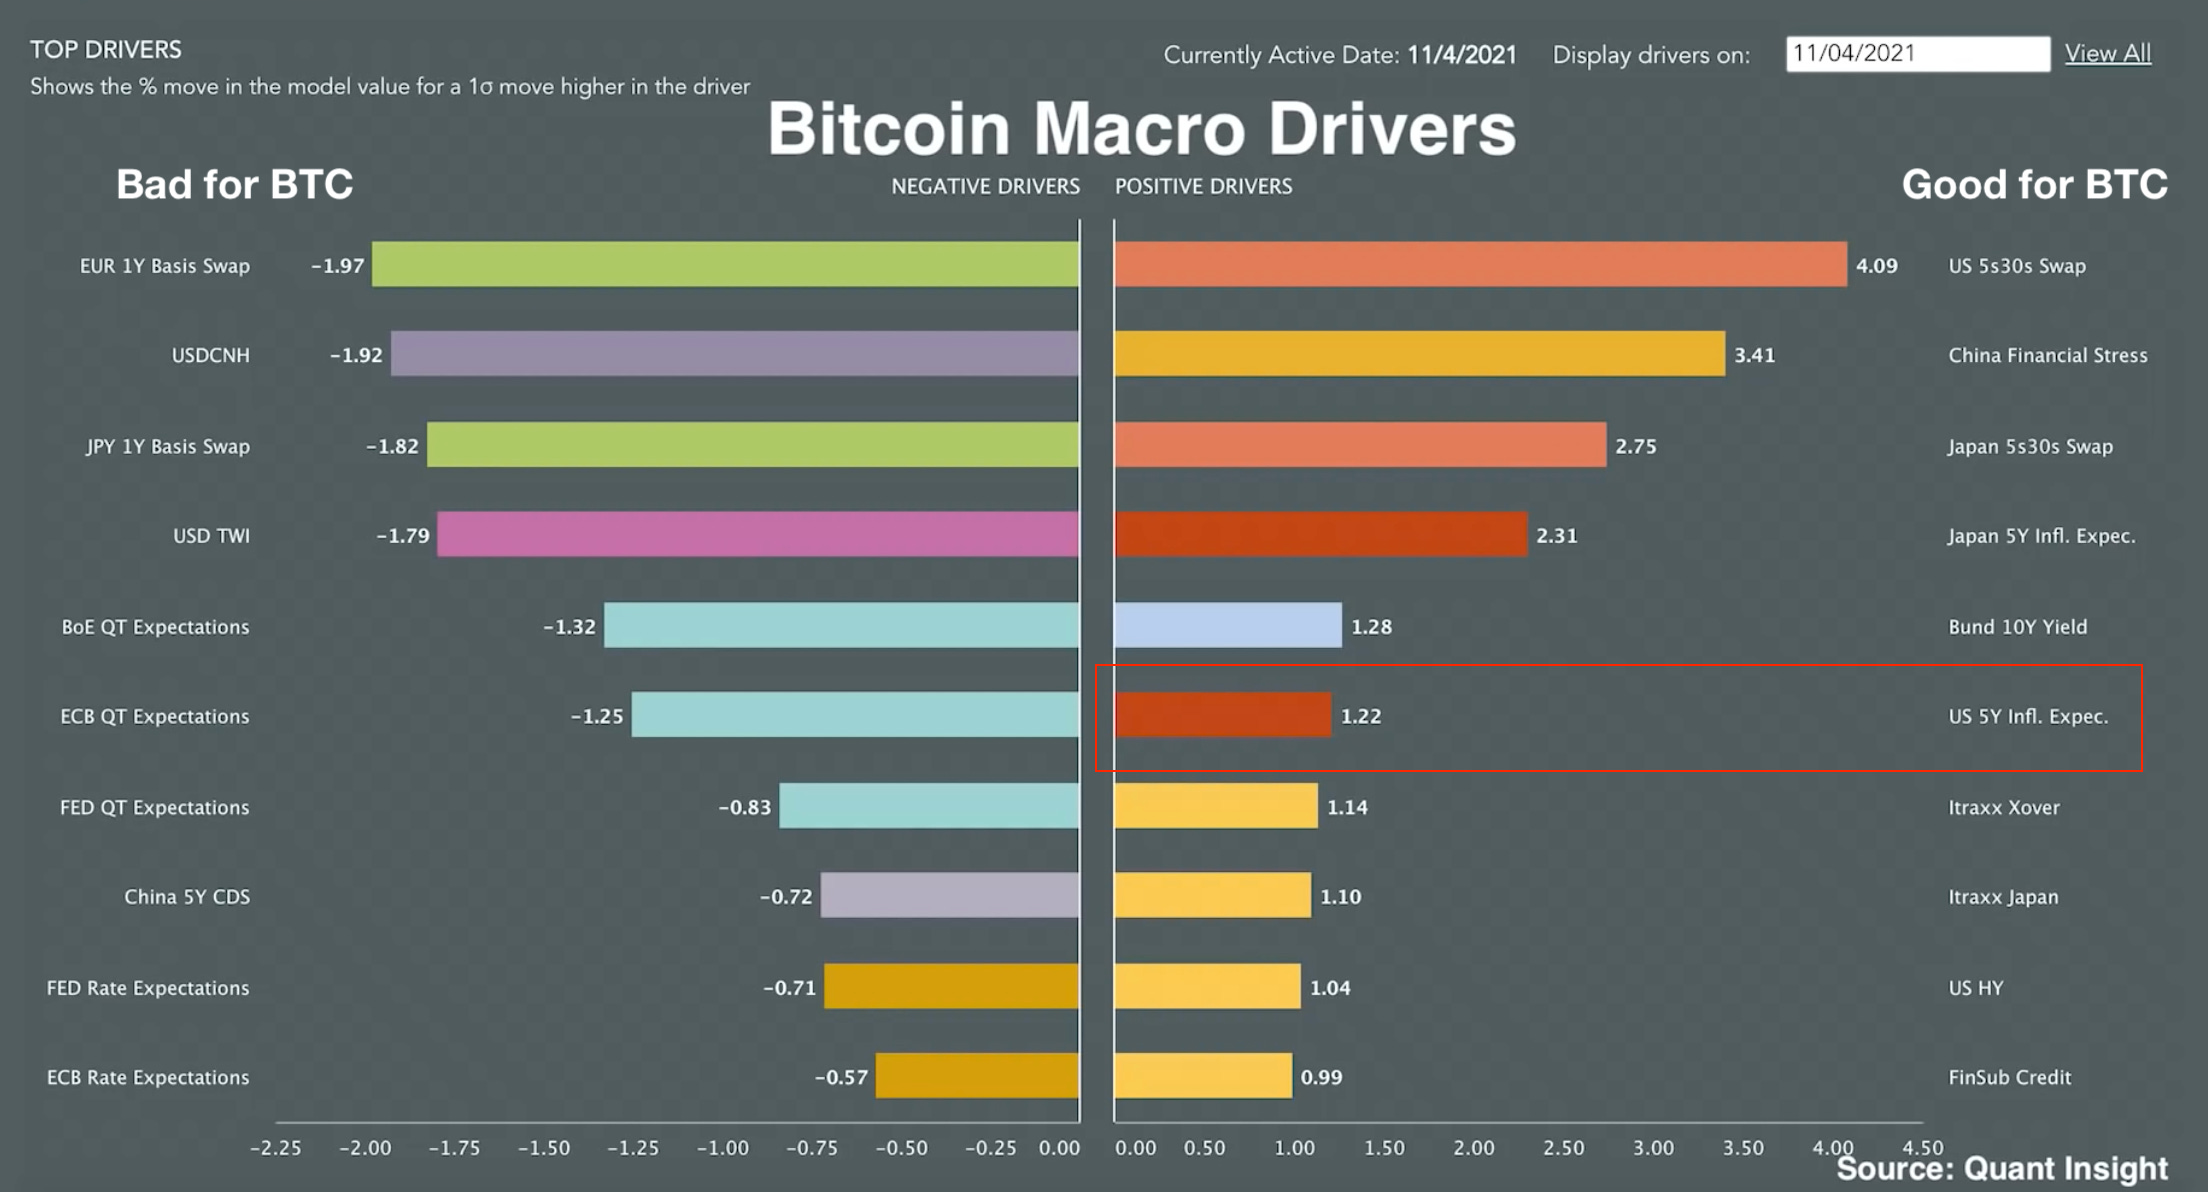
None other than Bitcoin.
The chart below provides a synopsis of the independent relationship between each of the macro components and the performance of Bitcoin.
The factors listed to the right are positive macro drivers for BTC, meaning that when any of these individual occurrences are in play, this has a positive impact on the price of Bitcoin, the opposite is true for the factors to the left, you can see that QT is clearly a negative driver of BTC. Whereas, the highlighted US 5Y inflation expectations, a forward projection of U.S inflation over the next 5 years, drive the asset price higher. So in an environment where future inflation is expected to continue climbing the price of BTC tends to perform well suggesting its positive relationship to inflationary periods.
Anyways, back to gold. The conclusion above was to clear up the ‘holy grail’ belief that gold is the go-to inflation hedge which isn’t so much of a fact anymore.
What can be said though, for certain, is that gold moves inversely with real interest rates (inflation-adjusted cost of money), as seen by the chart below.
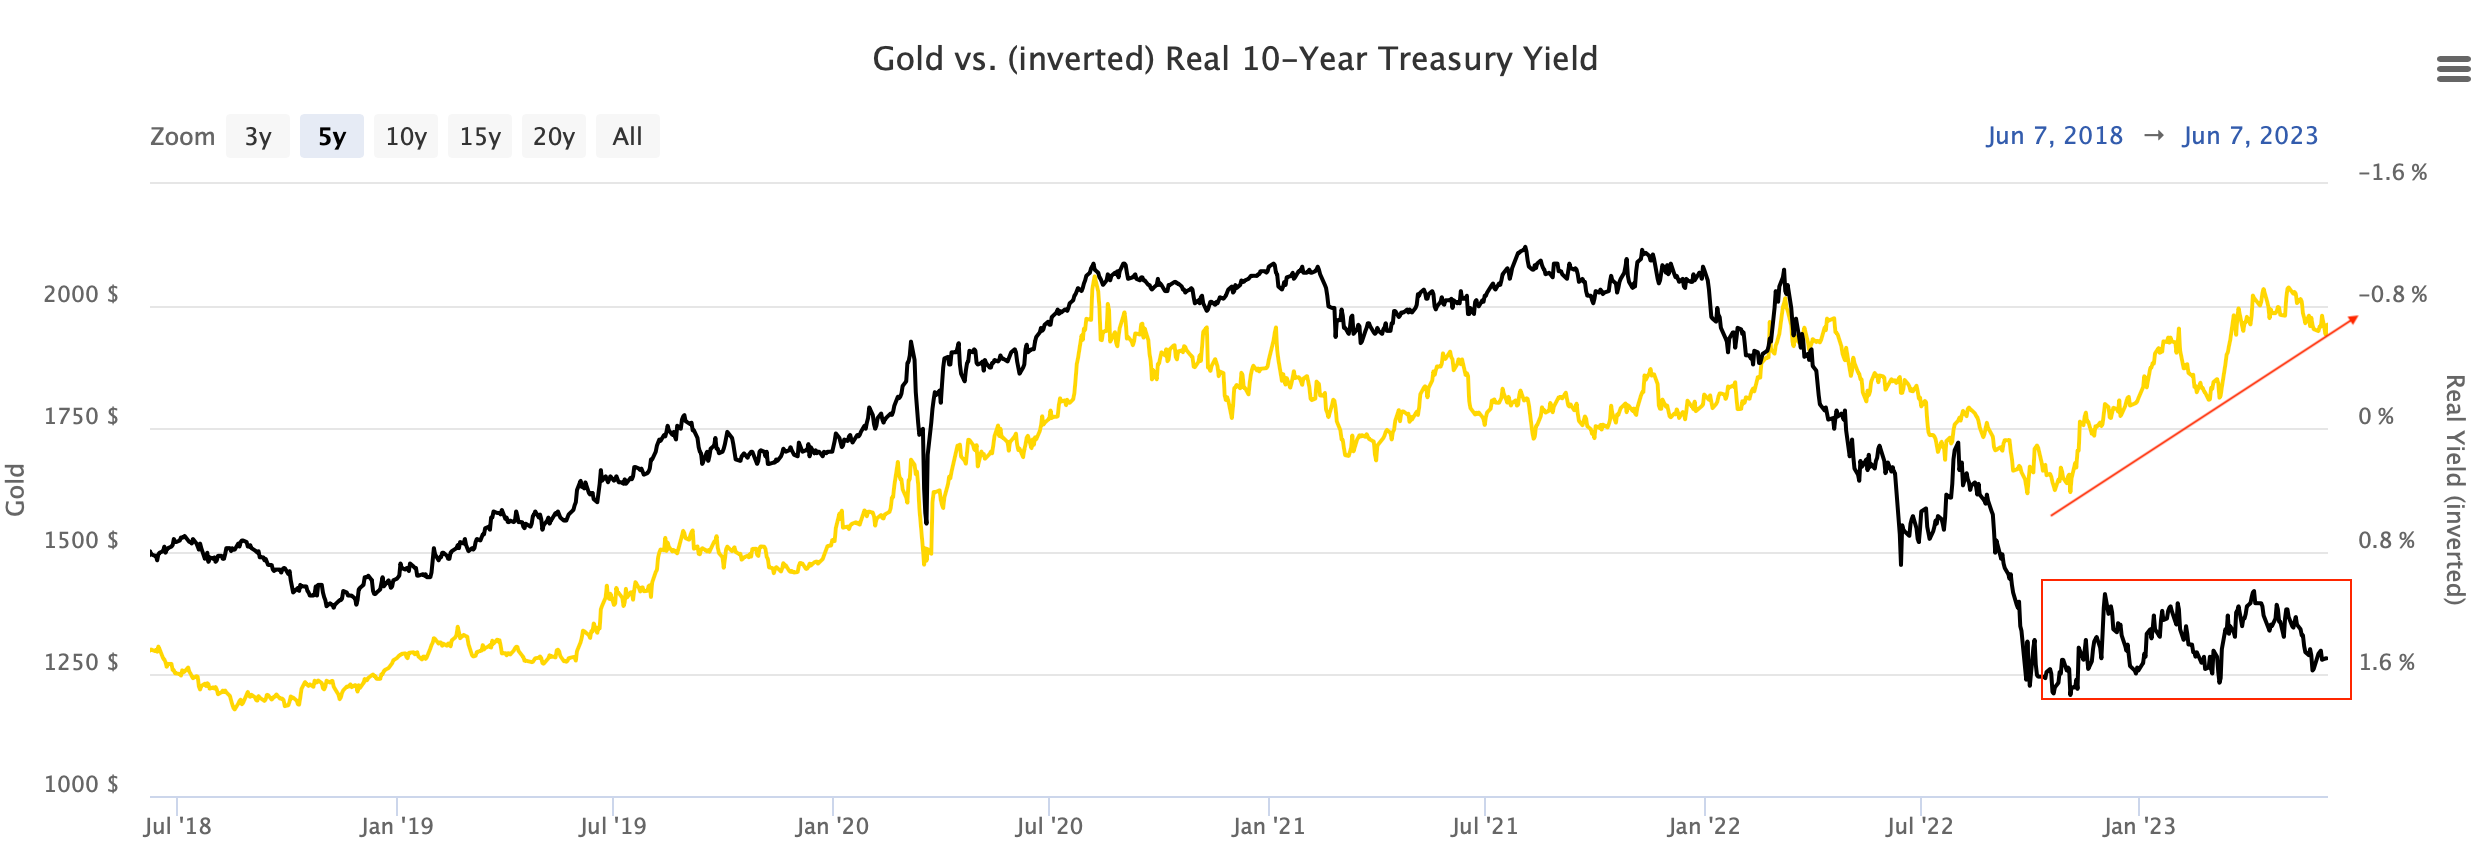
As you can see perfectly, from July ‘18, gold and the inverted real yields moved in lockstep, the lower real yields, the higher gold prices as seen by the LHS axis. When real yields consolidated between Jul ‘20 and Jan ‘22 gold price peaked around the $2000/per ounce level, and drawing near to the China re-open narrative in late 2022, as real yields consolidated in anticipation that a fully reopened China would drive increased gold consumption, that drove gold prices back towards the $1750 and $2000. FYI China remains the largest consumer of gold.
If you’re struggling to understand why the above relationship occurs, here’s a simple explanation.
Real rates represent the opportunity cost for holding the yellow metal, an asset which yields nothing. So the higher real rates are, the higher the opportunity cost for holding gold, so the lower price for gold.
So as a trader, you now are able to understand that in an environment where central banks are raising rates, you would want to be short gold on the higher long-term play, as that would be the predominant trend, seen in March 2022 when the Fed began their 16-month hiking cycle.
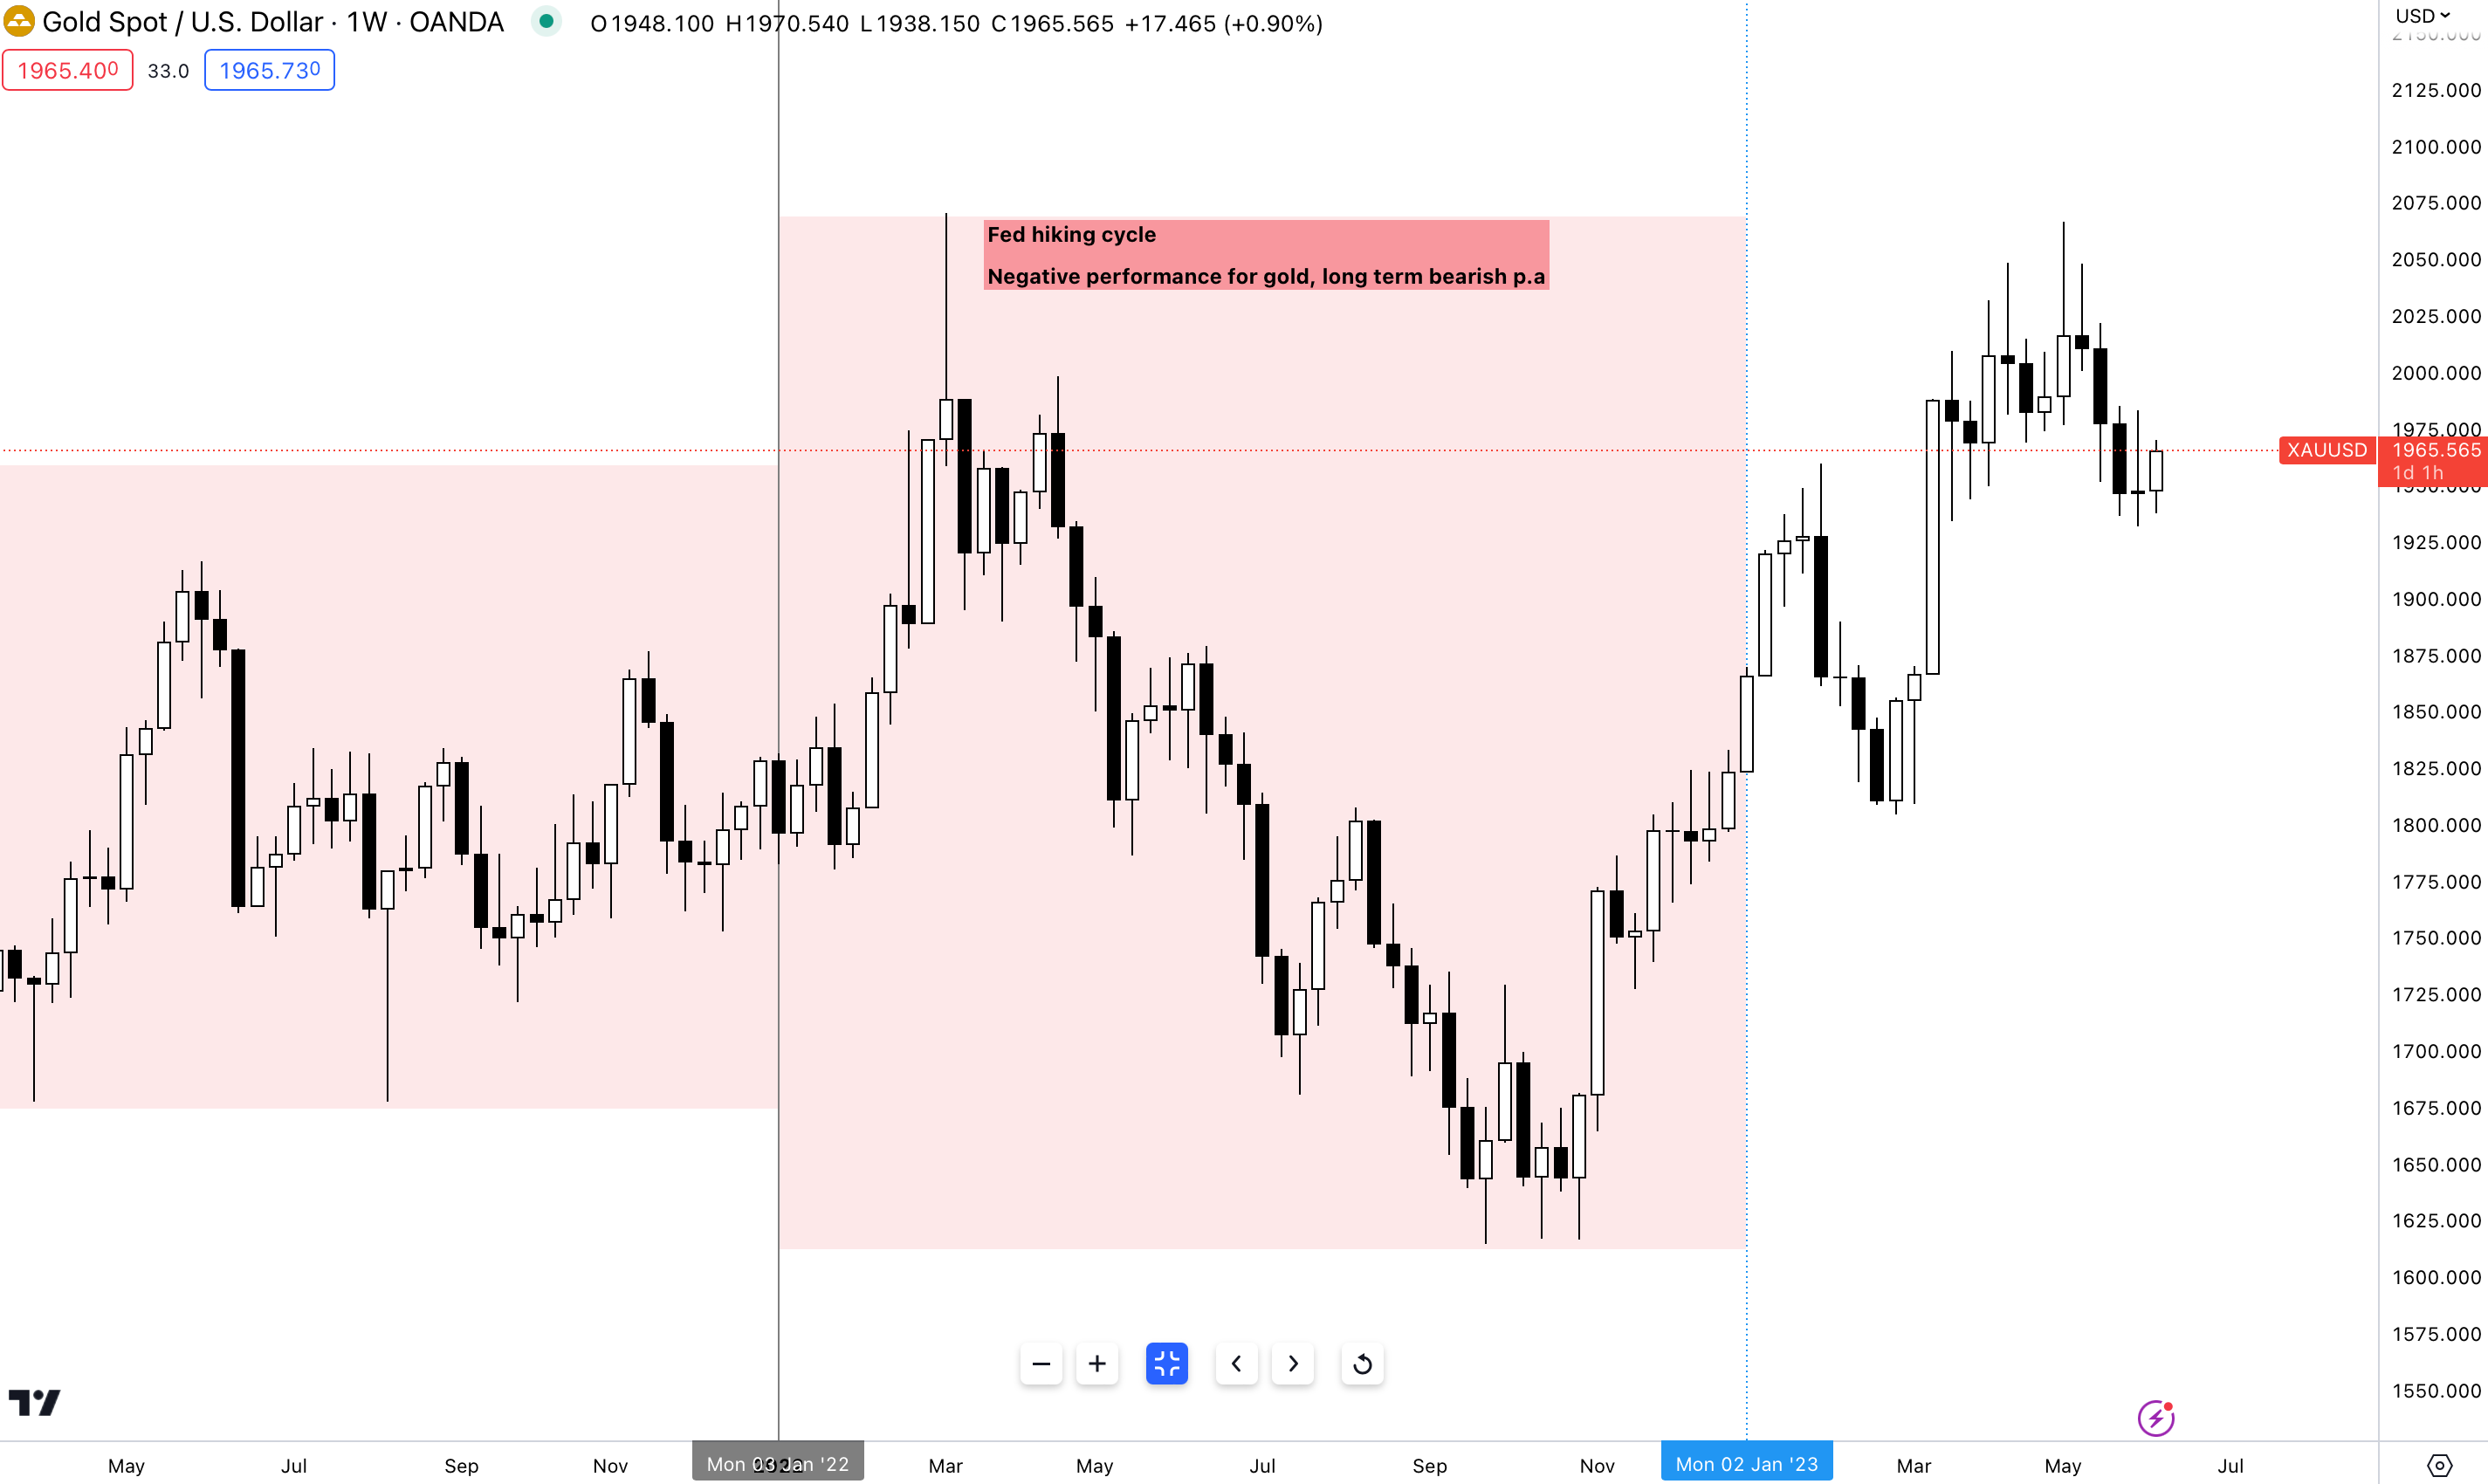
As you can see, the best trade throughout 2022 on gold was shorts, no matter how much of a reversal trader you may be, it would have made minimal sense to be long gold up until we had real rates consolidate and saw the buzz regarding the Chinese re-opening and saw structural breaks.
Who are the big players in Gold?
Central Banks - roughly 10% of central bank reserves are held in gold
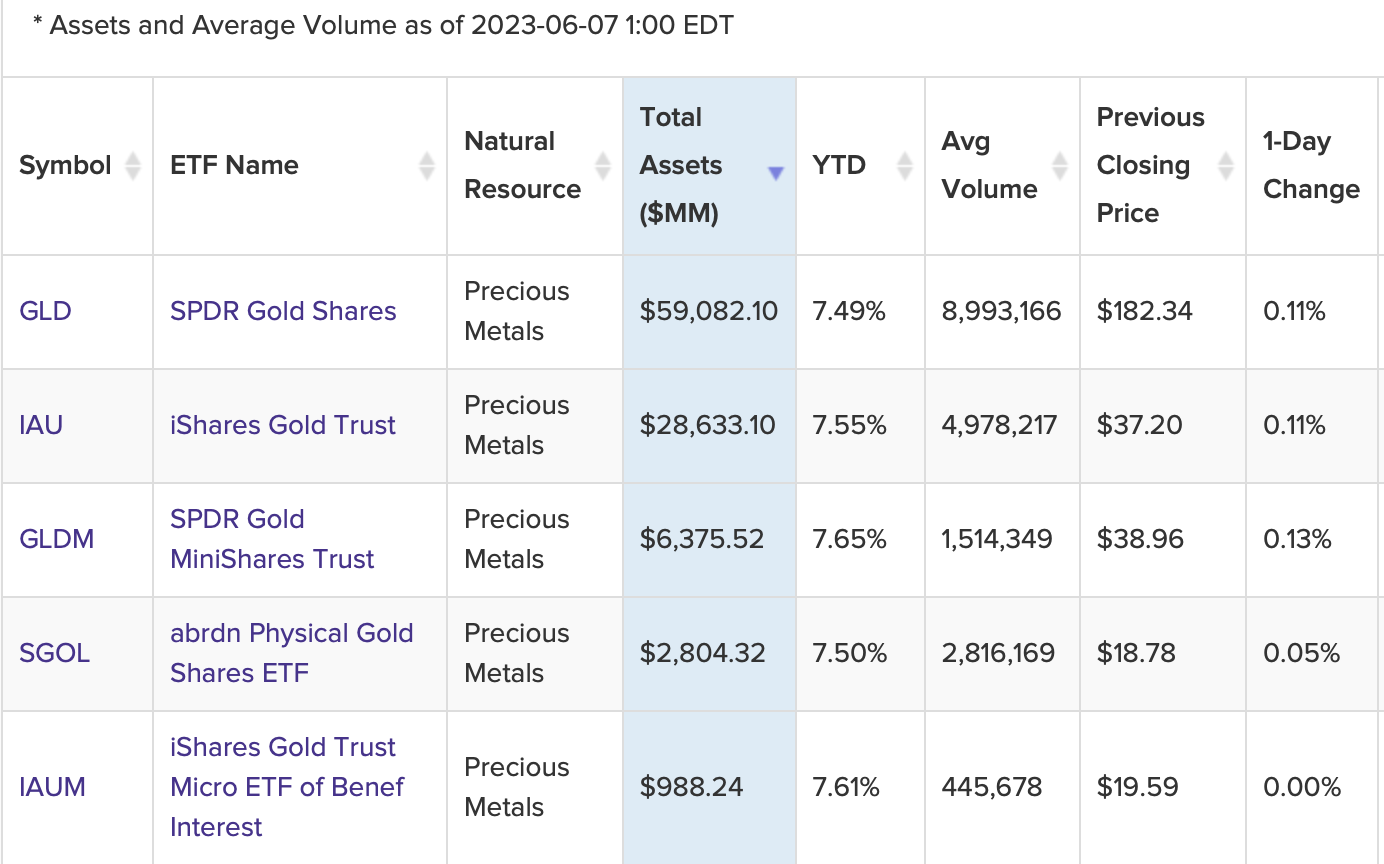
Gold ETFs (exchange-traded funds) e.g. seen below.

Largest Gold ETFs by AUM Gold Mutual Funds
Private investors - individuals and families
It’s always important to know who you're participating with when trading a specific market, and for the most part, that is central banks, ETFs and mutual funds.
The United States Department of the Treasury holds the largest amount of global reserves, 8,133.5 tonnes, followed by the Deutsche Bundesbank (Germany) and then Italy.
But one central bank stands out the most, and that’s the Central Bank of the Republic of Türkiye. In April, the Turkish central bank reserves declined by 71 tonnes in order to draw down its trade balance deficit, something I flagged up last week in my report on the reason behind Turkey’s weakening currency:
Lessons From The Turkish Lira Crisis

Hey guys, May was one heck of a month in markets. Speeches, debt ceiling, fear, volatility and risk— all at the same time. A beautiful war. Anyways, the TRY is a currency I’ve been following from afar as well as the Turkish macroeconomic policy, which happens to be one of the worst I’ve come across.
So, I hope now you’re getting the picture of:
What use institutions give gold within their portfolios
Who are the large players drawing in and out of the gold market
What macro factors and climates contribute to +/- gold performance.
That is the end of pt.1 covering gold from a macro perspective to give you a top-down view of the yellow metal and the key drivers behind it. We’ll be back covering some more case studies on gold as well as a few suggestions raised in the group discord.
I’m away next week celebrating my birthday, so I won’t be as active but I’ll show you guys what I’m up to in Greece!
Thanks for reading till the end, let me know your thoughts on the chat!