Say Goodbye To Any Hopes Of Financial Easing: Jackson Hole
Firstly, glad to be back.
Last week I didn’t want to write up some material that I knew wouldn’t provide the most value/insight into what has transpired across global markets, so I gathered some thoughts over the week for you guys today!
Let’s unveil the Jackson Hole meeting. Now if you don’t already know what this is, the Jackson Hole event is an annual economic policy conference compromising of major central bank members, policymakers, academics & economists from around the globe. They convene to discuss economic issues, implications and policy options; if you ask me, it’s the most important economic event held each year.
Earlier this week I was reading a note by Macro IQ and came across this great explanation of why we’re seeing financial conditions loosening even whilst ‘tightening’ monetary policy
“The whole point of 75 bps increases is to tighten financial conditions. Each time Jay Powell has raised rates, ironically, he has eased financial conditions because of his unwillingness to acknowledge the Fed is prepared to take the country into a recession in order to eliminate the inflation scourge”
— Bill Ackman Hedge Fund Manager, Pershing Square Capital
Now take a look at Chart 1 for confirmation. And if you need reminding remember when the U.S Government decided to change the definition of a recession? Sounds like you’re trying to leave the elephant in the room unannounced if you ask me…
For those who are frequent readers of Market Macro Hub, you’ll already be fond of this index by now. I tend to look it at frequently to gauge how financial conditions are reacting in real-time as this reading is updated weekly to keep up to date with rapid changes in asset markets.
If you’re new to this index let me quickly explain:
The National Financial Index provides a weekly insight on financial conditions in money markets, (liquid securities <1-year tenure, e.g FX, T-bills & commercial paper), debt & equity markets also traditional & shadow banking systems.
The idea is that when the national financial conditions index is positive (greater than 0), this is historically associated with tighter-than-average financial conditions. And when the national financial conditions index is negative, historically this is associated with looser-than-average financial conditions.
So back to Chart 1; as Bill Ackman correctly said even though the Fed has been going through back-to-back rounds of tightening at each monetary policy meeting; one question remains. How is it that conditions are still materially weaker?
A very simple question to answer, retracing Jay Powell’s comments and U.S equity market performance there’s a clear alignment between his dovish comments and what most deemed either the “bottom” of the equity slump or a “bear market rally”.
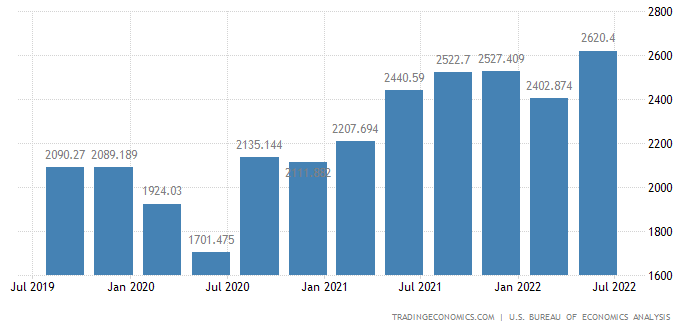
Now, combined with strong corporate earnings, shown in Chart 3, comments from Jay Powell such as the below is a major influencer on markets:
“I guess I'd start by saying we've been saying we would move expeditiously to get to the range of neutral. And I think we've done that now. We're at 2.25 to 2.5 and that's right in the range of what we think is neutral”
— Fed Chair Jay Powell
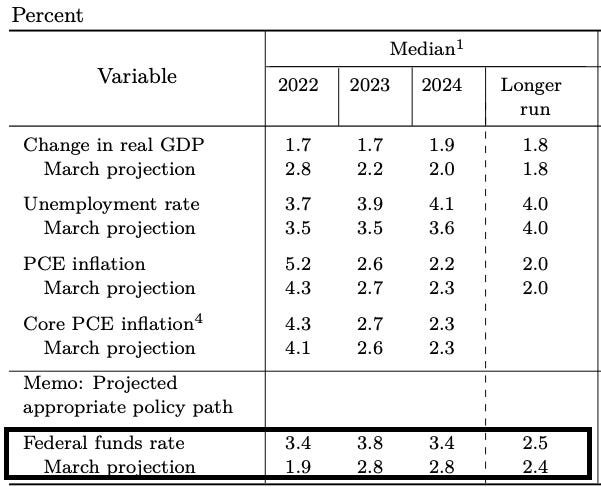
Now let’s hold on just a minute, if you recall the Fed’s SEP (Summary of Economic Projections) we can see that the long-run interest rate expectation is 2.5%, however, to say we’re at the neutral rate when inflation is 8.5% and expected to increase this fall is what really gave risk-assets and investors wind in the sail to pick up meme stocks, crypto and other high risk/high beta investments.
So, from the Jackson Hole meeting, Jay Powell made it very clear that the Federal Reserve will not make the mistake of stopping the tightening cycle too early and will continue to press ahead with large hikes. We can now look forward to the potential of a 75bps hike at the next Fed meeting in September.
What does this mean for equities and other risk assets?
I see equities falling back into a bear market/sluggish performance & the appetite for risk-reducing drastically. Just by observing Chart 1, we can see the major contributors to the easing in financial conditions have been the increased access to credit and leverage, both of which are heavily affected by how the Fed is positioned towards future growth and inflation.
There are a few other fundamental readings that stay on my radar when it comes to observing where we’ve been and where we’re headed in the macro picture:
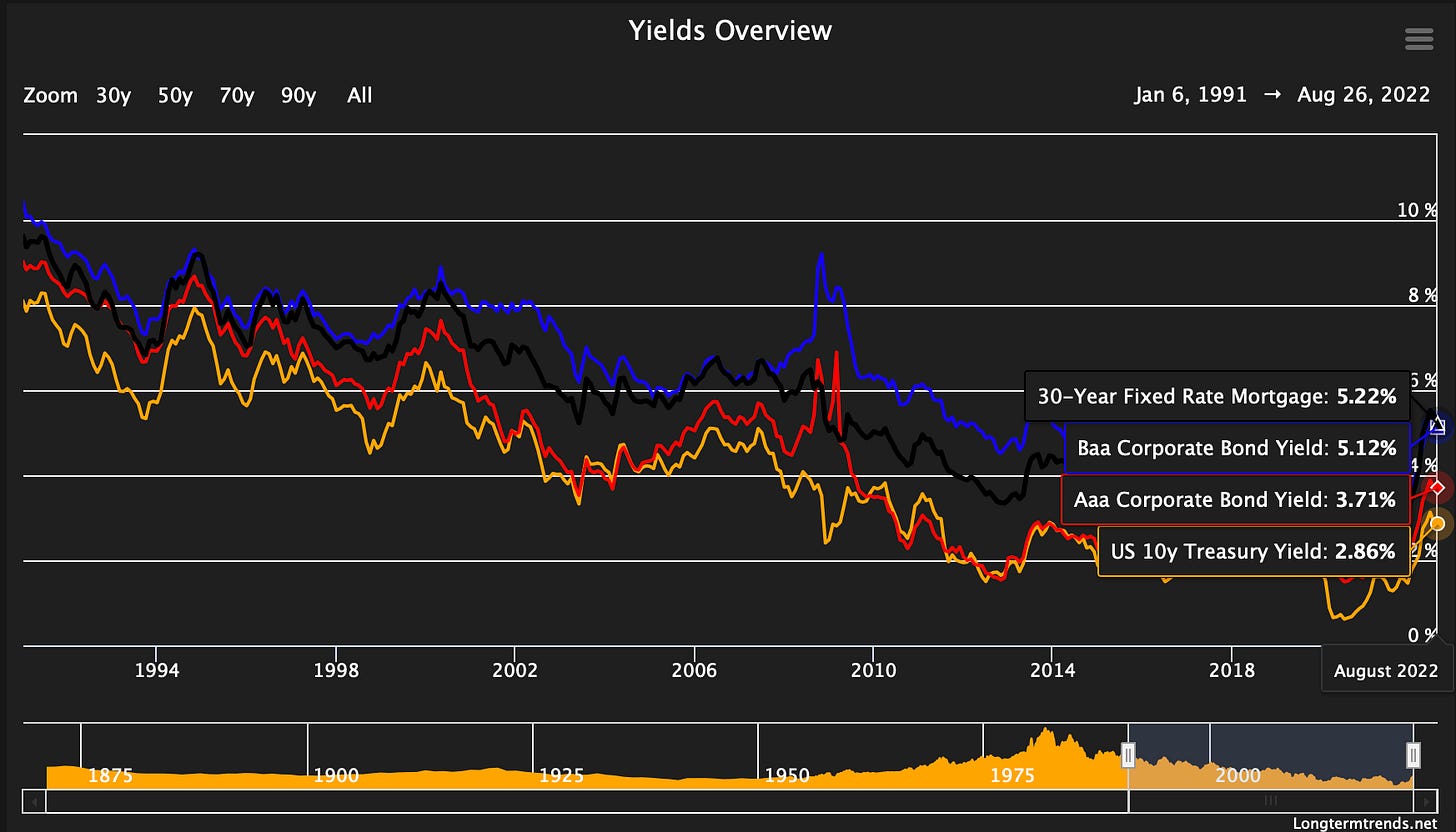
Yield curves are one of the most important readings I look at, mainly because everything is derived from where the yield curve is. Say you want to get a mortgage from the bank; where do you think they get the rate of interest from?
Treasury yields.
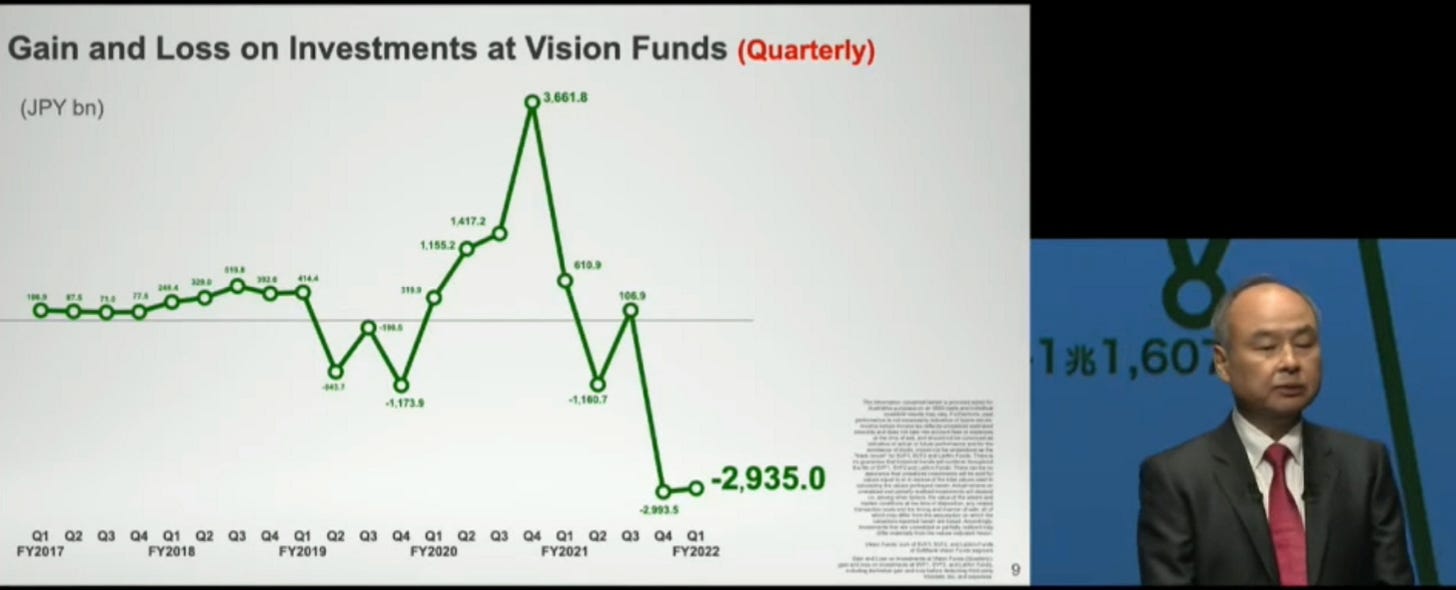
The same applies to investors, pension funds, and private market participants in the VC & Private equity markets. If yields are relatively low, investors’ risk appetite is heightened since there’s little real gain when adjusted for inflation, investing in government debt. So they may expand their horizon to look at corporate debt or even riskier investments i.e, a VC investing heavily in multiple startups. Something we saw over the past 2 years, has come back to bite a few large names notably Softbank’s Vision fund which lost $23.4 Billion.
The point is, in a world where everything revolves around the ease of access to credit, where we bring forward tomorrow’s purchases to today, make sure to keep an eye on how things are lining up.
Looking forward as the Fed and major G7 countries begin to accelerate their quantitative tightening process the effect we will see on yields is likely going to be a curve flattener as investors will price in the scenario of global growth demising completely, demand destruction, and elevated food & energy price pressures during a recession. You’re probably thinking why would this cause yield curves to flatten? It’s straightforward, as investors price in further rate hikes leading to a recession, the front-end of the yield curve will steepen due to investors' anticipation of higher rates in the short term. On the long end of the yield curve, investors will now price in lower interest rates due to the expectation that the economy will be recovering from a recession, meaning low growth and productivity, requiring monetary policy to be accommodative/loose until we enter the next business cycle.
The next thing is to look for a trade opportunity, upon building further confirmation of this playing out. Of recent, we’ve seen some good trades play out in the market, particularly longs on the dollar (UUP ETF), an ETF that longs the USD and goes short against G10 Basket. YTD returns roughly 13%, seems like the saying is true. When all else fails, turn to the dollar, simple yet effective.
I’m going to list a few other fundamental indicators that I’ll touch upon in later pieces and that you should be keeping an eye on. Readings covering home sales, home building, construction spending, labor market, raw commodity prices, manufacturing/ISM readings, credit spreads &retail sales. Without getting to intricate and moving into the more complex readings like OIS Swaps and other readings, these key fundamental readings are the bedrock of building that narrative we all desire in the market.
That’s enough info from me today, I’ll be posting articles every Tuesday and Friday moving forward! So look forward to some consistency.
As always thanks for reading until the end — Until next time
Joe - MMH


