
Positive Data Boosts Risk Assets

Uk unemployment figure reaches 3.7% vs 3.8% expected
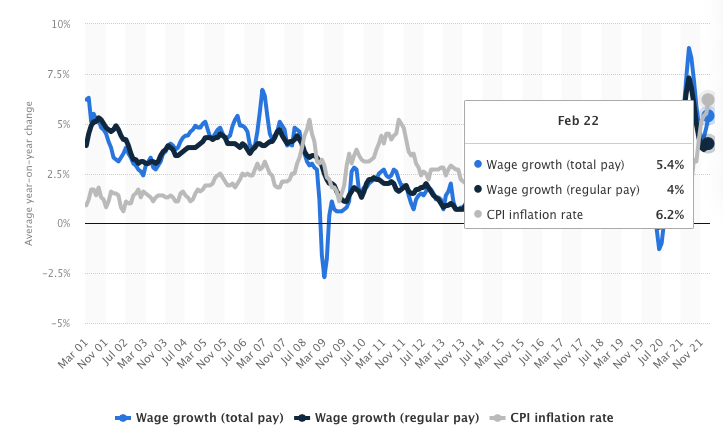
Wage growth vs CPI growth
There’s still strength in the U.S consumer with positive retail sales
U.S markets gain on economic optimism
Lowest Uk unemployment figures
It’s been a while since we have heard anything positive from the UK, with recent messages relaying around an income squeeze, energy crisis and fears of stagflation within the economy at hand. Today we took a look into the health of the labour market which fared the test well with unemployment coming in at 3.7% vs 3.8%, the lowest levels seen since records began.

Uk’s stock index, FTSE rallied just under a percent as positive data from the UK lifted sentiment. From ‘22 year highs the pound has suffered a depreciation of more than 11% shown below as concerns surrounding Russia-Ukraine, energy prices and out of hand inflation in the Uk led to an outflow from the risky sterling.

As much as I want to believe good times are ahead for the Uk, this really is just a small highlight for a sinking ship. The BoE is expected to hold back on further monetary tightening for now as three back to back hikes haven’t hindered inflationary pressures, this leads directly into my next point.
Wage growth vs CPI. Data coming out yesterday showed UK average earnings+bonuses grew by 7.0% YoY in March. Now, for the month of March, the ONS recorded a CPI reading of 7%, side note, the real figure is actually higher than that, showing that overall there was no true increase in personal income across the UK, rather wage growth managed to keep up mostly in the financial sector which contributes most for bonuses.
For February the graph below shows wages lagging behind inflation.
U.S Markets
The major U.S indexes closed yesterday higher as data on retail sales beat the 0.4% forecast by a small margin topping 0.6%. Powell reinforced his optimism that the market and economy were strong enough to withstand the tightening in liquidity as the Fed battle soaring inflation figures.
U.S treasuries were subdued below 3% with little demand for havens; there’s one thing I’ve got my eyes on, it’s consumer credit and defaults. In Q1 2022 U.S household debt level increased by $266 billion (1.7%), largely led by mortgage balances, in line with seasonal adjustments credit card debt levels decreased by $15 billion however compared with 2021 Q1 levels, credit card debt is still $71 billion higher.
If you’re here till the end I appreciate you! Thanks for all the support and feedback, things are just getting started