


Before we get into it, don’t forget I built 25 FREE indicators, a primer course, academic paper stack and a macro console for you all here:
![[FREE] Market Macro Hub Education & Resources](https://substackcdn.com/image/fetch/$s_!MImG!,w_140,h_140,c_fill,f_webp,q_auto:good,fl_progressive:steep,g_auto/https%3A%2F%2Fsubstack-post-media.s3.amazonaws.com%2Fpublic%2Fimages%2Ffc166b60-c6b2-4353-885d-f9da9ec034da_1200x630.png)
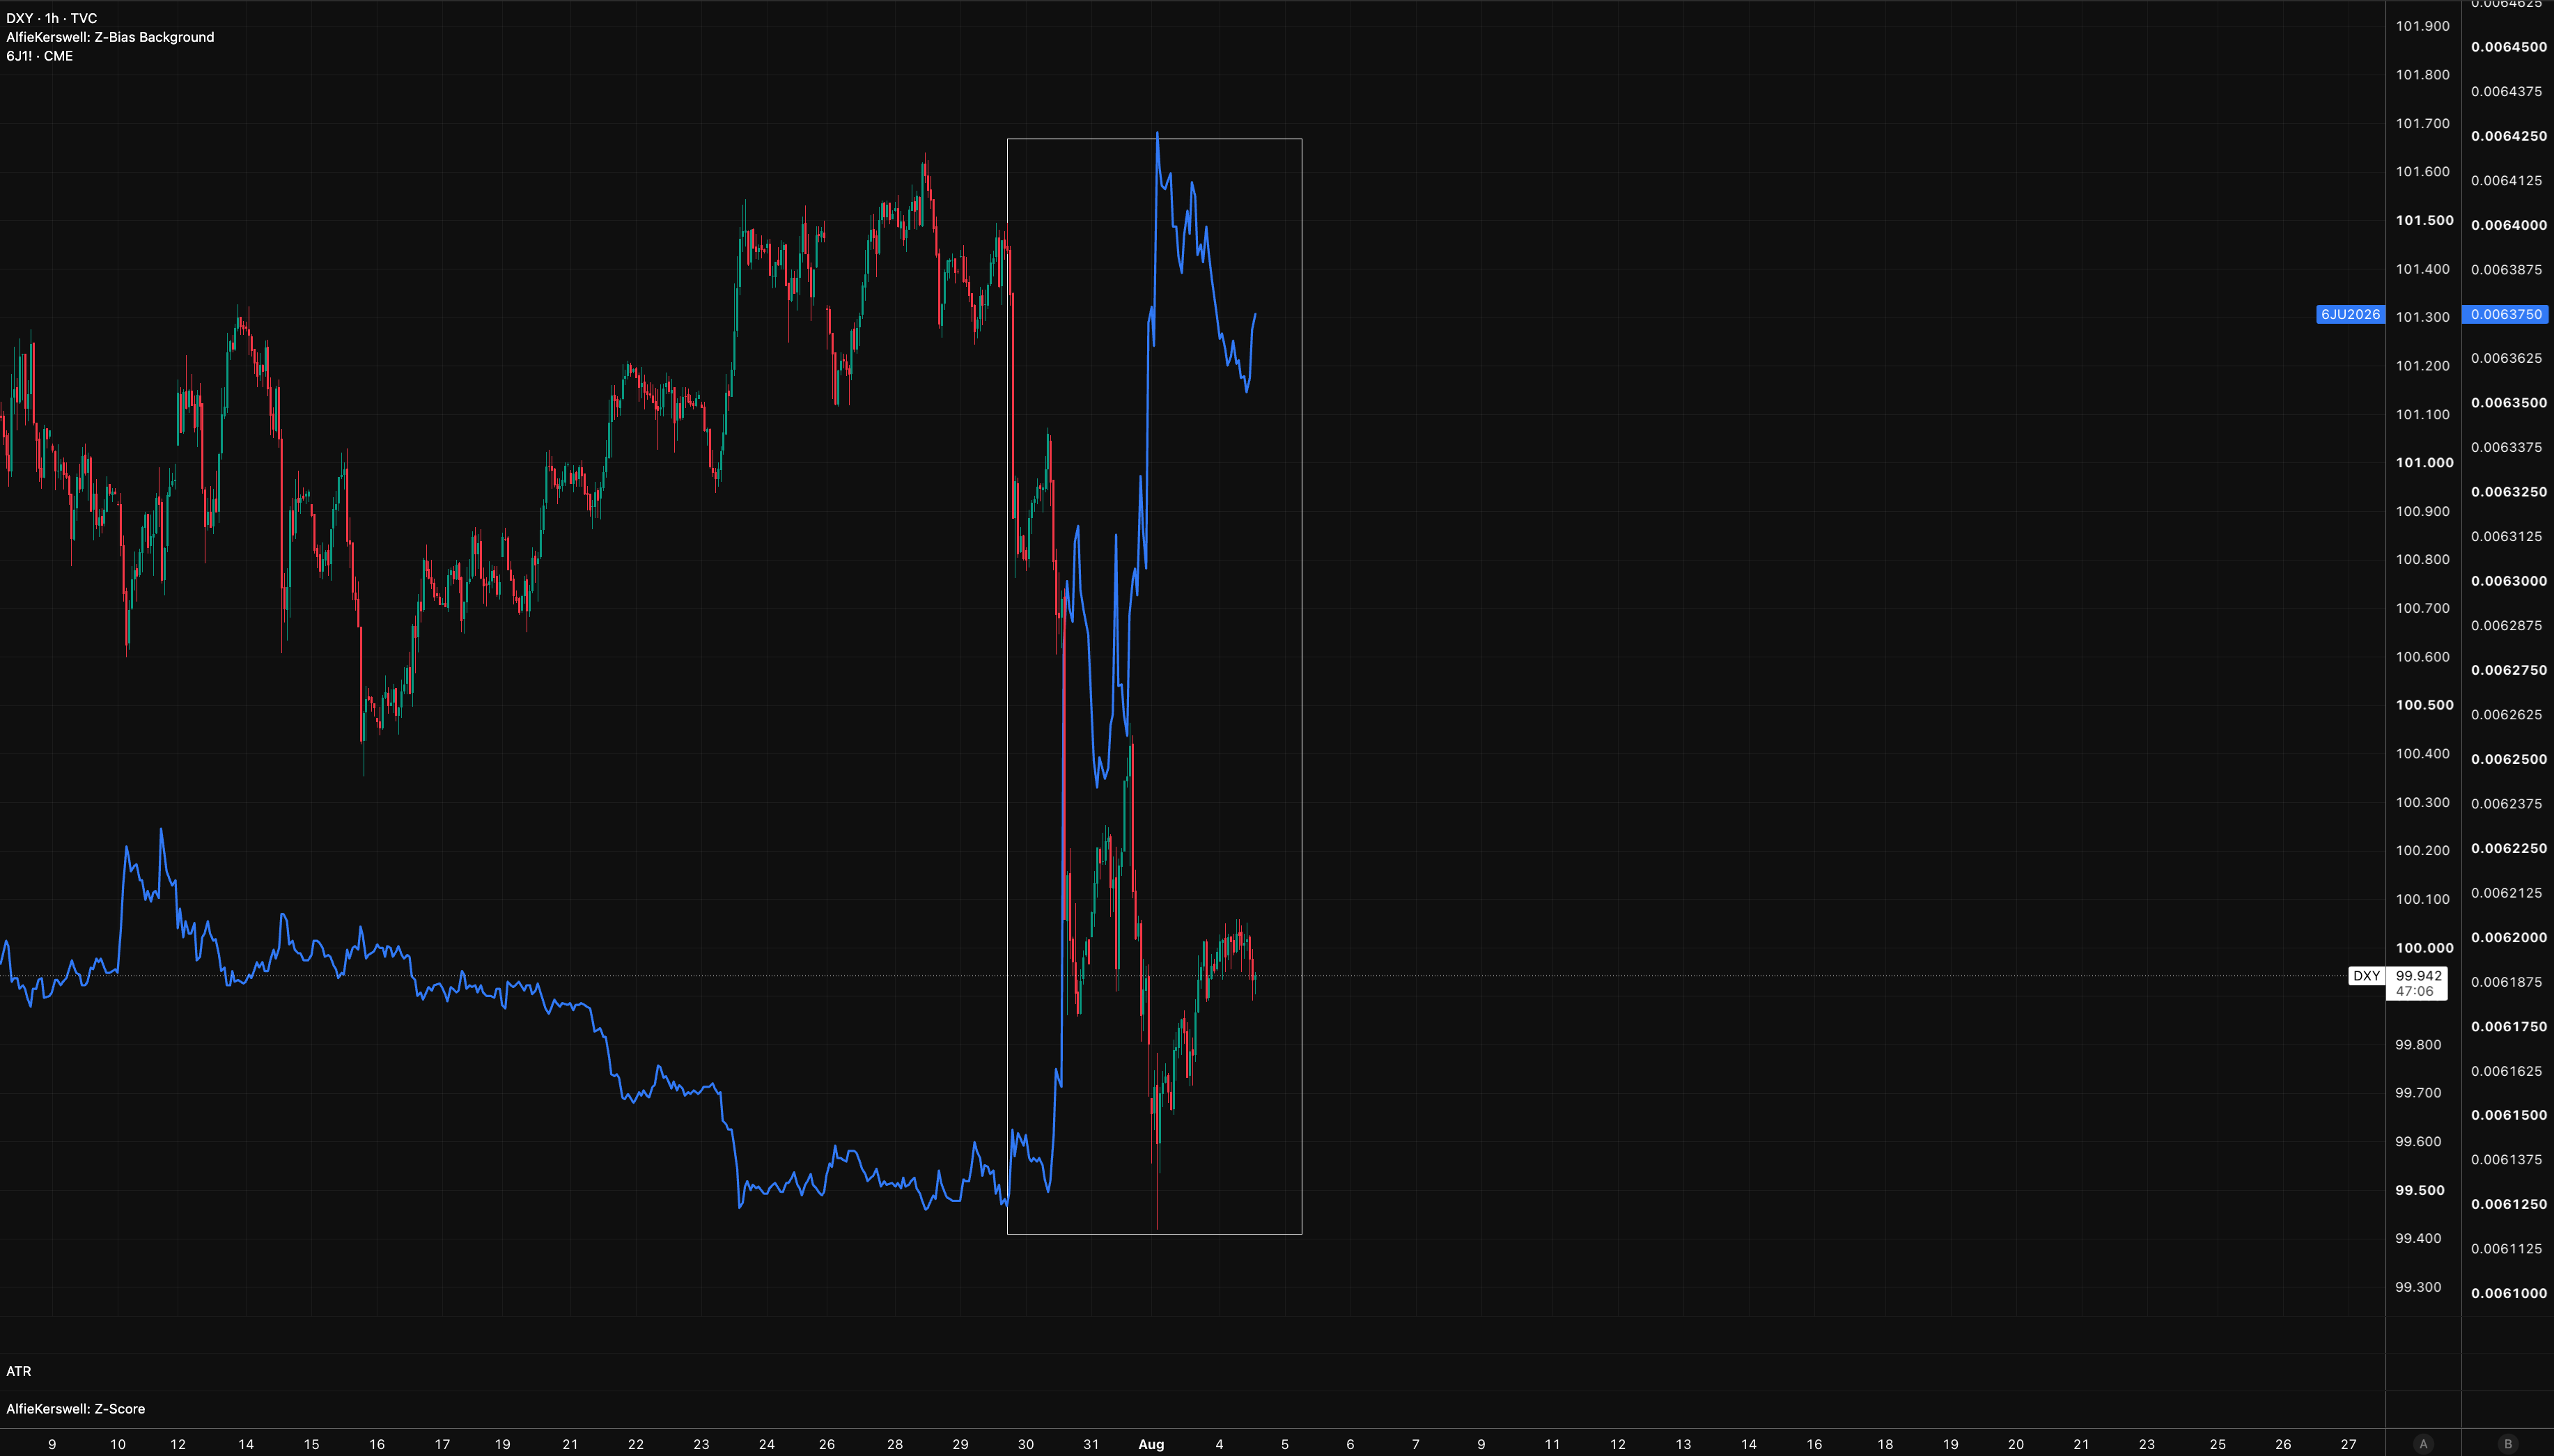
I’ve been tracking the correlation between the movements in the Yen and global asset markets to see HOW much the Yen has the strengthen to actually cause a materially wekaer gloabl equity market.
There were 3 obvious interventions in the Yen from the BoJ which caused NO selling pressure in equities.
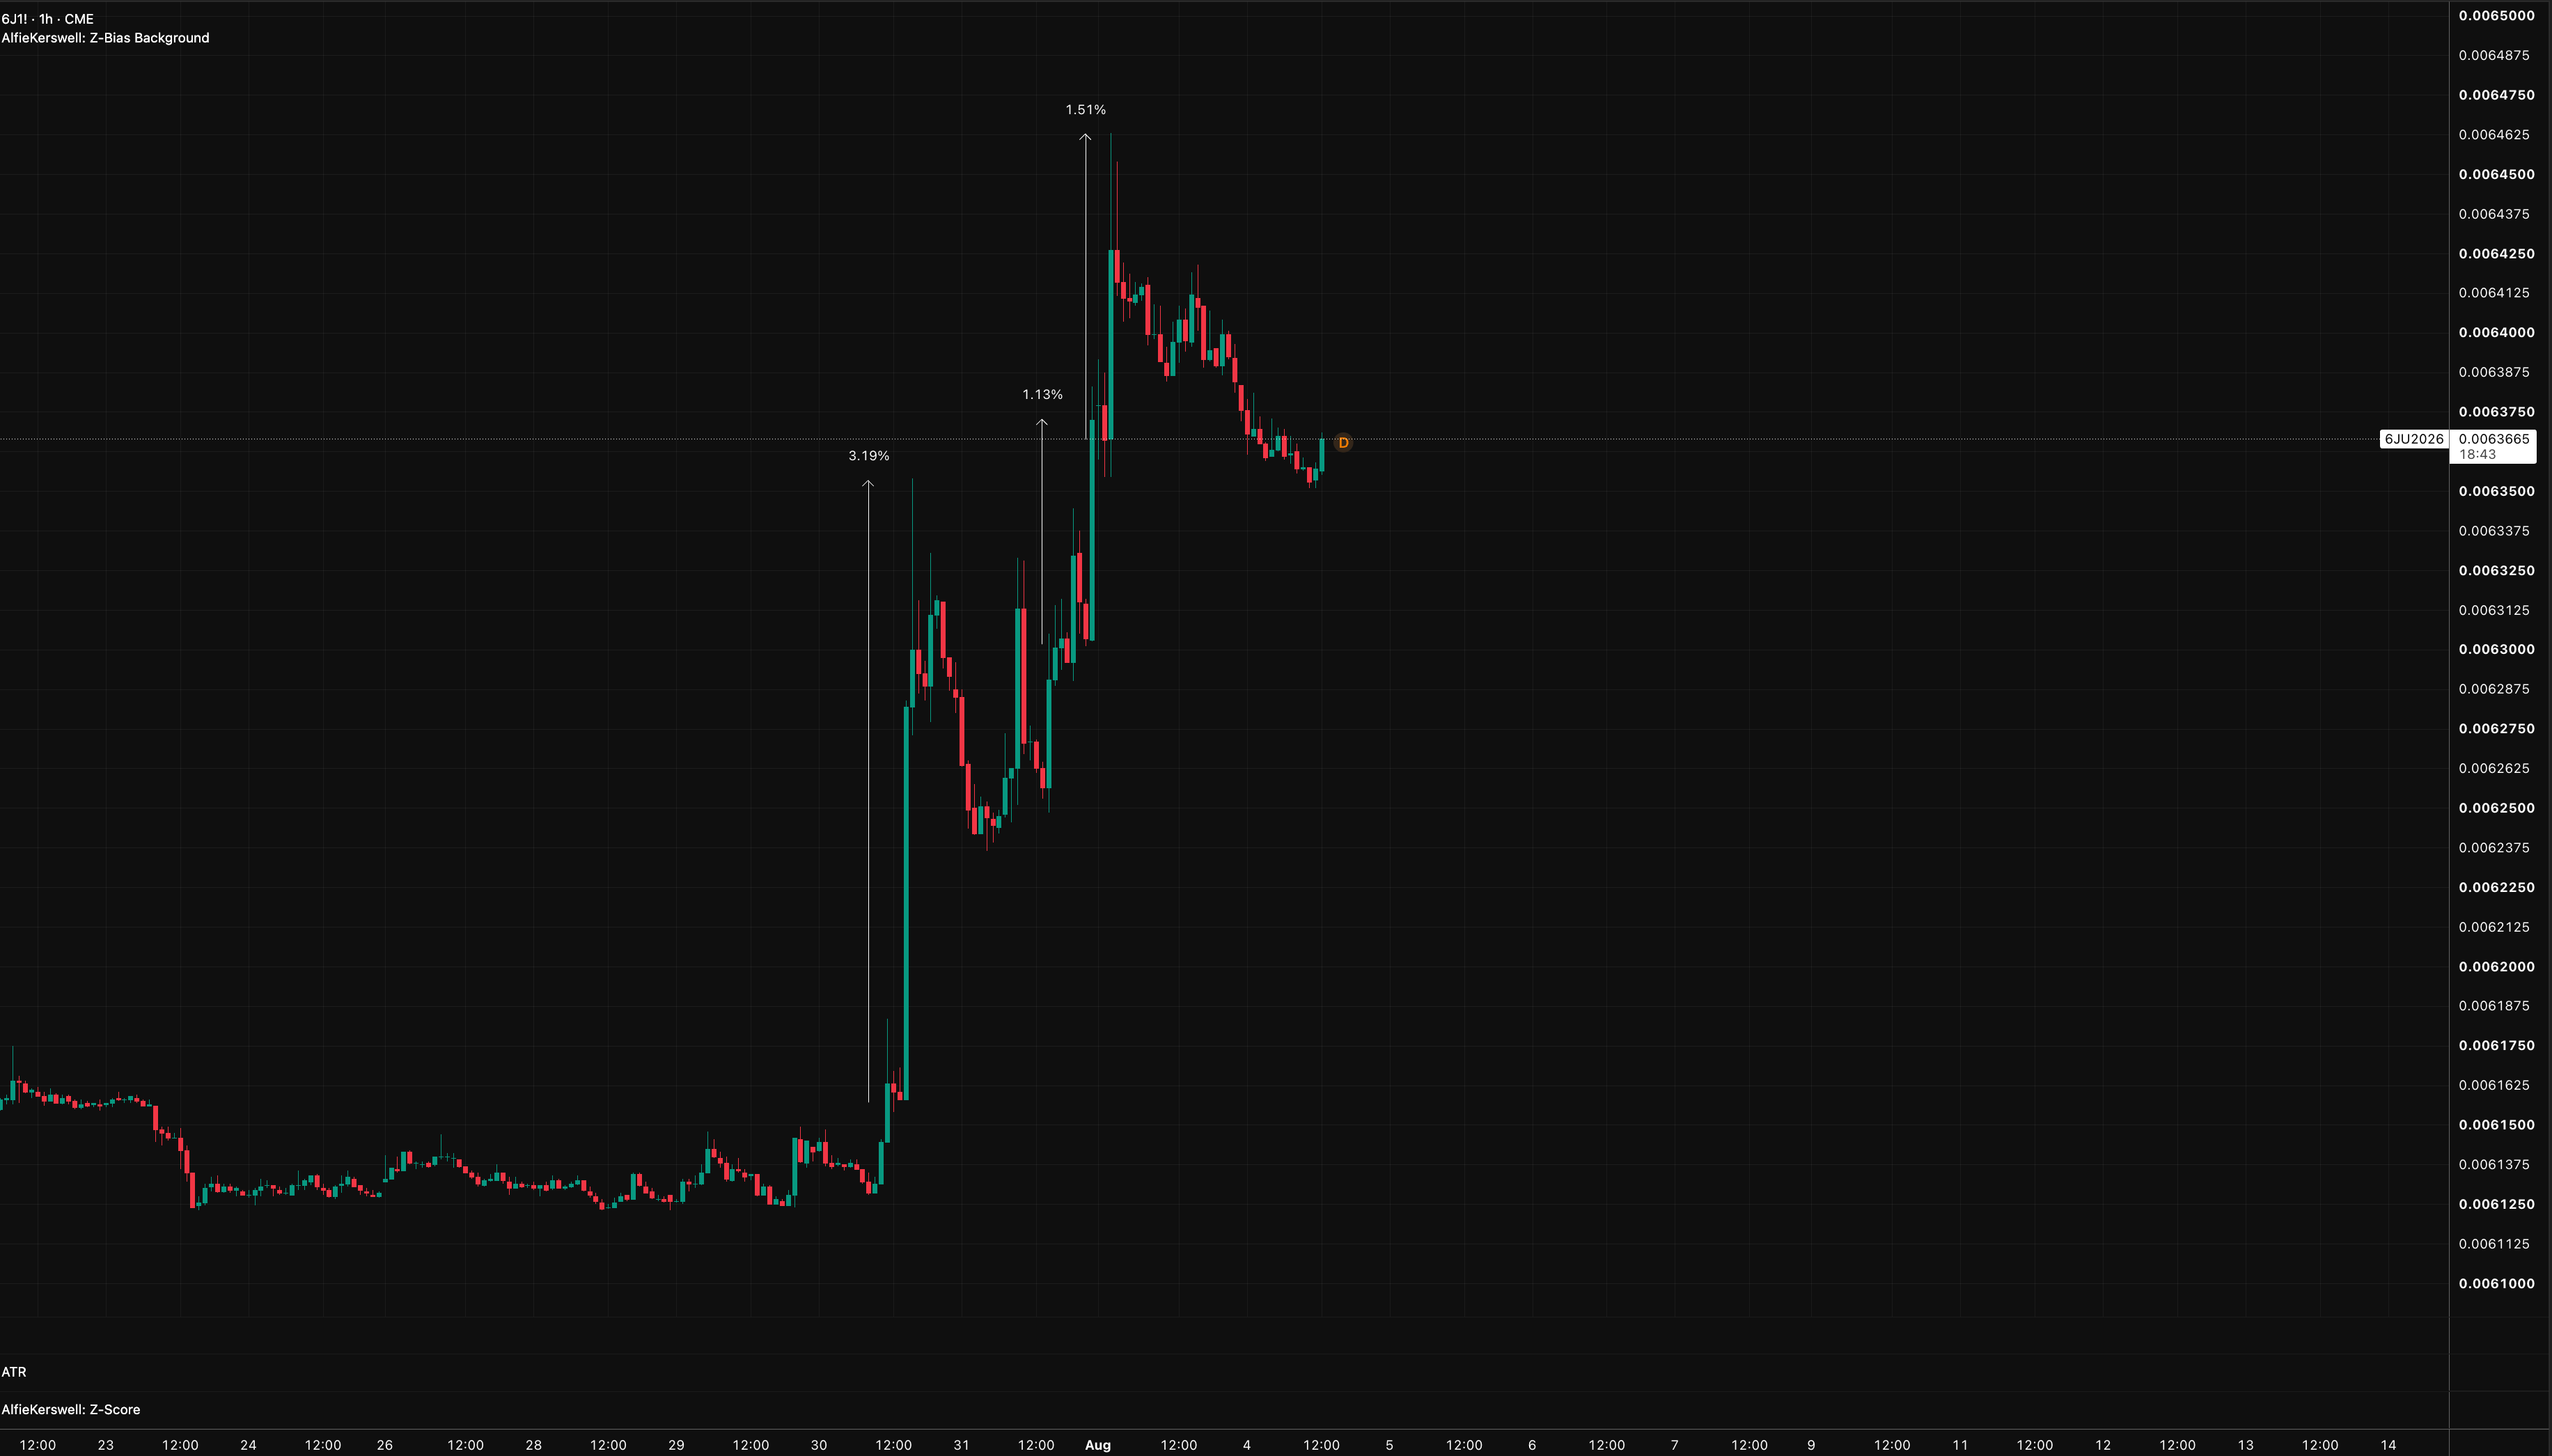
Further headlines also failed to cause any noticable movements:
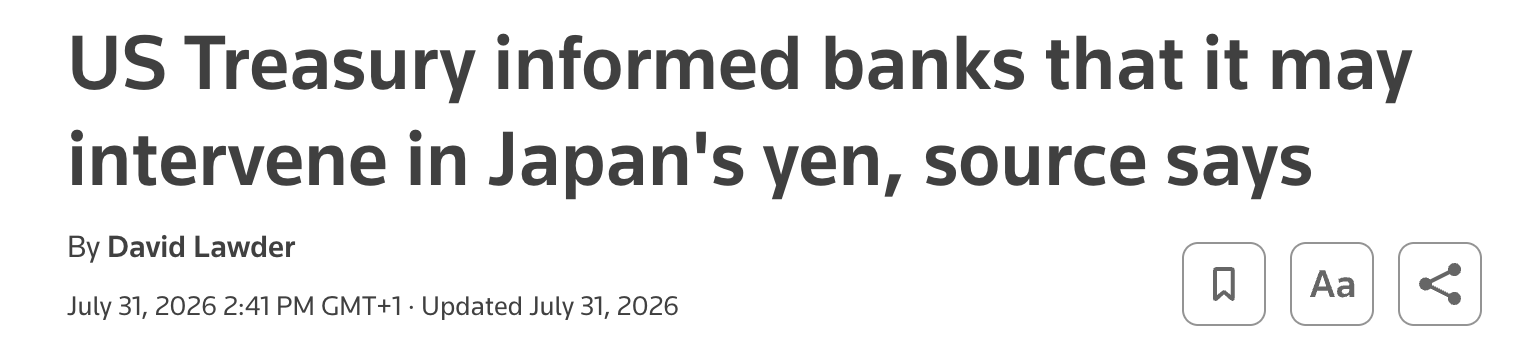
Remember, markets are priced so efficiently that worst-case scenarios from headlines will be priced almost immediately.
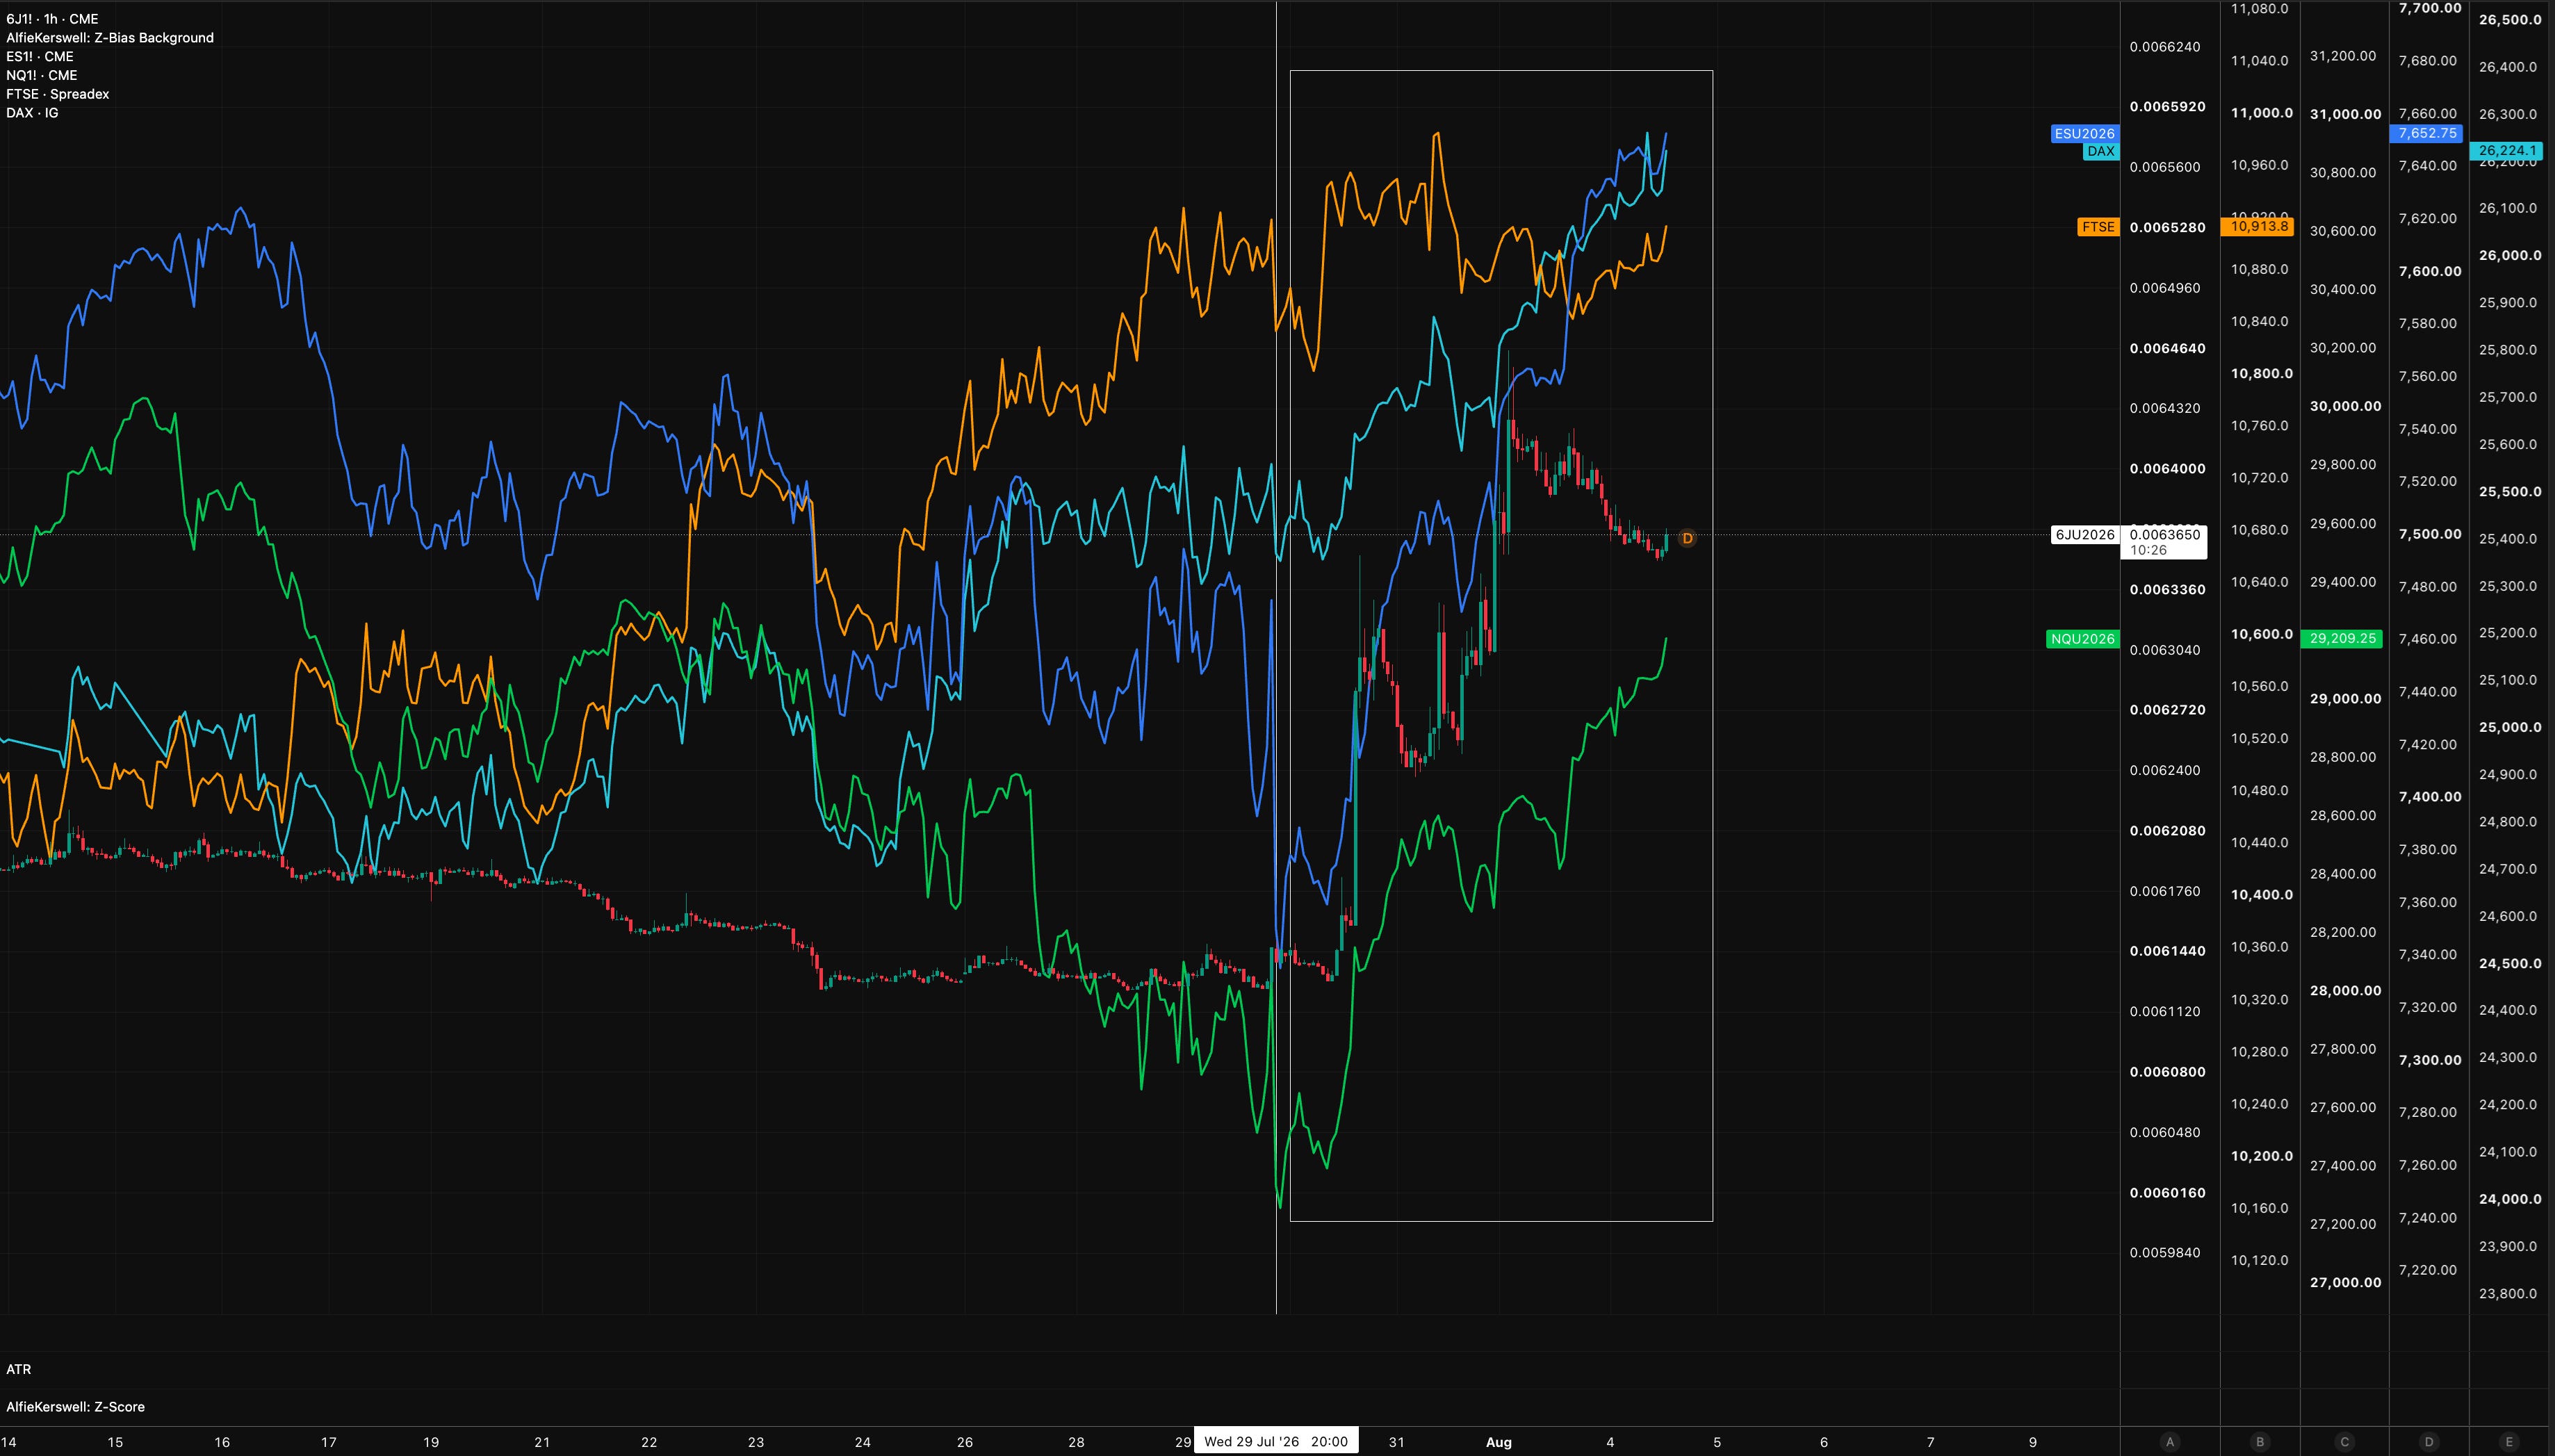
Now if the Yen is strengthening, why haven’t equities moved in direct negative correlation?
That’s because this strength in the Yen is NOT a carry trade event. If it was a carry trade event (directly moving rate differentials) then yes, you’d expect equities to move in direct negative correlation. This event is simply an intervention which hits just the spot price. For this type of event to unwind any rally in equities, there needs to be forced deleveraging which needs speed, vol expansion AND some type of scare (rates/growth etc), which we seeing NONE of these things occur.
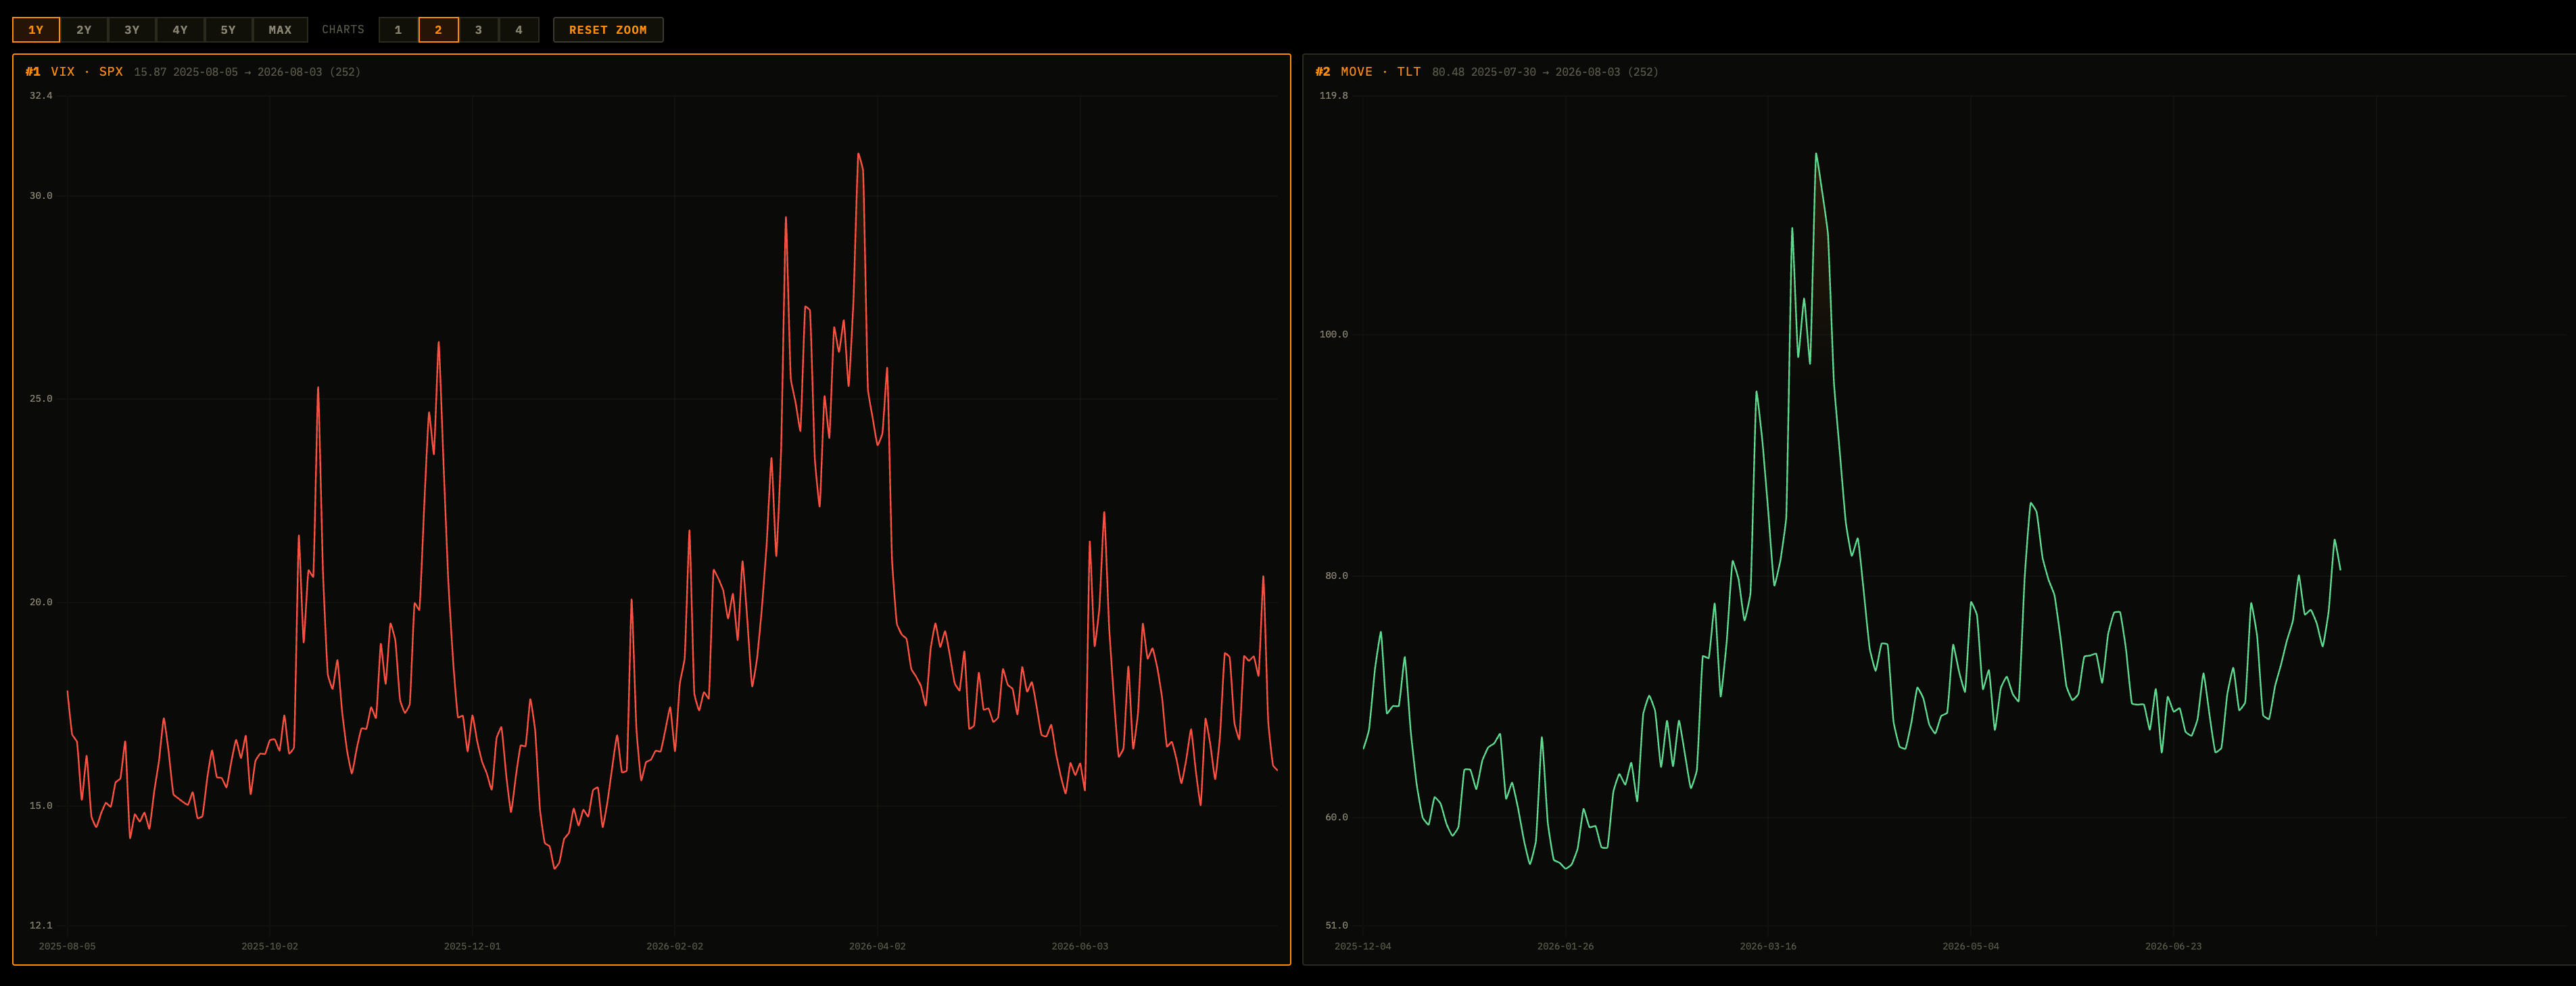
Rates volaitlity is moving up marginally while FX and equity market vol remains low and therer is absoliutely no sign of a carry trade unwind here
Another thing that is making this Yen strength less of an issue is the weakness in the dollar following the FOMC meeting last wednesday. Dollar weakness is a net-positive to equities (to a degree) which mitigates any effect (if there even was one) of a stronger Yen.
So there is minimal tailwind from the Yen right now, unless volatility begins to rise or there is a true growth scare (nowhere near) meaning that tail-risks for equities sit inside rates, in my view.
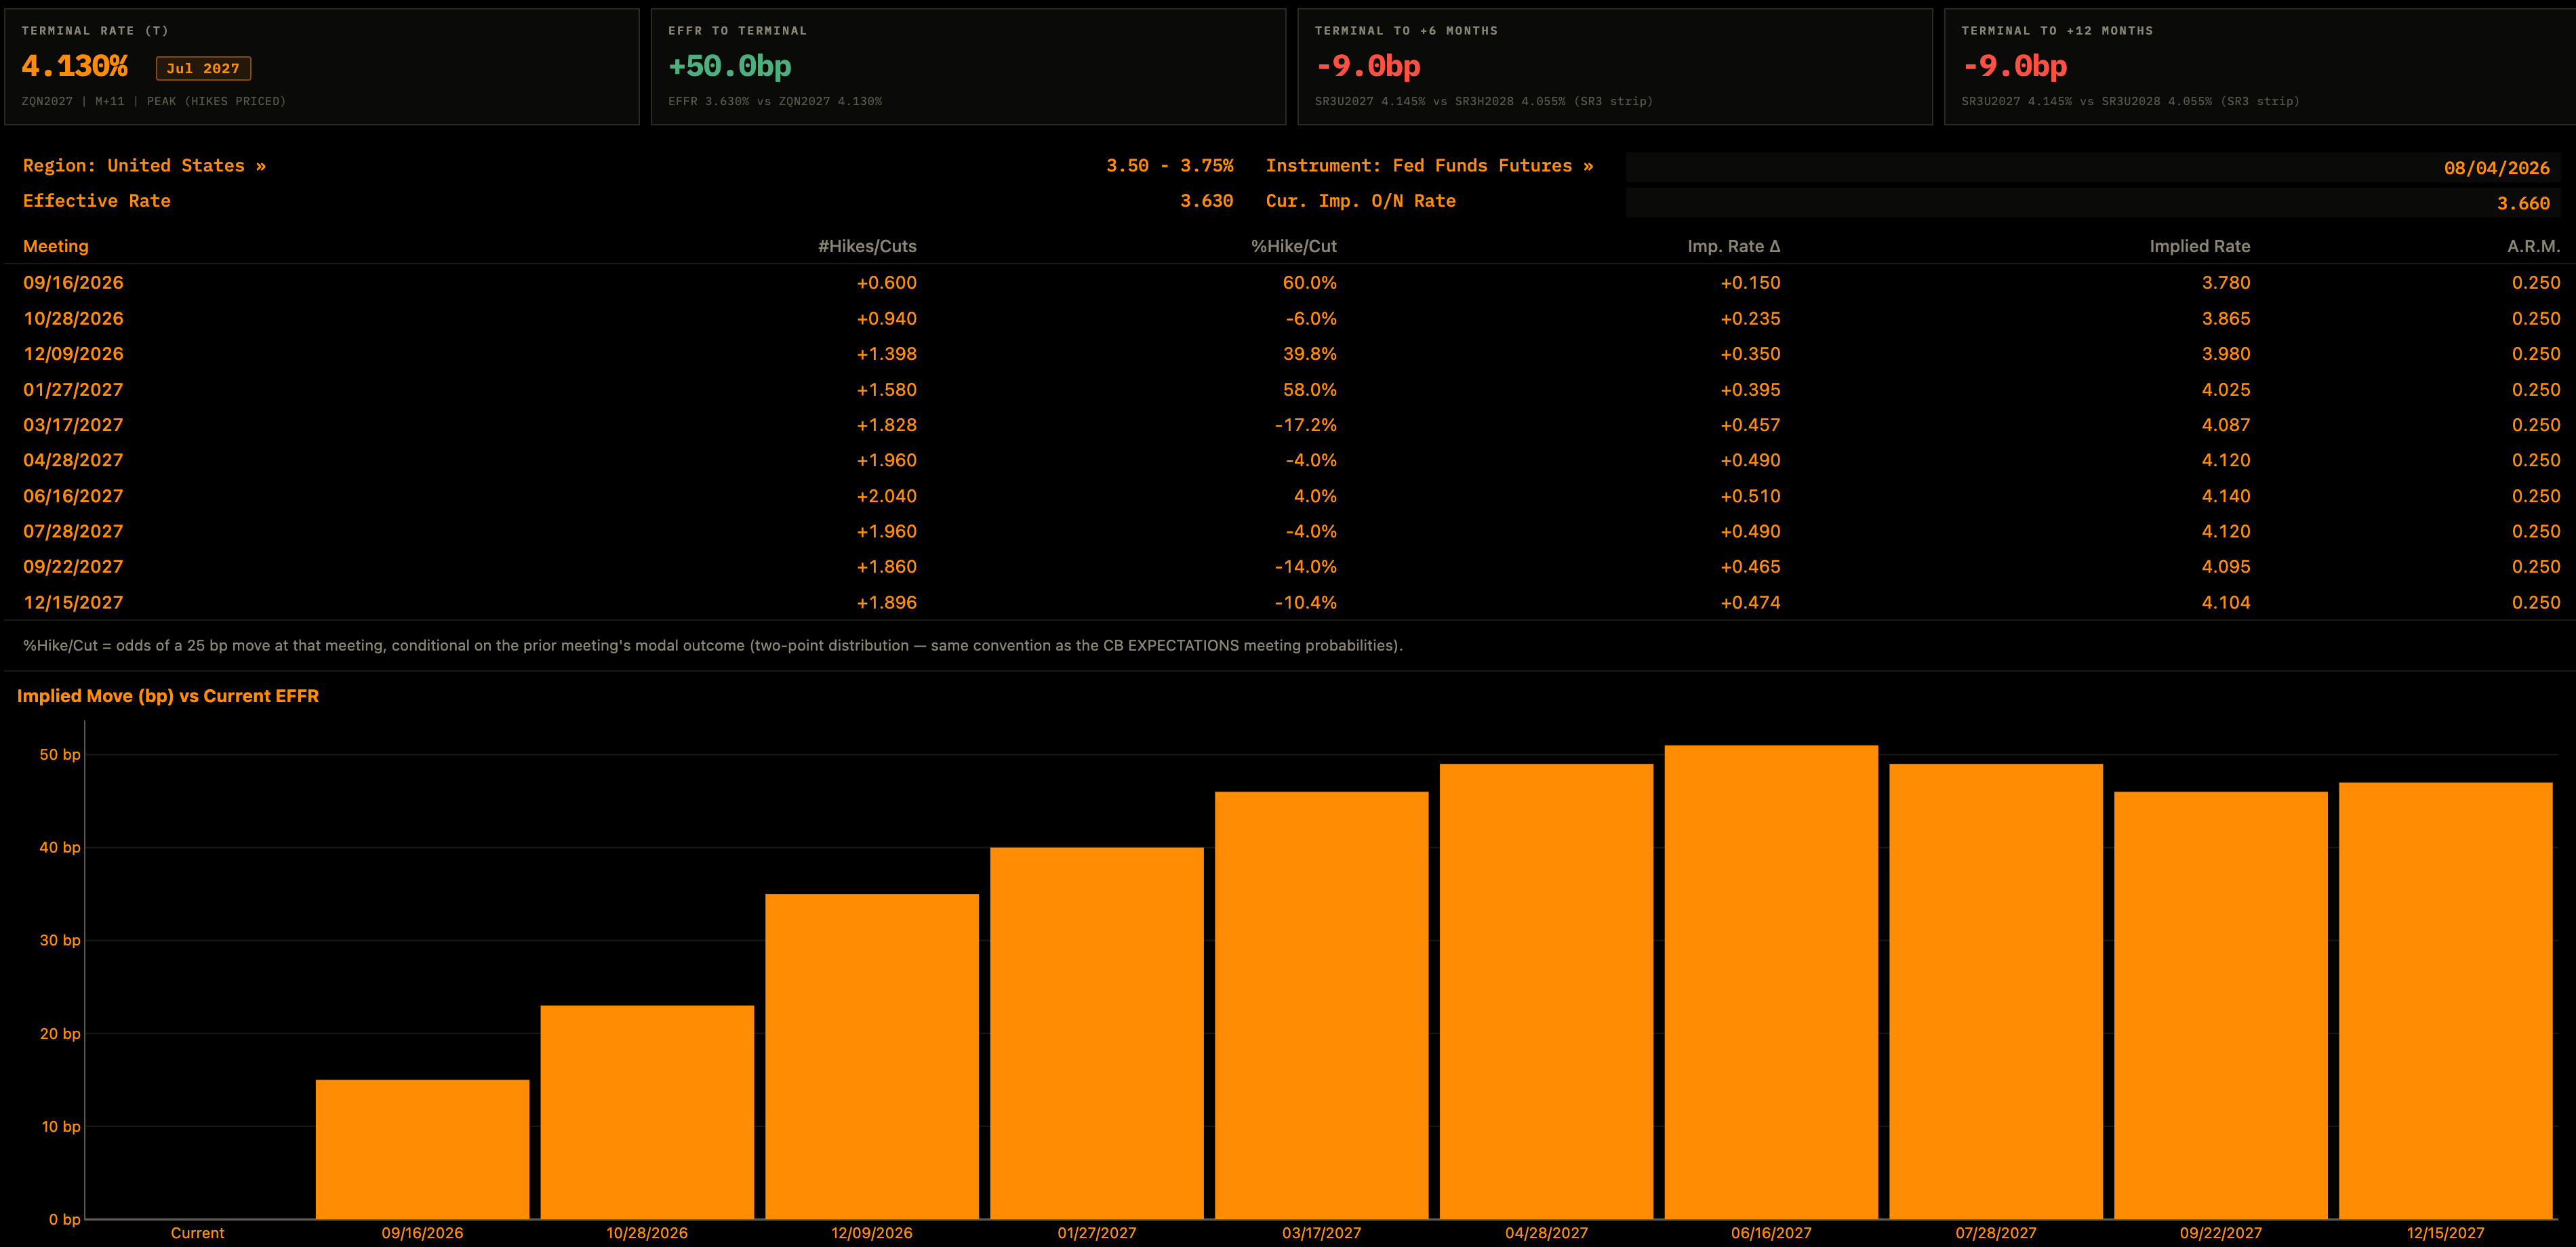
The forward curve has priced roughly 50bp for a decent period of time now so this is nothing new for equities to digest and for as long as we’re getting companies beat earnings, the market can shake off any hikes priced in (unless we start moving towards 3 hikes, which is an UNLIKELY scenario). An example is Palantir yesterday, whose revenue is up 93% in the 2nd quarter of the year.
So the market is priced for a hike in September, and then one in January. This shifted a little from the Septmeber and December steup we had just a few weeks ago, all hawkishness is now being pushed further down the line and increasing the liklihood of a scenario where we see just 1 hike being delivered.
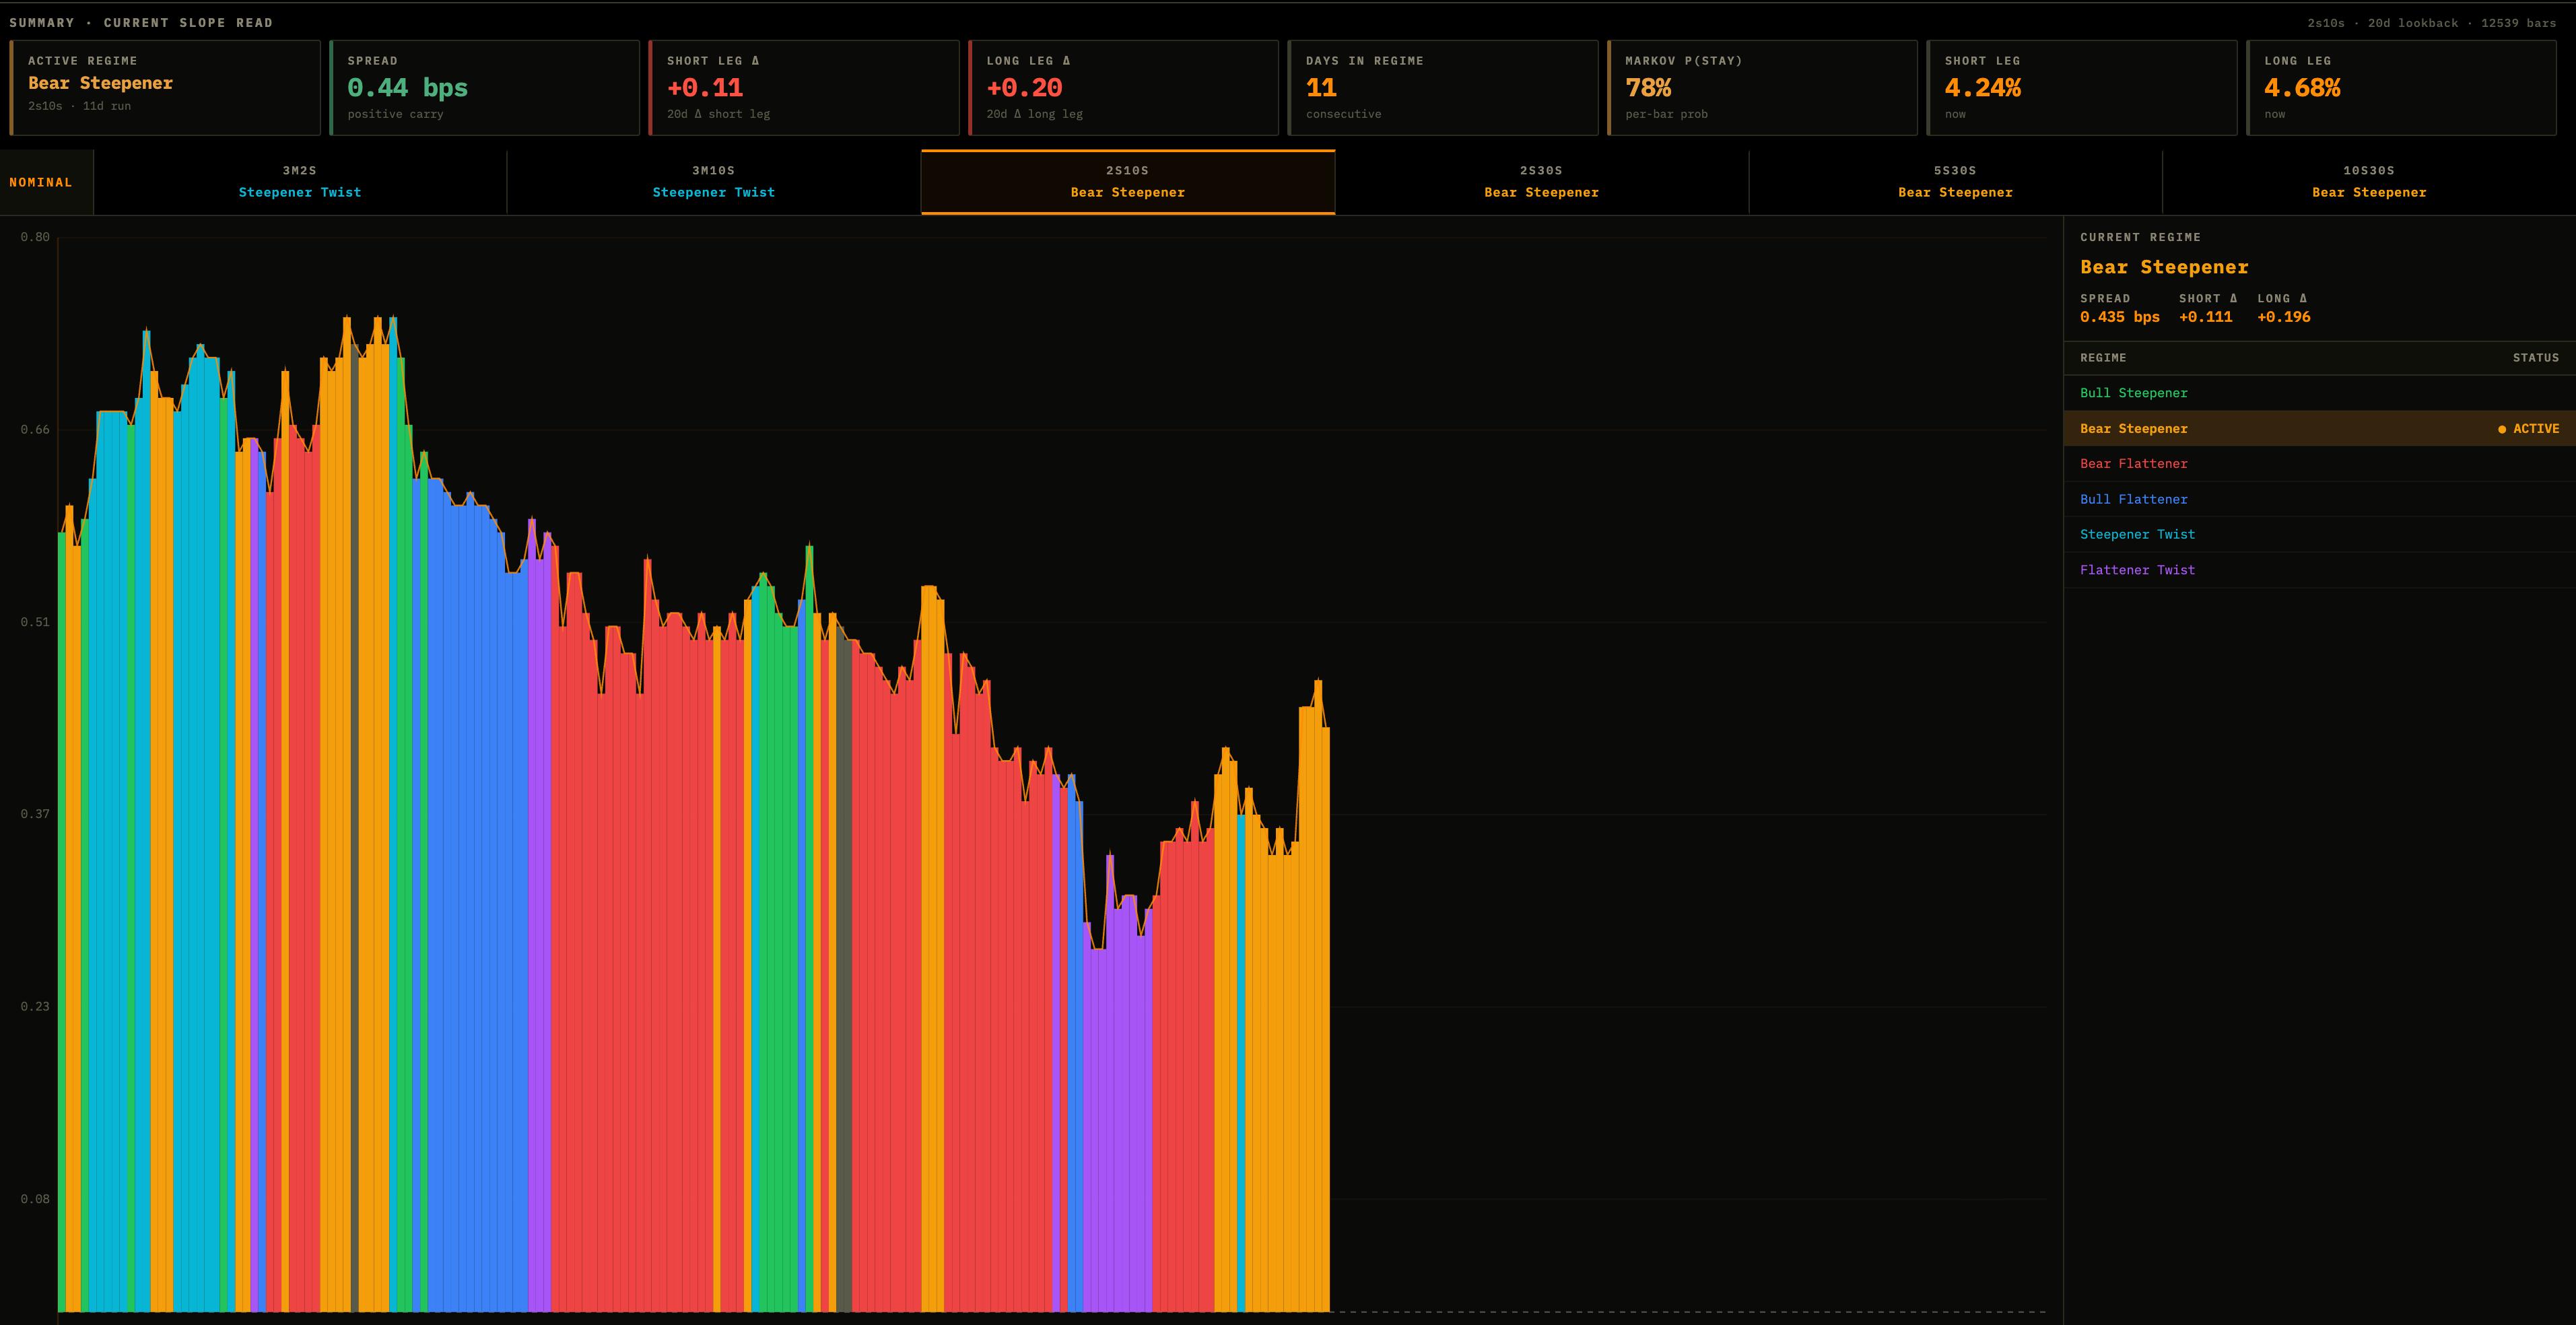
The yield curves flipping from bear flattening to bear steepening shows that the market doesn’t think the Fed are having some type of massive negative effect on longer-term growth (which is reflected in the 10y). If the market truly thought the Fed were being overly restrictive and that this would have DIRECT impact on growth, then we’d be seeing persistent bear flattening which we are not seeing. If we do see bear flattening as equity vol moves higher then I’d defintiely considering being neutral or running some smaller sized shorts (although this is not preferred, I want to see A LOT to get short).
Breakevens falling this hard is reassuring me that there is little tail-risk that the previous enegry shock and this rapid growth in the US isn’t bringing any inflationary tail-risk with it. Nomianals are being driven by real rates which is just a function of HOW restrictive the Fed are being (which in my view has reached peak hawkishness).

So where is this bond volaitlity coming from then? Why does it exist? Well firstly, equity vol and FX vol both net out shocks that bonds HAVE to absorb in full. This literally just means that good news lifts earnings but also lifts rates, so equities half-cancel it, and if every country‘s rates are uncertain together then the differnece between them stays flat (so FX cancels it too).. A yield has nothing to cancel it agaisnt so it takes the WHOLE hit.
Rates vol can begin to drag up vol in equities if the reaction function to data points creates negative movements in equities. For example, a stronger growth print with inflationary tail-risk means that rates go up and multiples go down so then there is no offset in equities and that will bring volaitlity up. Basically, when a hot print sells off both stocks and bonds, the netting is gone.
Another example of how rates vol can drag up equity vol is if the volaitlity in rates begins to directly push credit spreads higher which bings up the cost of capital and drags equity vol up.
We are still NOT seeing these risks materialise and there is not enough excuse for me to begin running any aggressive shorts.
Thanks
Alfie
Disclaimer
The information in this publication is provided for informational and educational purposes only and is believed to be reliable, but its accuracy and completeness are not guaranteed. Nothing herein constitutes investment advice, an offer, or a solicitation to buy or sell any security, derivative, digital asset, or other financial instrument, nor a recommendation suited to any specific reader. All figures are drawn from the day’s computed data set at the time of generation and may be delayed, revised, or superseded. Markets involve risk, including the possible loss of principal; past performance and historical relationships do not guarantee future results. Readers should conduct their own research and consult a qualified financial adviser before making any investment decision. The author may hold positions in instruments discussed. This publication is licensed for the personal use of the subscriber only: redistribution, reproduction, or resale in any form is prohibited. © 2026 MARKET MACRO HUB. All rights reserved.
regarding rates vol i know move is the standard measurement but I was quickly look at the vol across the UST futures curve and it seems like a lot of the vol is coming from the long end. particularly UB (UL) not in front of my desk so I can’t say for sure but it kinda seems like rates vol is muted all things considered