
Liquidity & Credit
A Current Perspective on the Two Cornerstones of the Financial System

Hey guys,
It’s been a relatively quiet week on the economic data front, to all my US-based readers, which I must say is a lot, happy Thanksgiving to you and your family!
In yesterday’s private report, I mentioned I’ve got something for you all, so let me reveal it to you.
It’s Black Friday weekend.
Now look, I know you’ve got roughly 216 emails offering you handsome discounts, but after conversing with some of you who have already purchased ‘The Four Foundations of Macro FX’ I knew it would be a disservice to not offer this to you all.
So here’s 60% off “The Four Foundations of Macro FX”. Use code Macro60 ;)

It’ll help you avoid 90% of the mistakes I and almost everyone out there did.
(P.S, for those wanting to access MMH Pro macro reports, I didn’t forget you, here’s 40% off)
Growing this newsletter and community has brought amazing opportunities and experiences for me to grow and bring you all along with me on my journey.
There’s so much more I have in store for you reading this, just a matter of time and execution.
Whether you decide to take full advantage of this offer or not, you’re the reason why we’ve come this far and grown to over 2,000 readers globally!
So thank you.
Anyway, let’s take a dive into this report covering US liquidity conditions.
Liquidity is the foundation
Liquidity is the one constant all market participants can agree helps to lubricate the wheels of financial markets. This idea is evident when studying the causes of systematic risks and crises. More often than not, a withdrawal and lack of liquidity results in failures in financial markets. There’s a plethora of examples one can look at just this past year, the banking crisis of March was the largest banking failure since the GFC, and if not for the instant liquidity injections and funding windows made available by the Fed the state of the banking system would be very different to how it’s looking now.
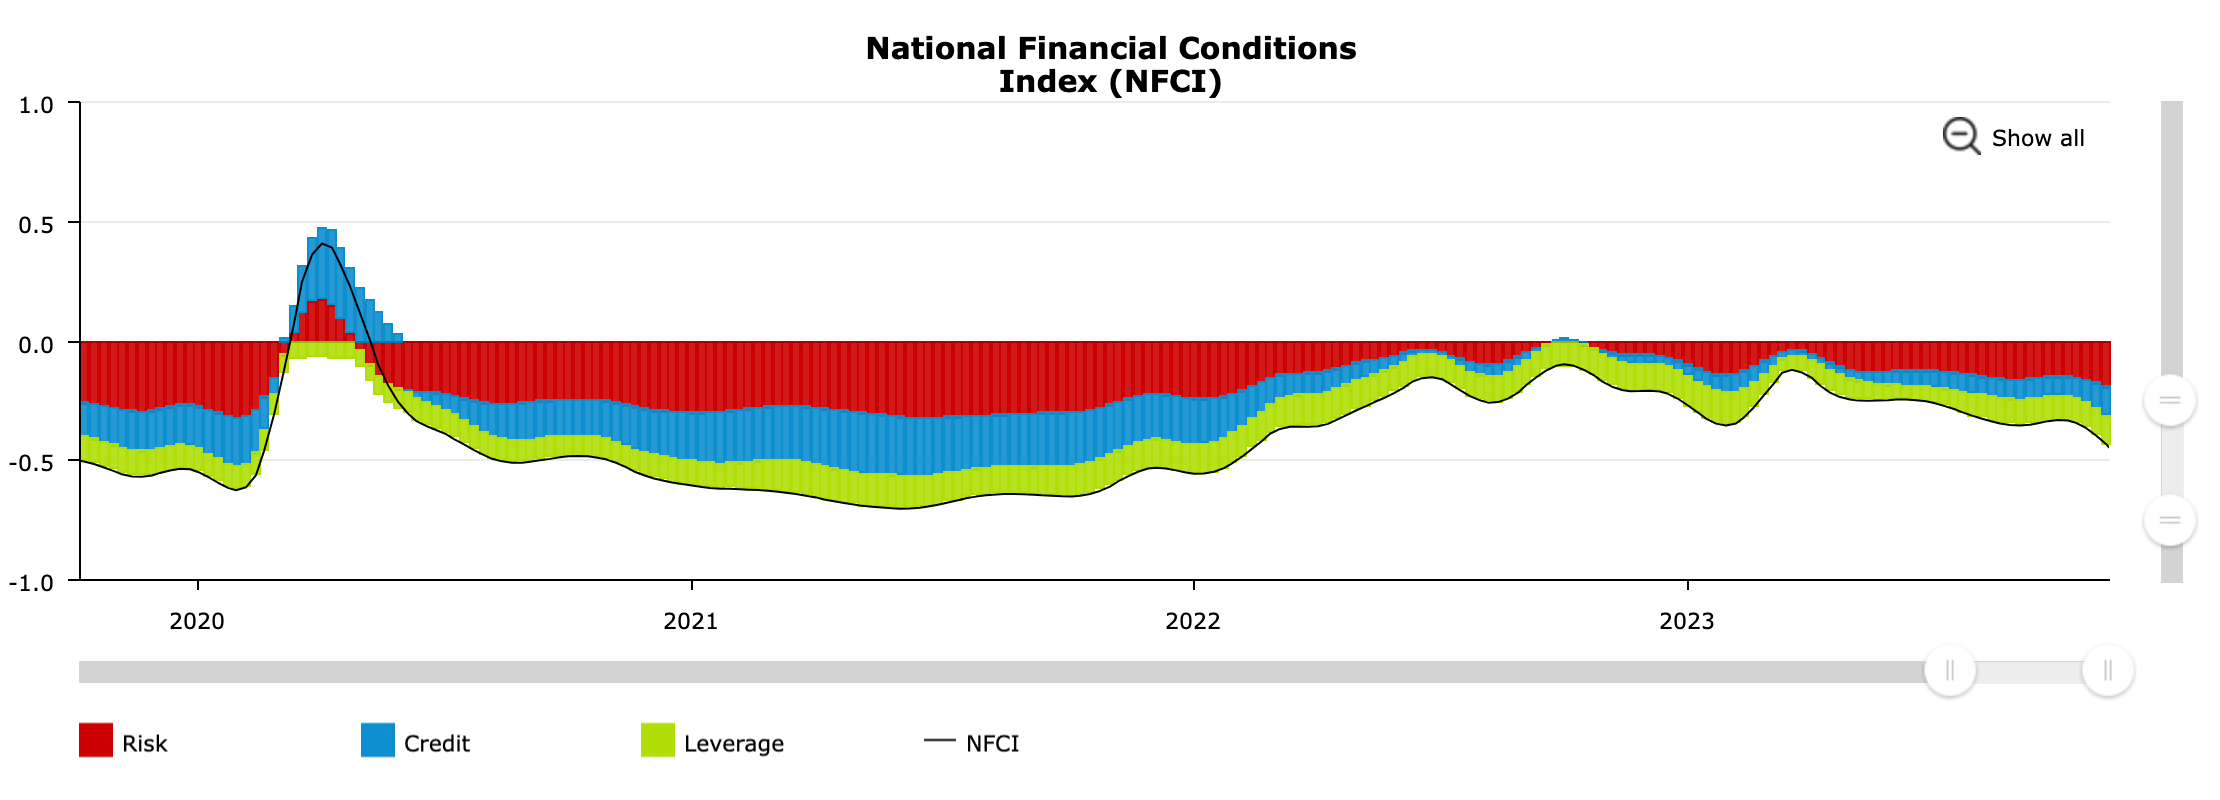
This index provides an overview of financial conditions in the U.S, taking a weekly snapshot of financial conditions across money markets, debt and equity markets as well as shadow banks. When the index values are above 0.0 this means financial conditions are tight, and as a result, liquidity conditions are drying up across markets. The opposite is true when the index is below zero, and moving lower, this represents a loosening in financial conditions.
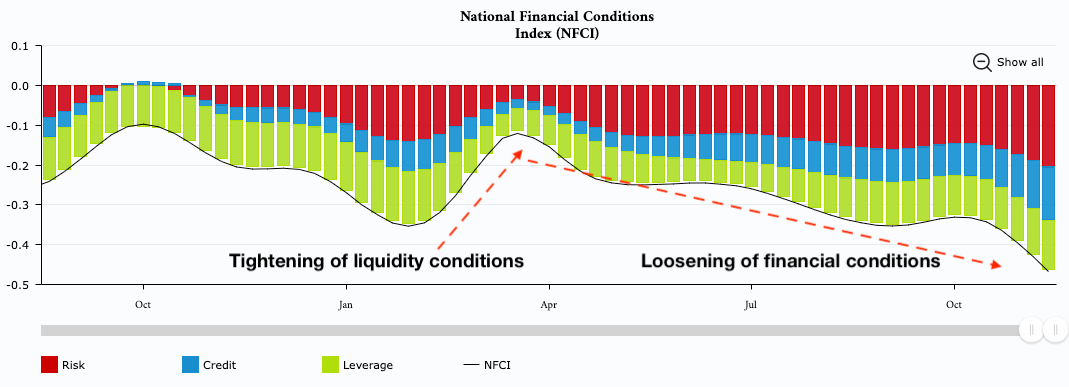
Isolating 2023 by itself we can understand the flow of liquidity conditions across different periods with markets. Most notably, March presented a brief shock to financial markets before the Fed’s lending facility restored ample liquidity to the financial sector. Now although the NFCI tells us that conditions in the US are getting looser it is important to take in other factors such as private sector conditions and look at credit spreads which present a deeper level of transparency into the health of financial conditions in order to come to a conclusion.
As mentioned, one way of observing credit within the US is the NFCI, but if you want to take it a step further you can analyse corporate credit spreads.
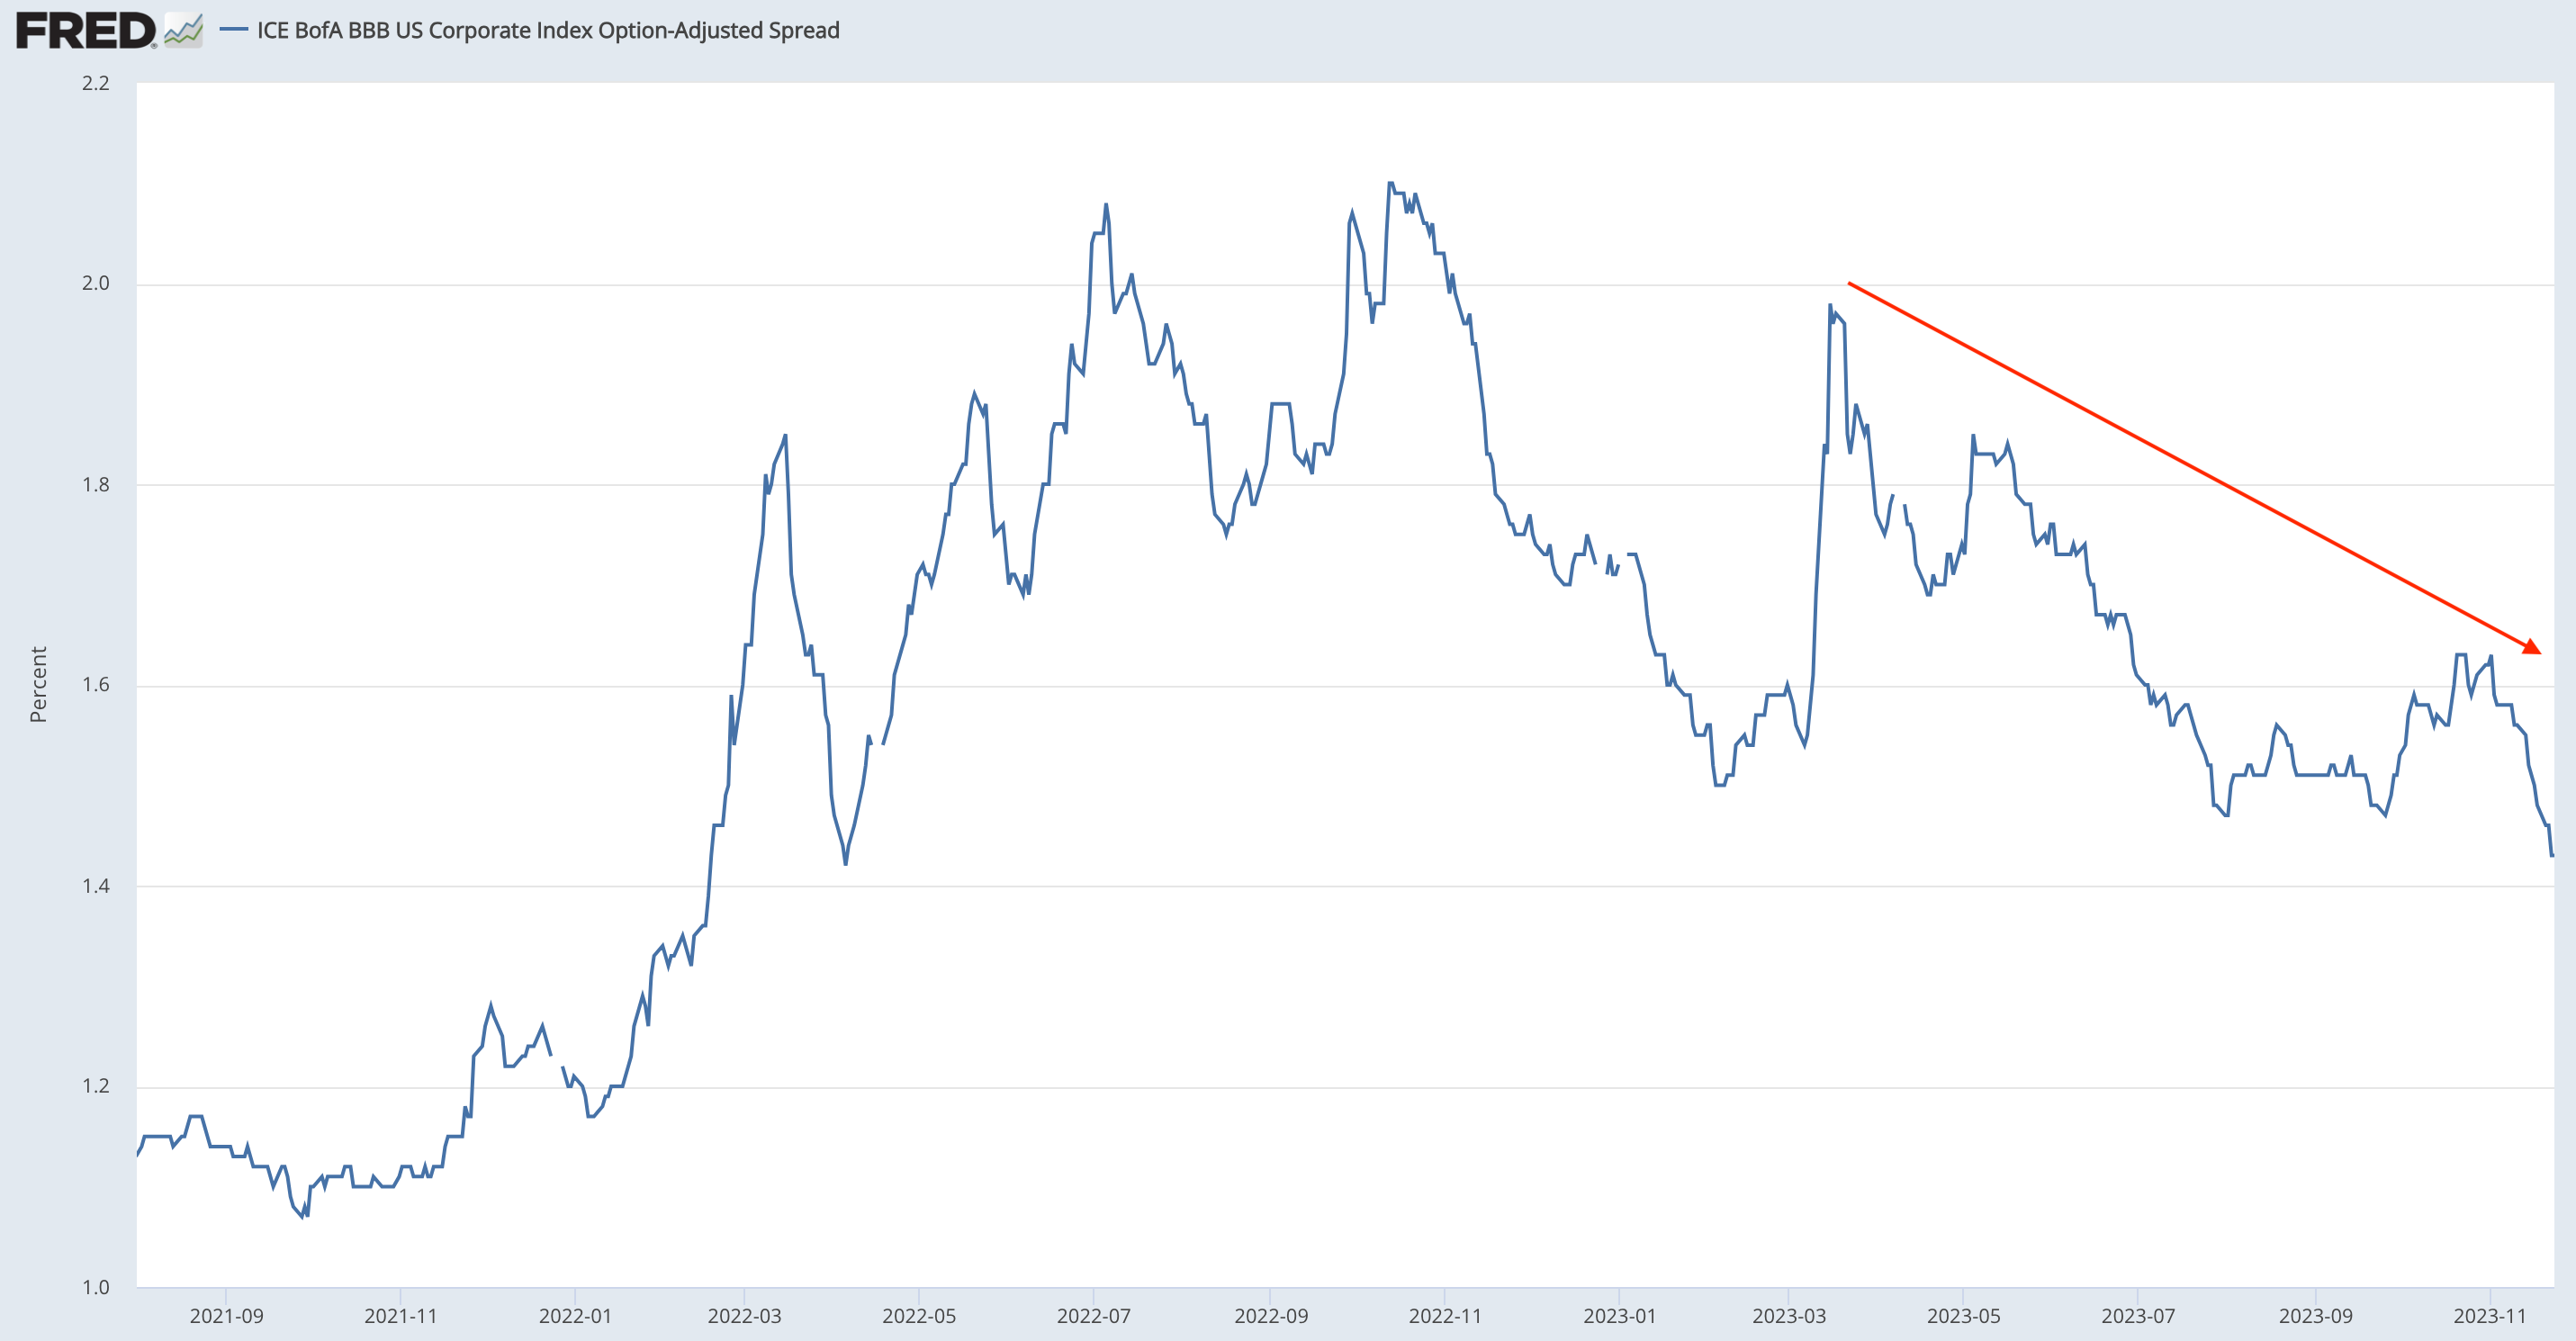
Credit spreads serve as a crucial indicator for gauging the current position within the liquidity cycle. Narrow credit spreads signal that borrowers can access credit both readily and affordably, while widening credit spreads indicate that obtaining credit becomes more challenging, which aligns with the Federal Reserve's objectives. However, the figure below demonstrates that credit spreads have been tightening since their peak in March. When differentiating between Treasury bonds and corporate bonds, the key distinction lies in credit risk. A US company carries a higher default risk compared to the US government, resulting in an additional yield, known as the risk premium, demanded by investors. However, recent trends have shown this 'risk premium' shifting downwards
Now we’re not just seeing a decline in corporate credit spreads, but also mortgage rates across the US have continued to slide reaching lows of 7.29% for a 30-year fixed loan, according to Freddie Mac (Government Sponsored Agency).
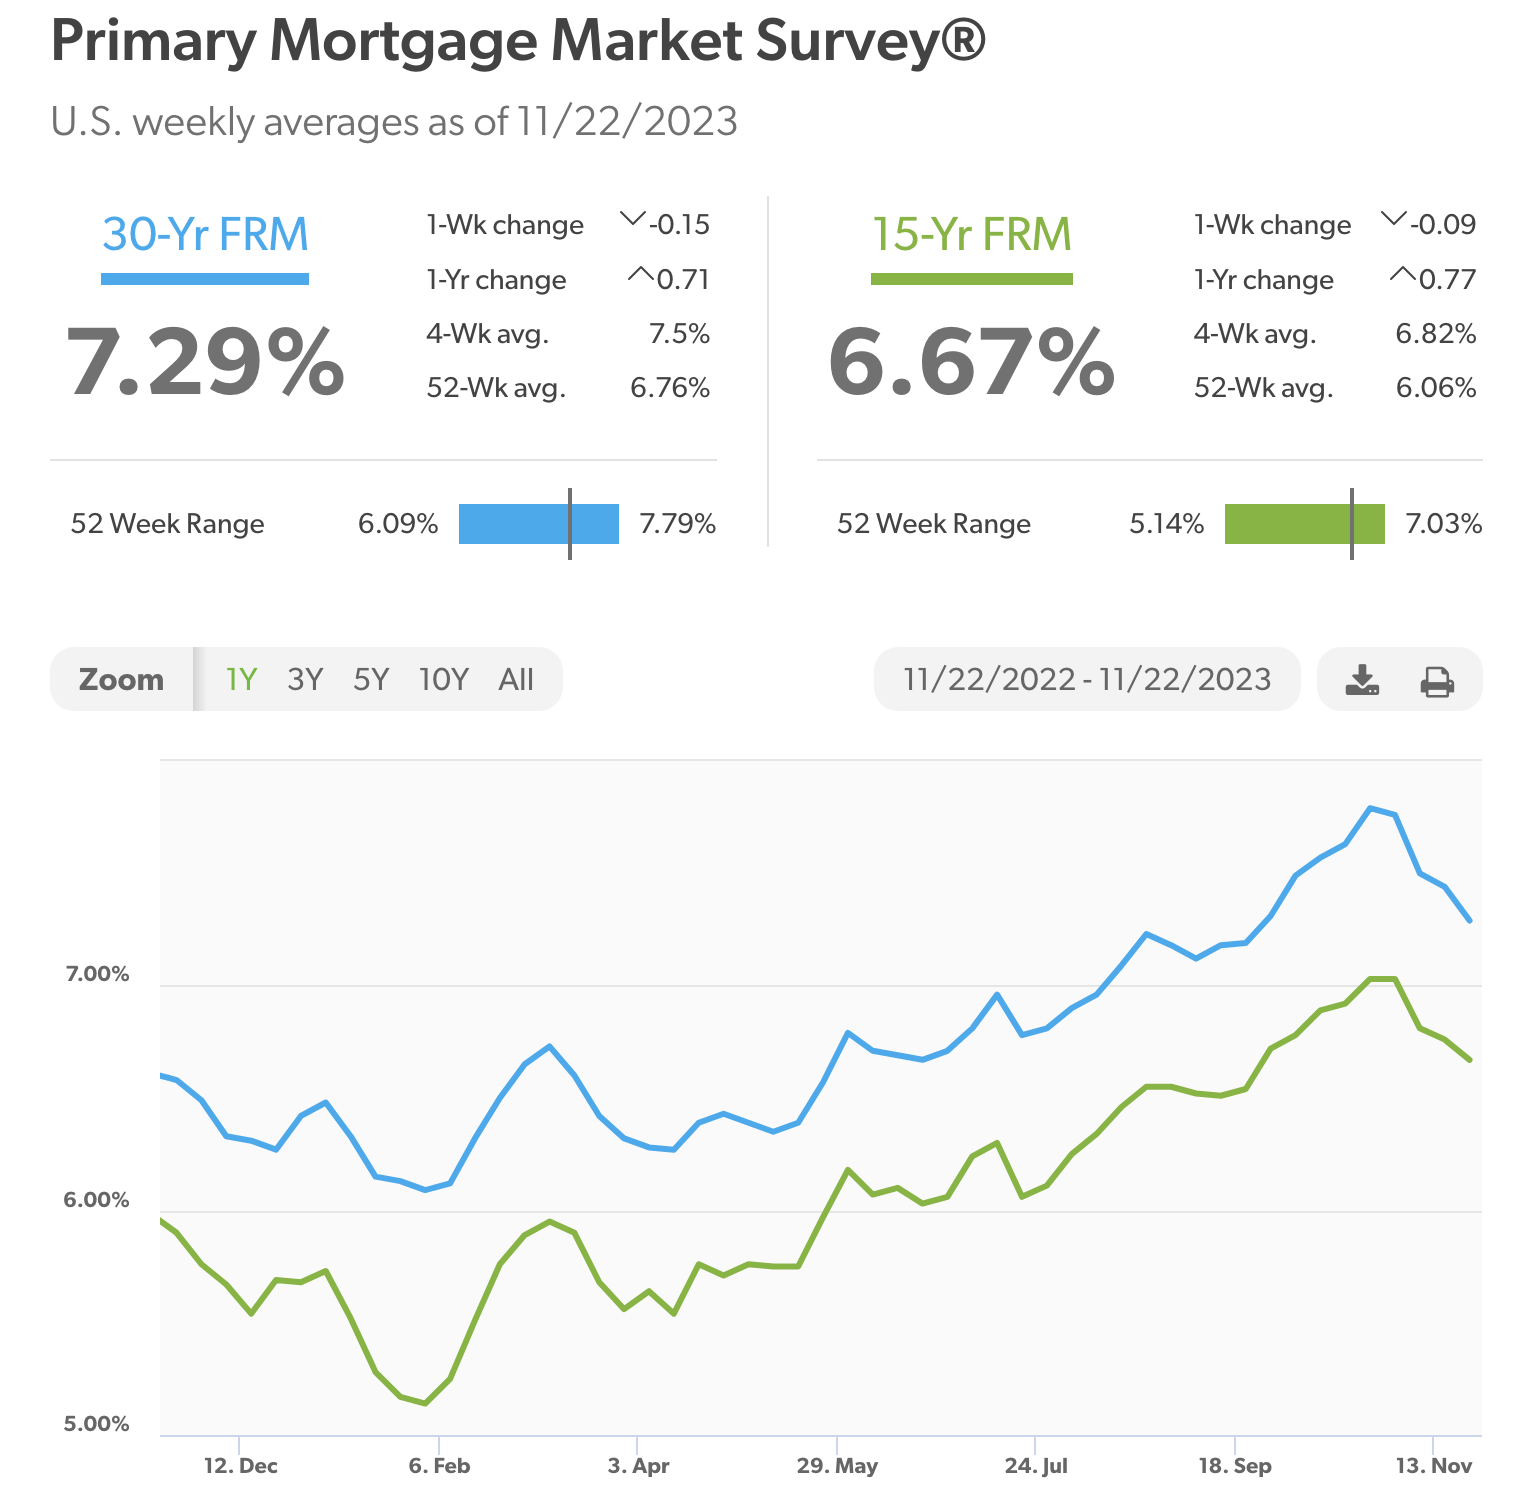
Mortgage rates provide the best insight into both liquidity and credit conditions for one main reason, the largest interest rate exposure households have lies within their properties. Unlike corporate credit spreads, mortgage rates in the US have rallied alongside the benchmark 10y bond. Early November marked the steady decline in mortgage rates across the US. For private-sector households, credit conditions remain extremely tight, especially for individuals entering the housing market.
In previous reports, I’ve explained the challenges presented by the transmission of interest rates across the US economy, but for the most part, their economy has proved that the central bank can simultaneously support and tighten financial conditions without any severe consequences occurring. With that being said, there certainly areas such as CRE which are at risk of deeper economic woes, something I’ll be diving deeper into in a report, but from a private sector perspective, both the corporation and household have proven resilient to rising borrowing costs through the year.
Thanks for getting to the end of this piece.
As always, I appreciate your support and readership.
Let me know what you would like me to dive into next.