
Any Alpha FOMC ?
Monetary Policy vs Fiscal Policy: A Battle of Titans

Hey guys,
Yesterday was FOMC, so let’s take a look at what this means for the U.S economy and get an update of our macro view of the U.S.
Fed Stalemate
That’s one way of describing the recent FOMC press conference by Jay Powell last night.
There was little to almost no change in Jay Powell’s language since the September FOMC meeting, apart from the citing of “stronger” Q3 annualised real growth which clocked in at 4.9%. The Fed released its Beige Book report over a week ago, many of you might not be familiar with the Beige Book so let me explain.
“The Beige Book is a Federal Reserve System publication about current economic conditions across the 12 Federal Reserve Districts.”
Those 12 districts are, San Francisco, Minneapolis, Michigan, Philadelphia, Chicago, Dallas, Kansas, Atlanta, Richmond, St Loius, Cleveland and of course New York, the trading desk for all open market operations (repos & RRPs). The Beige Book congregates regional economic conditions and prospects based on a variety of mostly qualitative information (surveys), gathered directly from each District’s sources which mostly derive from banks, financial institutions/market experts.
The Beige Book echoed a similar message to that of Jay Powell, which was, there are no new developments within the economy. I don’t particularly agree with that; such reports analyse the moving parts on the surface level, there’s always more to tell when looking beneath the hood of the U.S economy. So let’s get an update on the state of private-sector credit conditions.
Private Sector Financial Conditions
As many of you will know, I like to bring forward previous lessons from my reports to, ensure that you retain all of the new information being presented and two, to keep newcomers in the loop of certain macro concepts. We’re looking at private sector credit conditions; when trying to analyse how tight monetary policy for the private sector is, you need to look at mortgage rates for households and long-term borrowing rates for corporations. Households represent the non-financial private sector, households are key drivers of GDP.
During the press conference, Jay referenced consumer spending as the reason for strong GDP data.
“In the third quarter, real GDP is estimated to have risen at an outsized annual rate of 4.9 percent, boosted by a surge in consumer spending”
— Jay Powell, Fed Chair
Now to my surprise consumer spending remained robust through September and October, boasting two of the strongest MoM readings we’ve seen YTD.
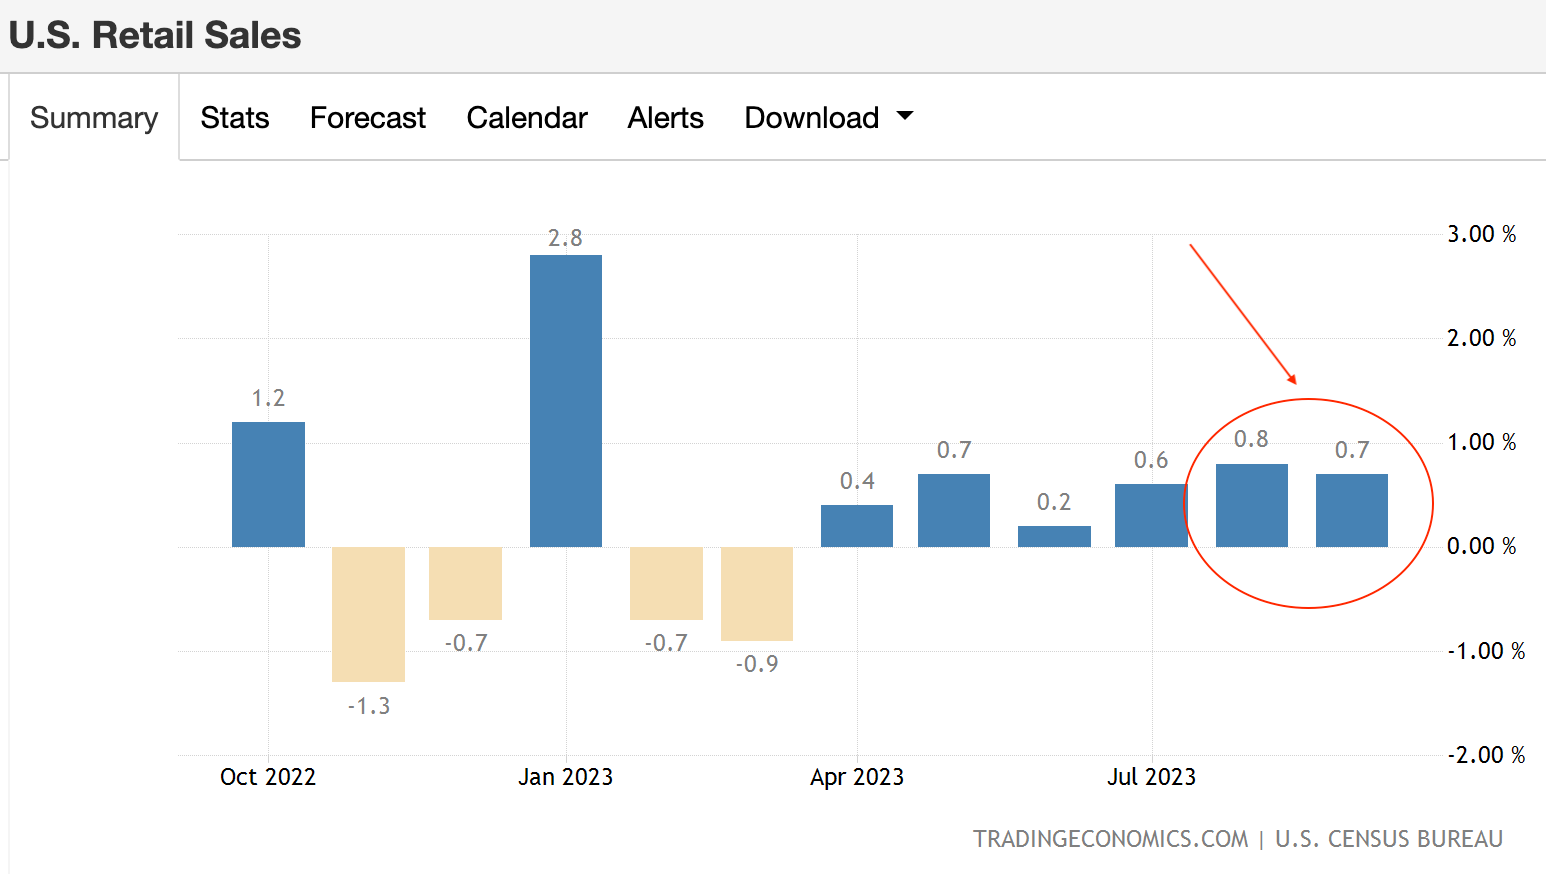
Here’s why this is a relative surprise. October marks the month when 45 million people with student loans resume their monthly payments, which average out monthly to be $200. That means roughly $9 billion will be removed from consumer spending every month, or annually, $108 billion a year. Everything is based on relativity, so to gauge the impact on the U.S economy we have to first understand how much the U.S consumer spends annually.
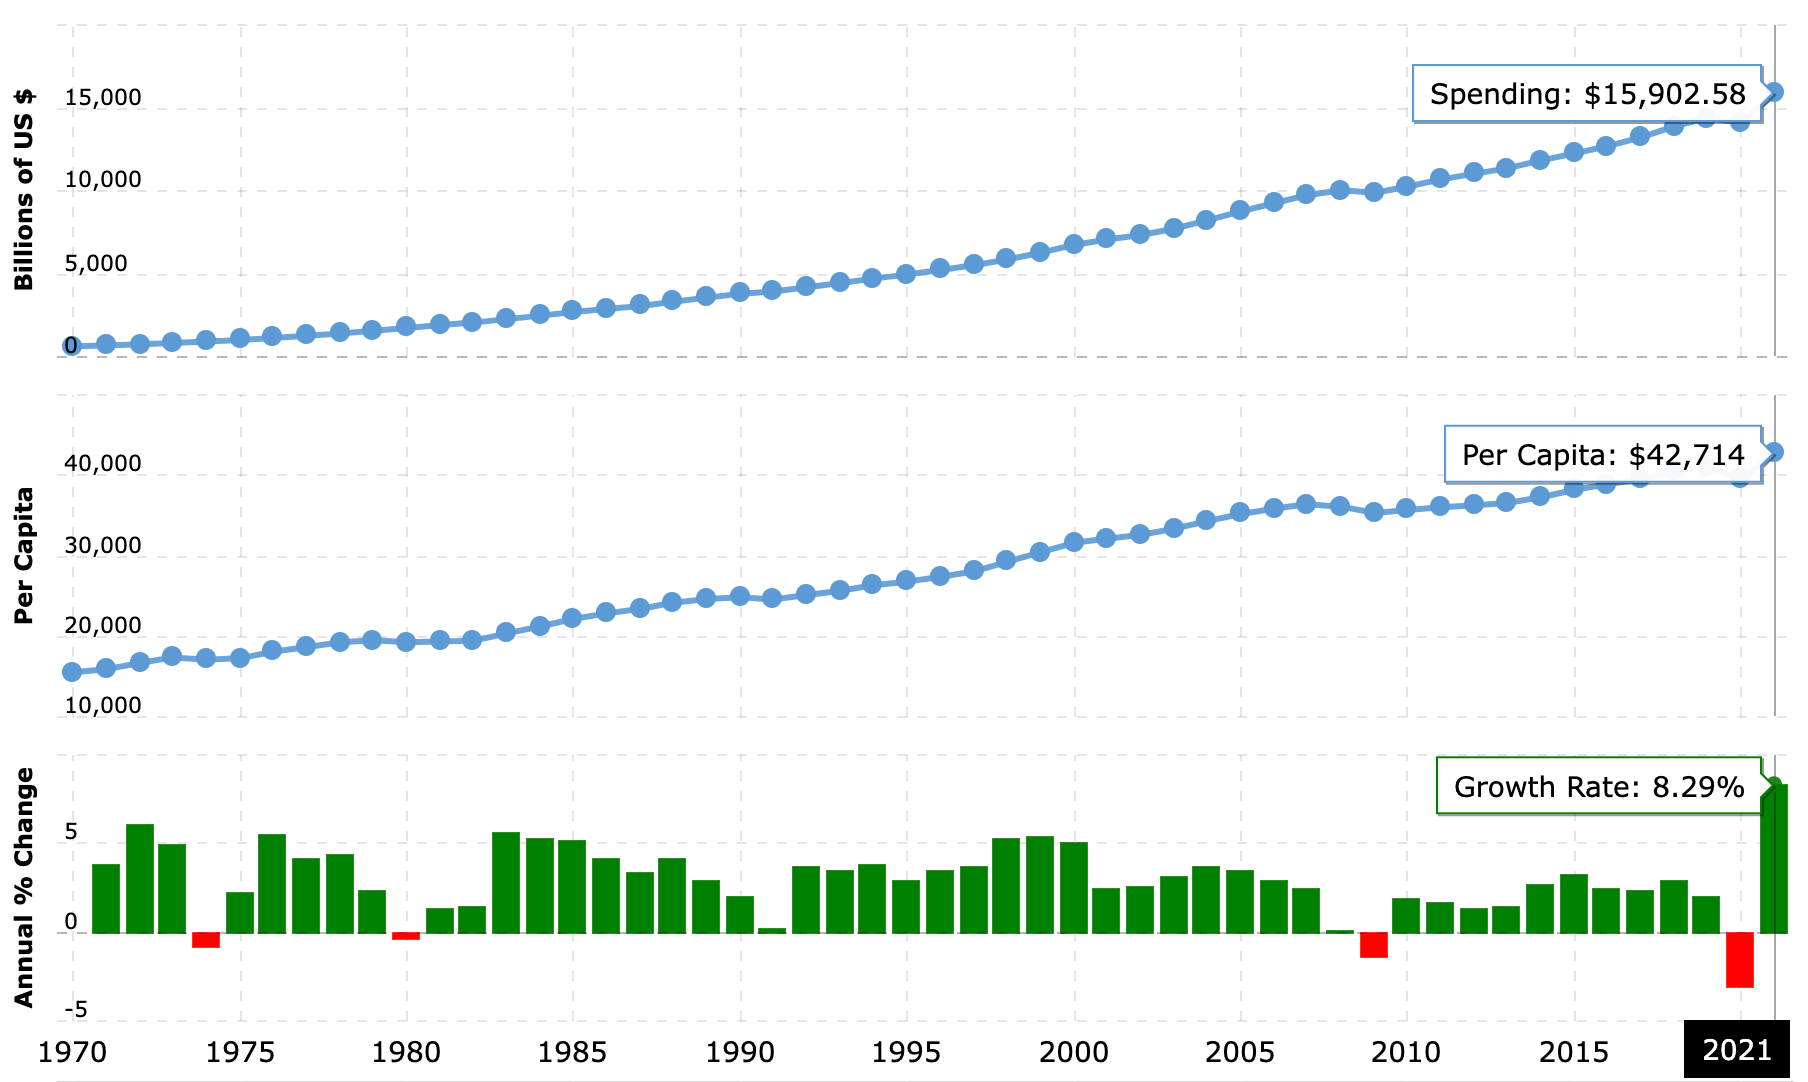
On a 3-year adjusted basis, the U.S consumer spent $14.8 trillion each year. The $108 billion removed from annual consumer spending accounts for roughly 0.73% of total annual consumer spending. Yes, now in hindsight, that figure represents a small amount of the annual figure, but, it’s still important because this amount is now being used to pay down private sector debt which may affect the behaviour patterns of consumers with this debt realised. I believe that this behavioural shift will relay into consumer spending habits with less discretionary income.
Next in line to asses private household credit conditions is mortgage rates. Why? Simply because the largest interest rate exposure households have lies within their properties.
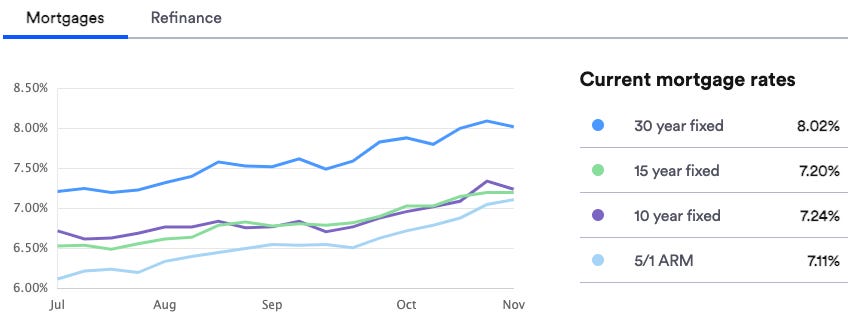
Since July, mortgage rates have rallied 100bps crushing any consumers looking to enter the housing market, but that’s where it stops. New home sales.
“We have the most unique mortgage market, 98% of all mortgages are fixed, 30y fixed, so the transmission of higher rates in the U.S economy just takes much longer to impact the economy…”
Larry Fink — CEO of Blackrock
This is an excerpt from the Future Investment Initiative conference in Saudi Arabia last week, where Larry Summers was asked about his view of a soft or hard landing for the U.S. economy in 2024. To see what’s going on a bit deeper here’s the US10Y against the 30-year fixed rate mortgage average in the U.S compiled by Freddie Mac, a government agency.
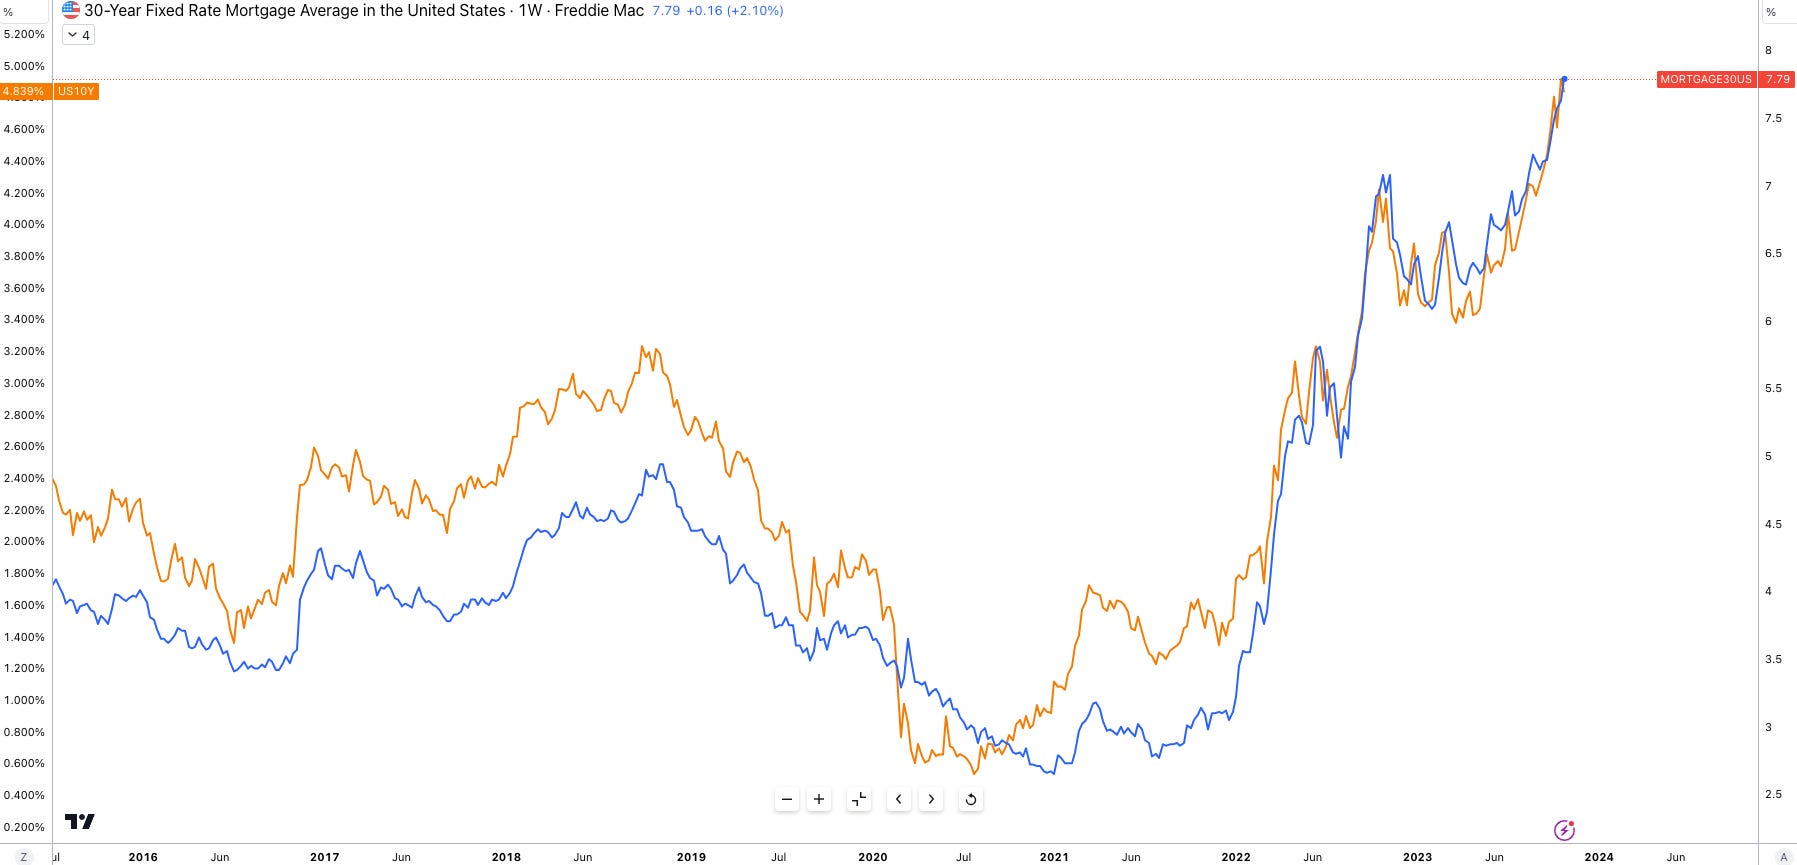
The US10Y is the benchmark for all borrowing costs and it’s clear that the bear-steepening (long-end yields rallying faster than shorter-dated bonds), is the root cause. Since July 03 until today, the 2s (US2y) has rallied 12bps erasing much of its large steepening after the September 20th Fed meeting, whilst the 10s have rallied 88bps.
For private sector corporations, the story is much of the same. Companies can withstand the effects of higher interest rates until they reach their refinancing cliffs and capital-raising deadlines. For many US firms, these deadlines are still a long way off.
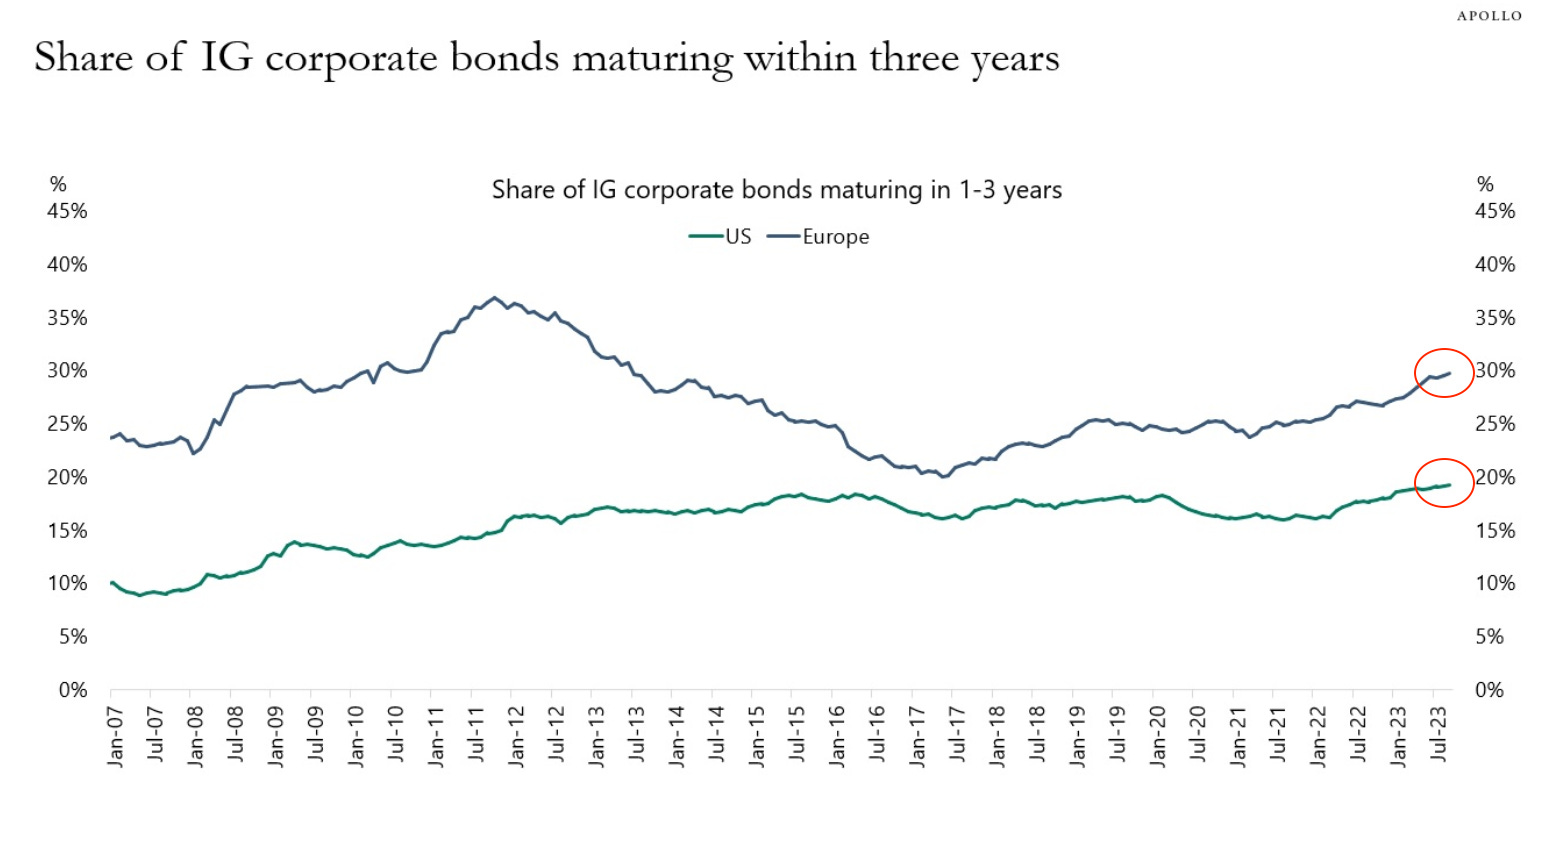
The clear distinction between both economies is made evident through this chart, 30% of European investment grade (IG) bonds will mature over the next 1-3 years whilst the figure stands at only 20% for corporations in the US. It should be clear why US GDP figures are blowing the Western counterparts out of the water. PMI data out of Europe, particularly Germany, France and the UK suggest we’re already seeing the titanic moment across the west. Eurozone Q3 GDP fell 0.1% QoQ, barely staying afloat on a YoY basis, the picture is similar across the UK with slowing growth being the major narrative. The U.S economy can thank one precious piece of its capital markets.
The delayed transmission of interest rates.
Monetary vs Fiscal Policy
It’s often argued that the two policies are polar opposites, but I believe both policy tools should work in unison and to be frank, the US government has proved that over the past year with the Biden Administration. I’ll delve into the details later on, but first, observe what Jay’s saying here.
“we have decreased our securities holdings by more than $1 trillion.
Our restrictive stance of monetary policy is putting downward pressure on economic activity and inflation”— Jay Powell, Fed Chair
He is correct, the Fed’s restrictive policy is putting downward pressure on economic activity and inflation, but what about the government’s fiscal decisions? Bingo. The issue doesn’t lie with monetary policy anymore, it lies solely within the fiscal side of policy decisions. The IRA signed into law on August 16 2022 is expected to amount to c.$369 billion, the $1 trillion infrastructure bill and the $280 billion CHIPS act all totalling more than $1.5 trillion.
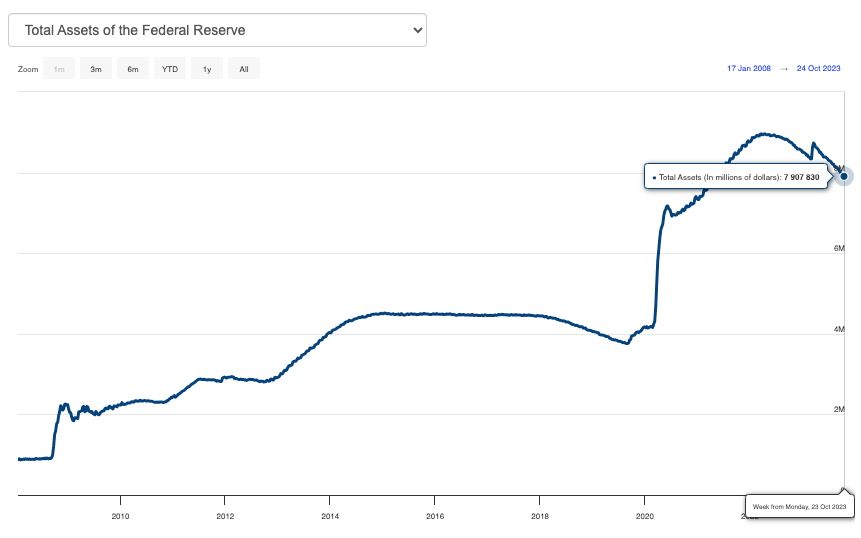
This is the largest fiscal stimulus, coinciding with efforts by the Fed to rein in inflation and address its bloated balance sheet.
So we have monetary and fiscal policies battling each other which leaves asset markets in a vulnerable position; U.S markets are very resilient in the face of high rates and with the Treasury set to issue a large amount of bills and notes, the most probable scenario will remain the bear steepener trade towards long end yields but at a much slower rate as we enter 2024.
As for now, further decision-making at the Fed will remain relatively quiet as they allow higher real rates to do the remainder of the tightening.
I hope you enjoyed!
As always, share with a friend, it goes a long way in helping this publication