
10 Charts Signaling a Small Equity Drawdown
Why structural tailwinds remain, but shifting cross-asset flows and extreme positioning suggest a 3-5% reset is overdue

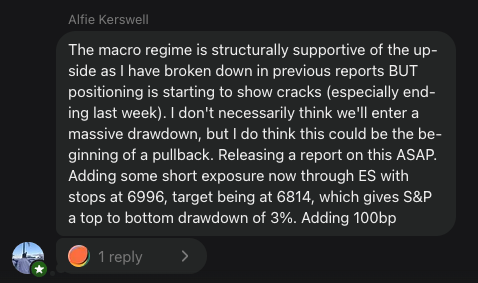
I added a note in the Substack chat mentioning that I was going to go short on ES with a relatively close target. I am going to break down in this report why I think we are still structurally supported for upside in equities; however, risks are building. While this could be a mere pullback, I do not think we are entering a bear market at all.
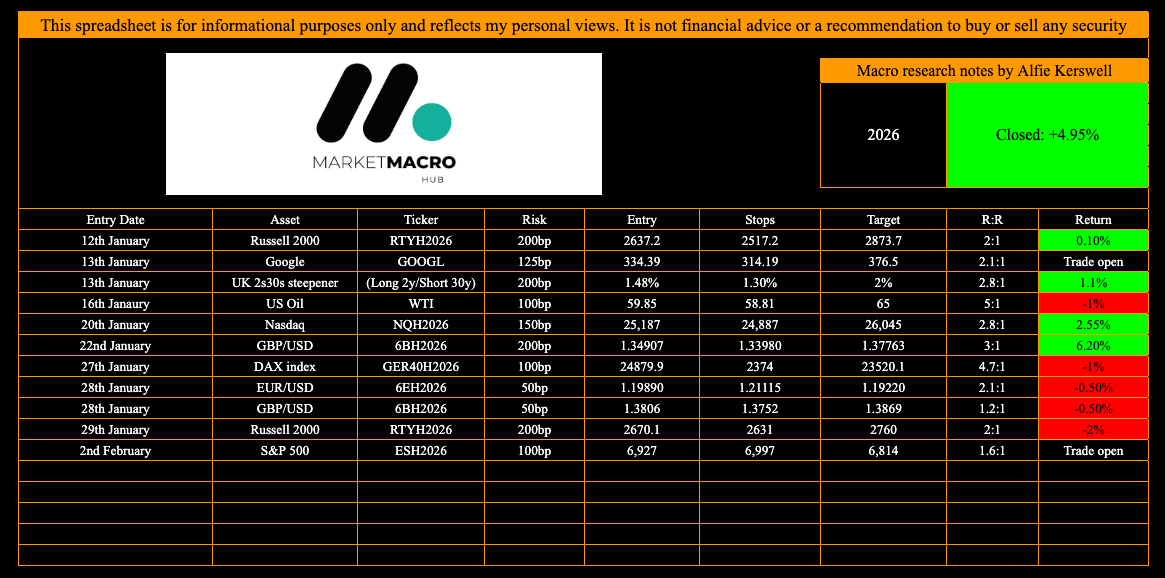
Current trade tracker:
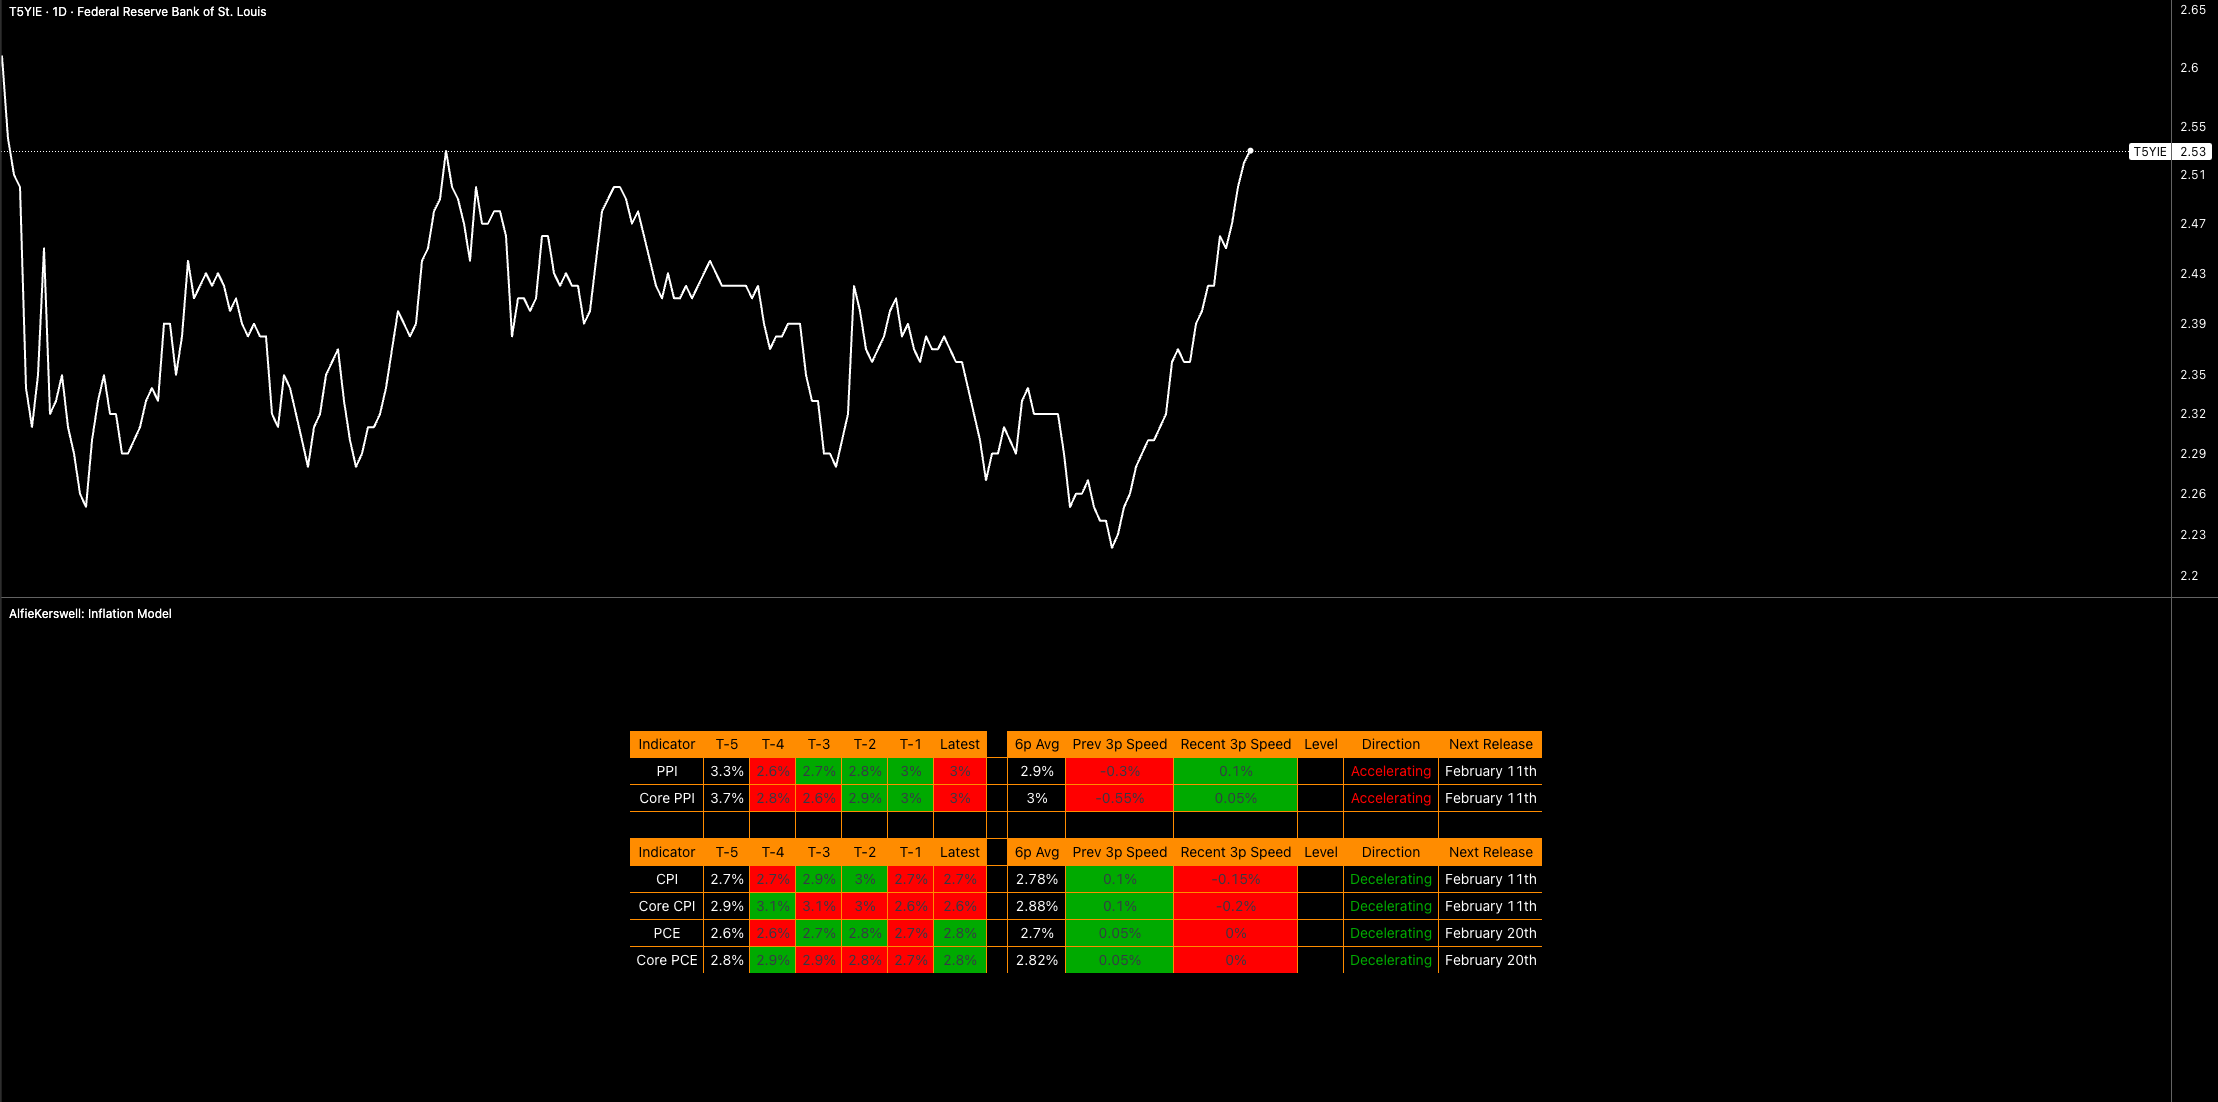
Firstly, notice how there is a divergence between inflation figures on a 3m/3m basis and breakevens. The market is clearly seeing higher inflationary pressures and views the rotation setup as temporary, adding more stickiness in the near future. This is definitely not a cause for concern yet in equities, as growth is still outperforming inflation. Credit risk is lower than duration risk in the system, which we have seen evidently in how bonds have traded recently.
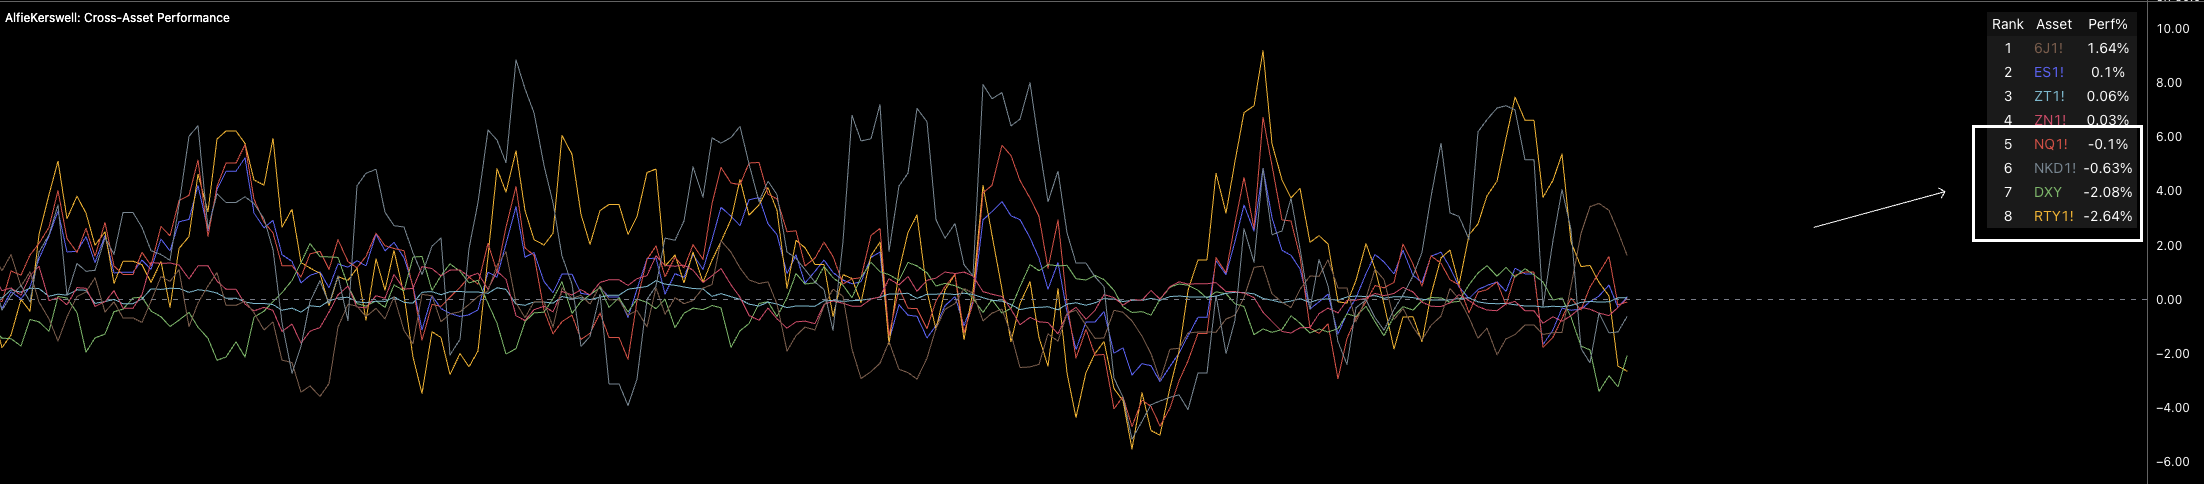
Across the last 10 days, equity rotation has shifted and we’re seeing risk move toward safety: ES > NQ > RTY. Once again, this shift isn’t a direct signal that we’re topping out, as this setup happens many times while we are still rallying. However, NQ and RTY are negative as ES barely holds positive in a messy range, with further factors building to the downside.
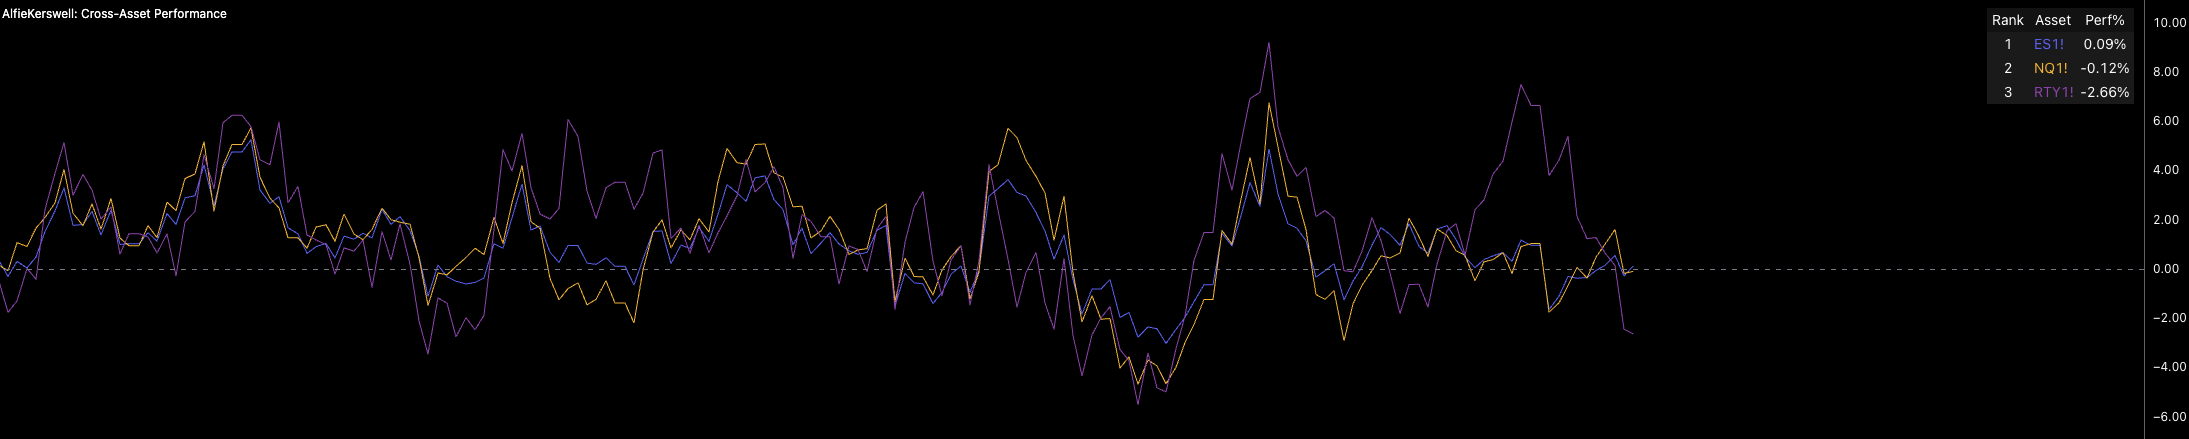
Notice from a cross-asset performance stance that we’re seeing the highest-risk equity indices trade at the bottom of the table. With the Yen, bonds, and ES making their way into the top half, it is clearly a small rotation, but pressures are building, especially after the VIX blew out a little last week.
Now VIX is trading positive on a Z-score basis as equity Z-scores rotate to the downside. Clearly, there are more tensions in volatility as equity positioning shifts, causing a negative Z-score for equities. That is not something you want to see when positioning to the upside.
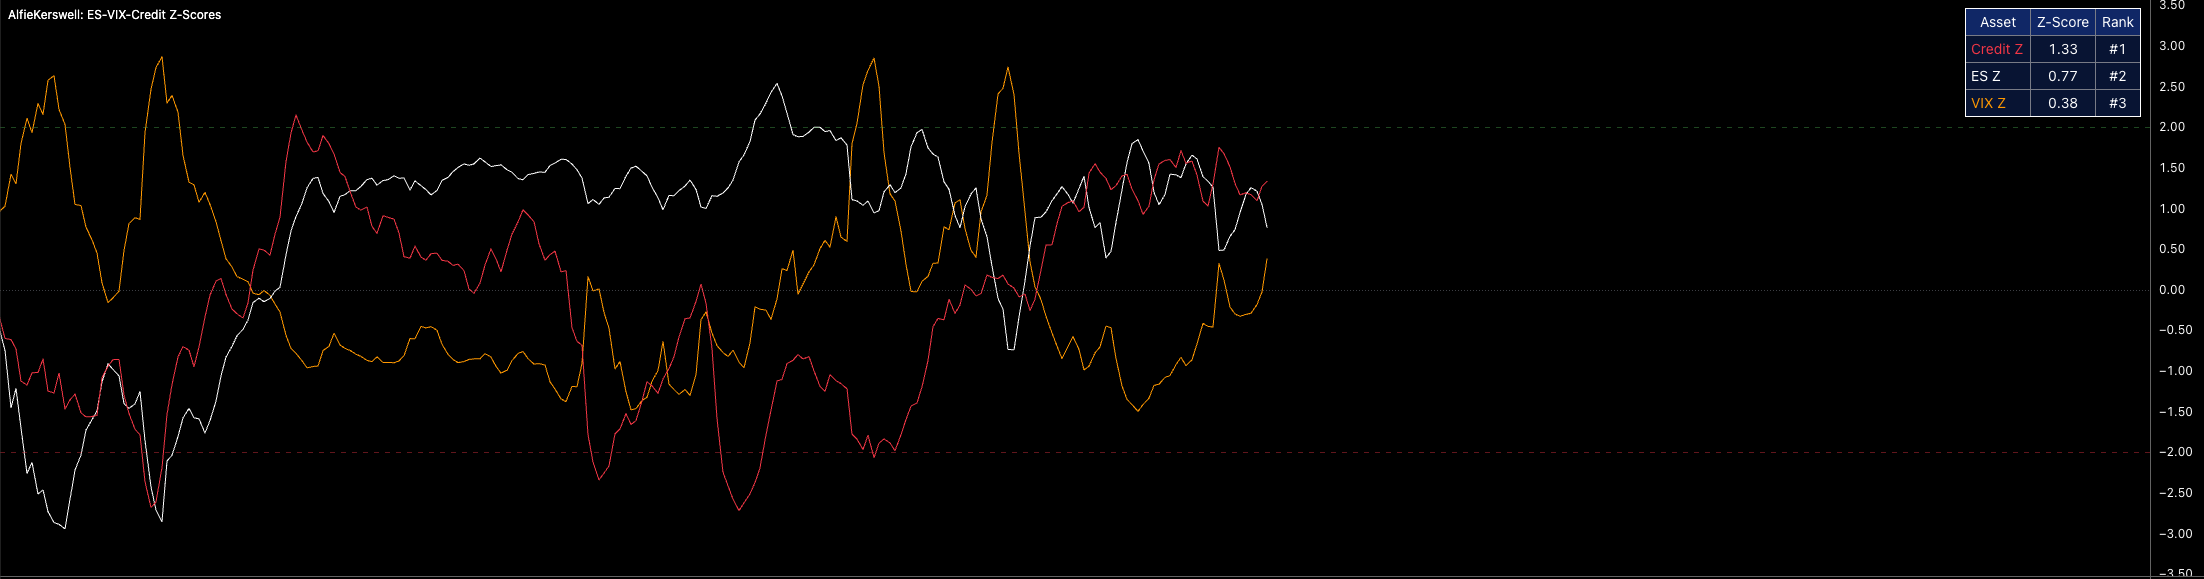
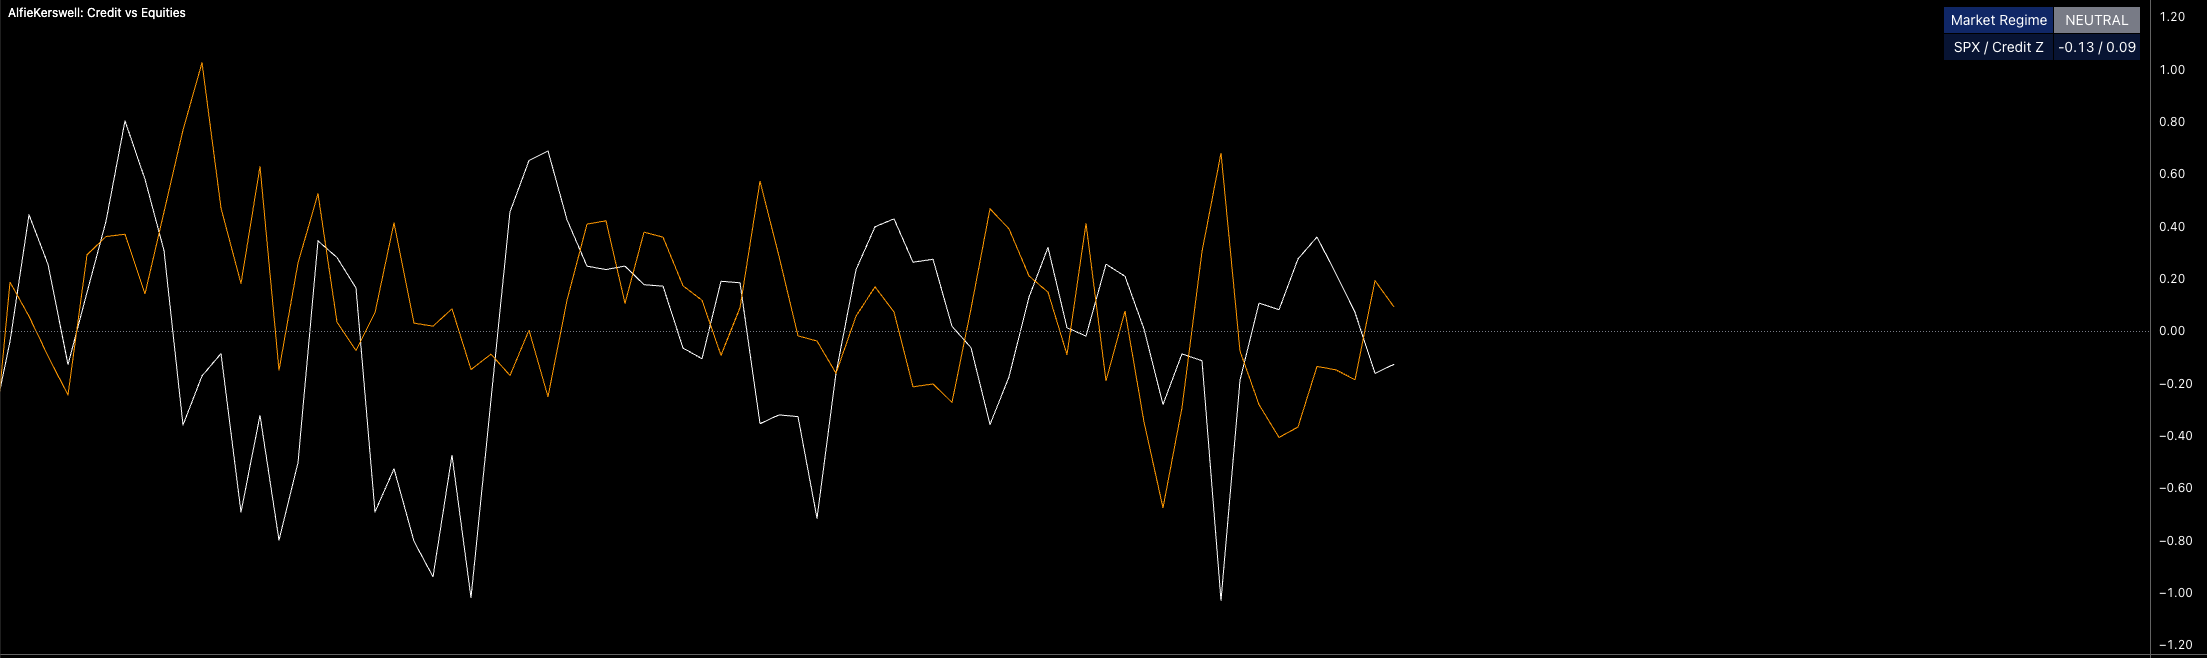
Credit has also flipped and is beginning to outperform equities on a Z-score basis as equities flip negative; this is a clear sign. I do not think there is a credit issue (no way, not yet) but what it shows is that higher volatility leads to higher-yield credit spreads, which is causing credit to be more volatile. The chart below is a very clear indicator of small equity drawdowns when credit Z-scores are positive and equity Z-scores are negative, showing a shift in positioning and risk appetite.
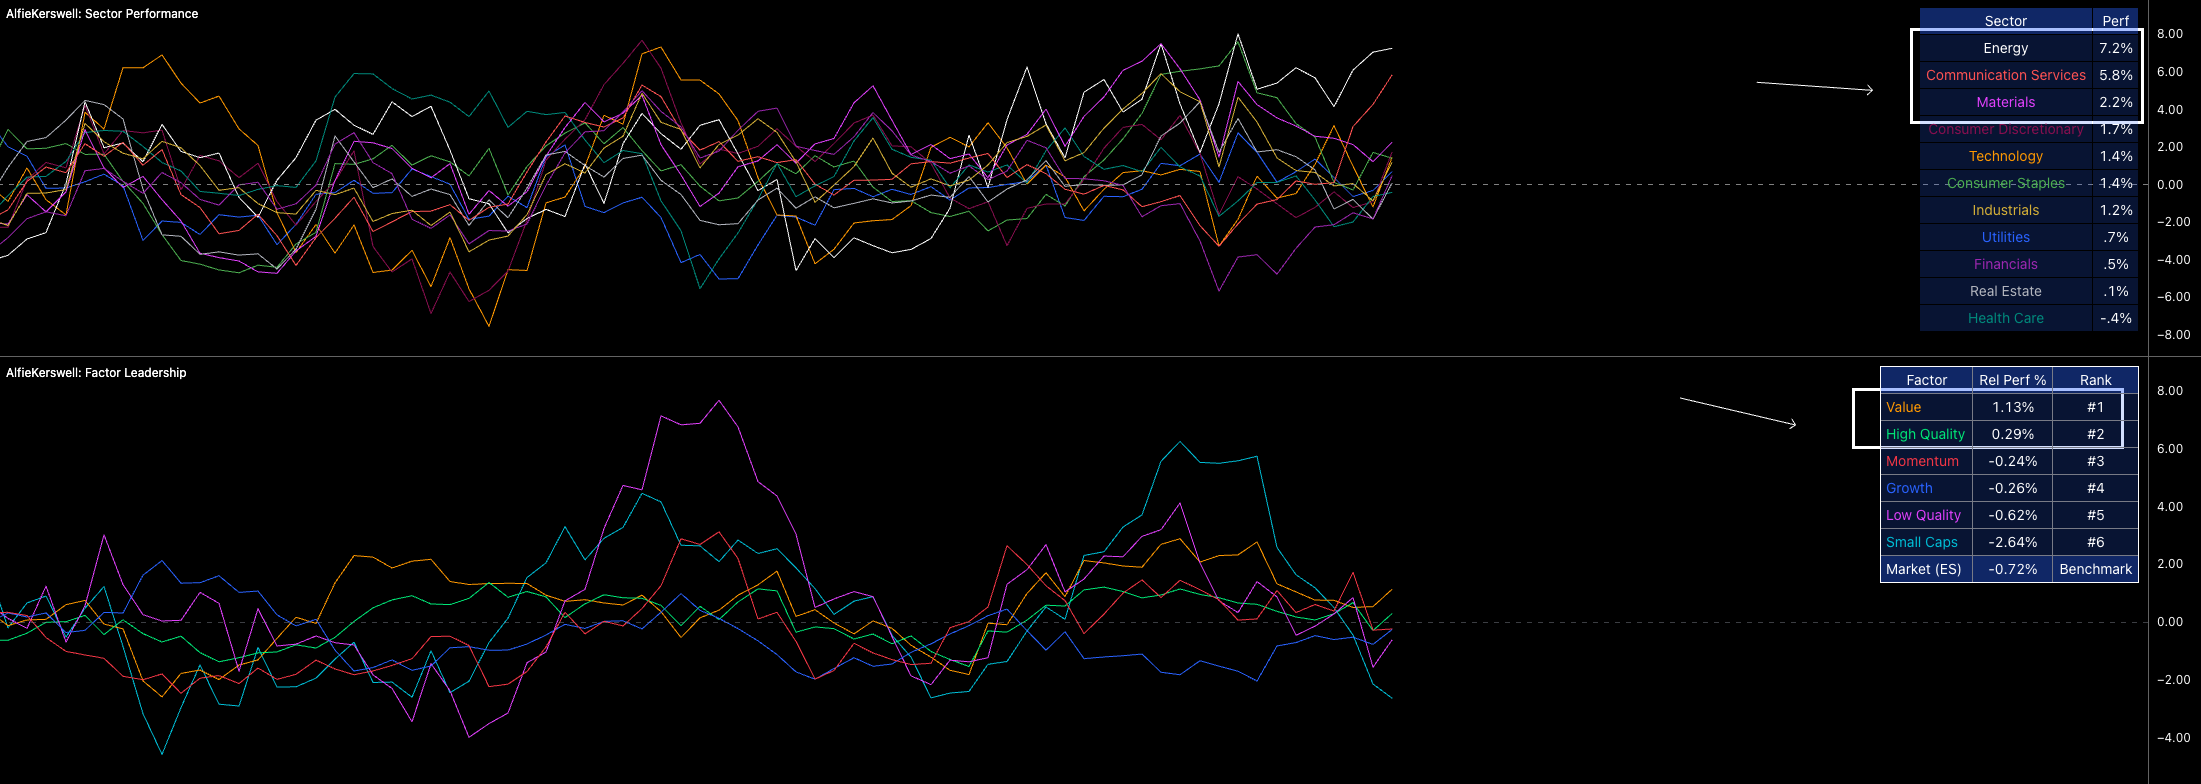
Probably the most telling factor is that sector performance and factor exposure across the last 10 trading days have shown that investors aren't carrying risk in higher risk-on sectors or factors. Value and growth are preferred as consumer discretionary leads alongside energy. While energy has been driven by the blowout in oil, I wouldn't disregard it just because it’s oil-related; in fact, that builds the case further because it shows just how volatile the last two trading weeks have been.
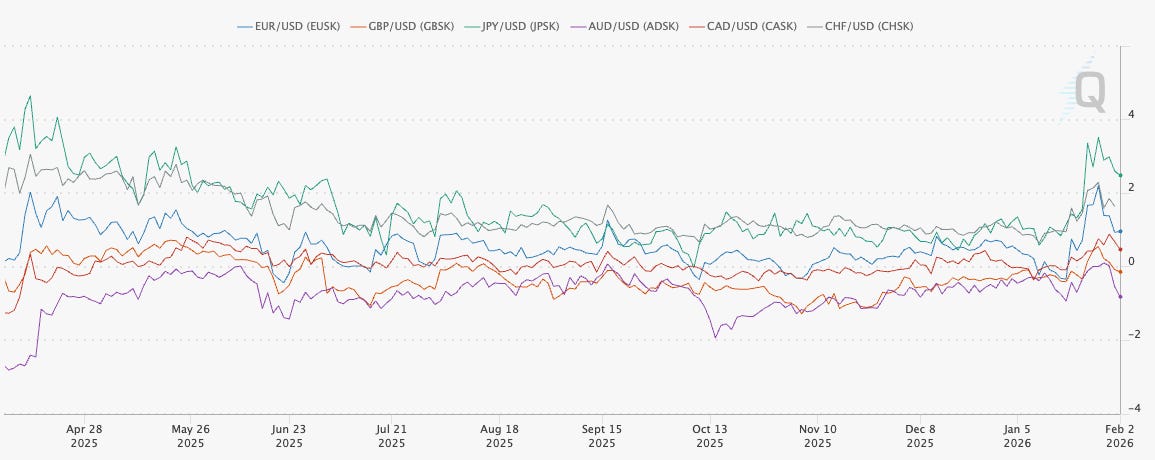
Now look at how the skew for USD FX pairs has shifted to the downside, yet positioning hasn’t followed much. Even when we saw this massive blowout in skew to the upside, we didn’t see equal pressure to the upside in equity indices. There is definitely some fatigue, but what could happen is that equities become more sensitive to downside skews, which will be telling as it looks like we’ve created a top in skew here. Implied volatility across these FX pairs is also starting to drop.
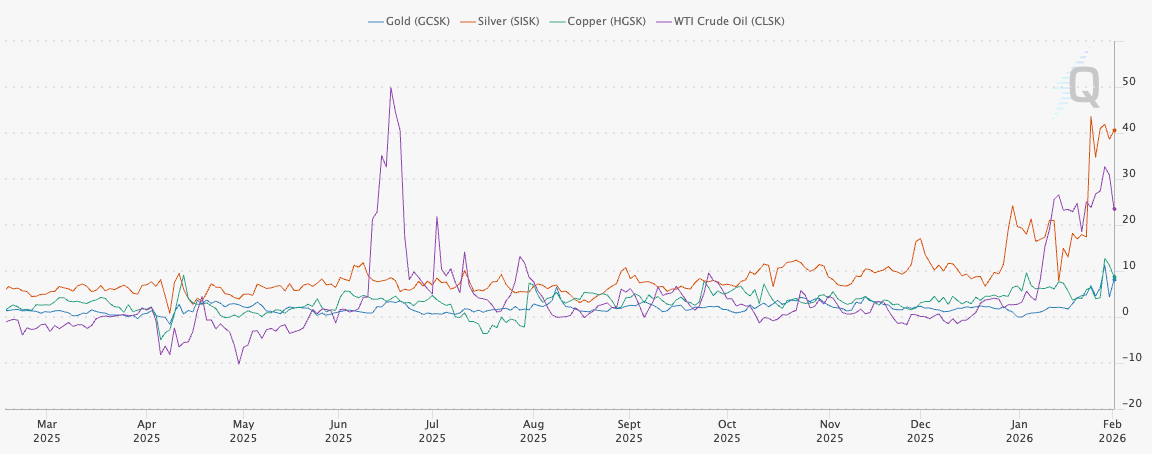
A shift in positioning (finally) for metals is also underway. Implied volatility is still high but slowing, while skew looks like it could shift. This will lead to big changes and rotations in portfolios (if the sell-off in metals hasn’t already) as managers rebalance their exposure.
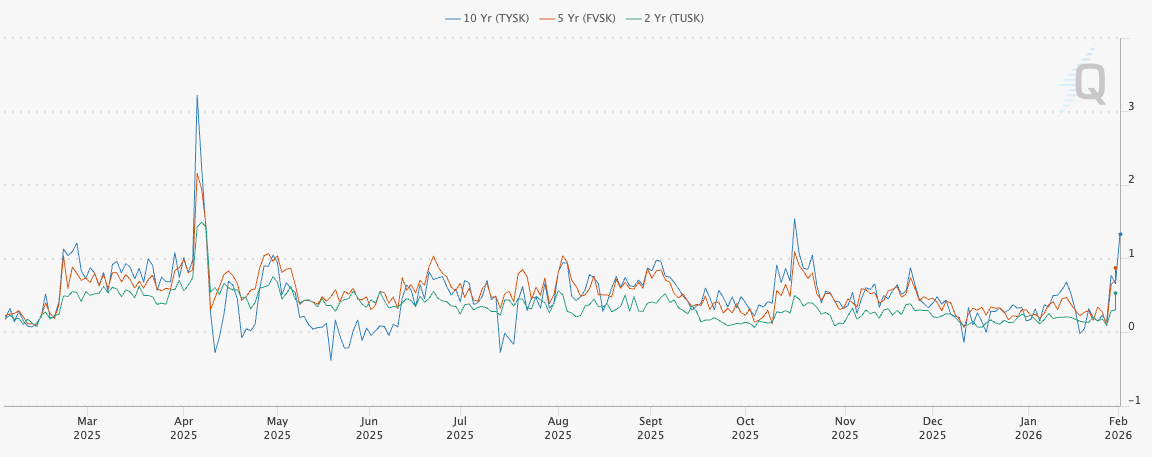
Skew for 2Y, 5Y, and 10Y bonds is also rallying with some pace from lows. Some might say this is directly connected to the newly nominated Warsh (I don’t have an opinion on whether it is, but if I had to, I’d likely say it isn’t); regardless, positioning is still skewing to the upside in bonds. While equities can trade higher alongside bonds, when bond skew is blowing out to the upside, it’s not always pretty for equities.
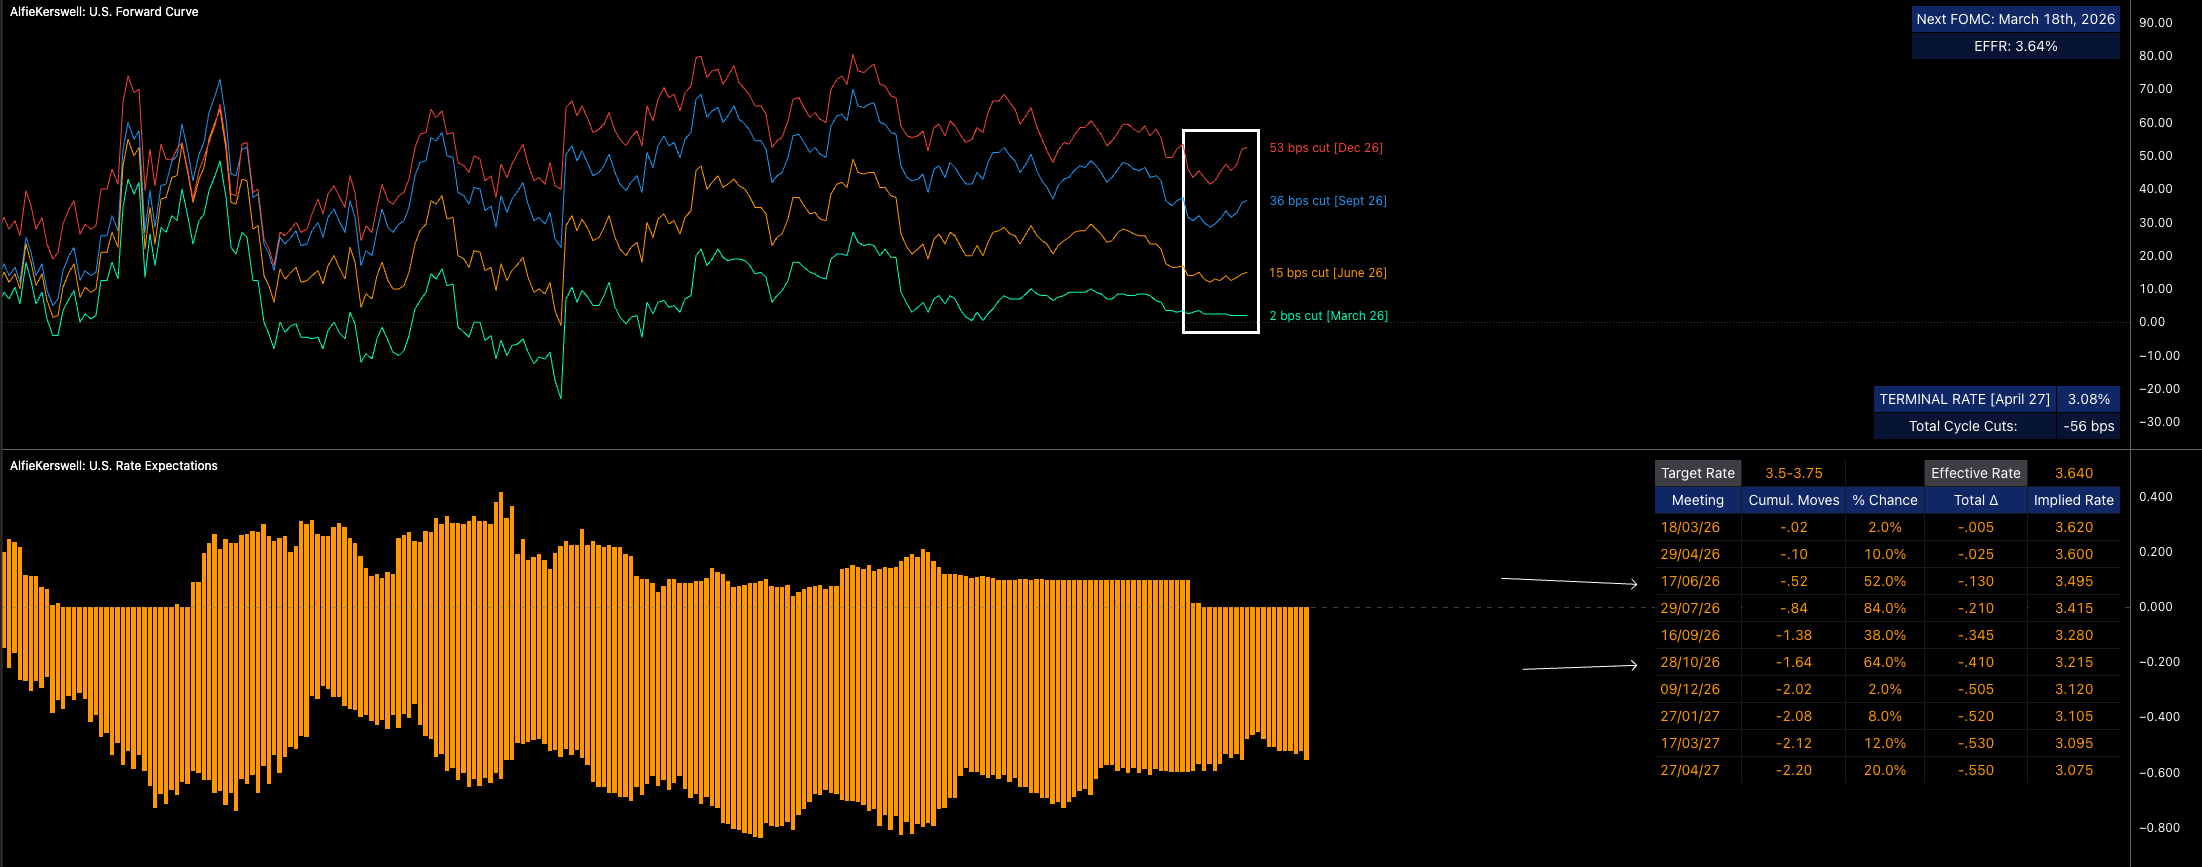
Look at the forward curve below. We actually began pricing in more cuts (marginally, yes, but besides the point, still more cuts) and ES has had no reaction to the upside. I did actually mention in my previous report how the forward curve is causing less upside in equities; likewise, I don't think a hawkish shift would cause major downside because I think we are at an extreme in the forward curve which can’t really get much more hawkish (well, it can, but it wouldn’t make sense).
So here’s how I see things: we are structurally supportive of the upside in equities, but positioning does not favor me being long here. Much has shifted since Friday, and I think a small top-to-bottom drawdown of 3-5% makes total sense. I’m targeting the low side (-3%), but it will be key to watch the 2s10s and 10s30s to see how they react across the next trading week.
interesting post, are your indicators public? if not could you make those public, would be interesting to watch